Introduction
“Watch out! Pothole ahead!”
In a few months, many will be thankful that winter in West Michigan will have come to another end. In the winter, thousands of cars drive on roads that experience severe freeze-thaw cycles. Consequently, many potholes form. These potholes, in turn, cause many parts of the automobile’s steering system and suspension system to experience strain.
Automobile parts experience a certain level of fatigue due to the vibrations that occur while driving these roads. Over time, the fatigue will lead to some mechanical failure of the steering or suspension system.
When an automobile undergoes severe vibration from potholes and other road irregularities, which parameter – displacement of the automobile part or the velocity of the automobile part – is the primary contributing factor that affects strain? In the following study, the relationships between strain and displacement and strain and velocity are examined.
Background
Strain is “a dimensionless ratio . . . defined as the ratio of elongation with respect to the original length: ε=(L’- L)/L” (Efunda).
Based on this definition, one would expect that the strain measured on a vibrating beam, for example, would be directly proportional to the displacement that the beam experiences. The strain gauge changes its resistance as it is compressed or stretched as the beam is deflected during vibration. The compression or stretch is directly related to the compression and stretch of the vibrating beam. Therefore, it could be argued that strain is proportional to the displacement of the beam.
On the other hand, in the 1969 paper Modal Velocity as a Criterion of Shock Severity, Gaberson and Chalmers write, “although no generalizations for all structures can be made, the results certainly lead one to expect that velocity is the single, most directly damage-related dynamic motion property” (pg 38).
In the paper, they derive formulae that demonstrate their point (pgs 38-42). For “longitudinal vibrations in rods,” they derive the following equation:
(1) 
Where:
- σ is stress
- v is the modal velocity
- E is Young’s modulus
- ρ is the density of the material
For “transverse beam vibrations,” they derive the following equation:
(2) 
Where:
- σ is stress
- v is the modal velocity
- h/n is beam cross-sectional shape factor
- E is Young’s modulus
- ρ is the density of the material
They conclude: “Because of the direct relationship between stress and modal velocity, and the small dynamic range of vibrational velocity in shock, it is apparent that, of the three related parameters, velocity provides maximum measurement efficiency and accuracy” (pg 44).
Tom Irvine weighs in on the discussion with these remarks:
“Modal stress is directly proportional to modal velocity for both free vibration and resonant excitation. The proportionality equation does not depend on frequency, although the velocity itself depends on frequency.
There are limitations to any stress-velocity equation, however. Crandall noted in Reference 26 that stress and velocity may each have concentrations, particularly for nonuniform structures.
Shock response spectra should be plotted in tripartite format so that the effect of displacement, velocity and acceleration can be considered together on a single plot. This plot may be in addition to separate plots of each of the three amplitude metrics.
Again, modal stress is directly proportional to modal velocity. But other failure modes may have better correlation with either displacement or acceleration. Loss of sway space must be considered with respect to relative displacement, for example. Thus attention should be given to each of the three amplitude metrics.”
It appears there is some debate, as well as a degree of uncertainty, regarding which parameter has the greater influence on the strain. Both Gaberson and Irvine refer to dynamic scenarios, whereas the definition of strain itself refers to a static situation. This in and of itself may be a critical clue to the answer in this debate.
Other research documents on the topic are saved on the VRC network at P:Joels Summer 11 filesStrain tests2011.
Summer Study 2011
For our study, we proceeded under the hypothesis that velocity and strain were proportionally related. To demonstrate this, we conducted several tests. In general, the following procedure was used to test our hypothesis.
Strain Gauge (gage)
Two strain gauges were placed in a typical “half-bridge” arrangement (Figures 1- 4). The strain gauges had 120 Ω resistance with a gage factor of 2.07. The amplifier had a gain value of 235. The strain gage sensitivity was calculated to be – 1.23 mV/microstrain (sensitivity = amplification*Gage Factor*Vref/-2e^3); where amplification = Vmeasure/Vstrain. Gage factor is a factory value for stock strain gage; Vref is the voltage input from DCM460.
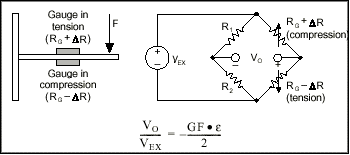
Figure 1. Schematic diagram of strain gauges in “half-bridge” arrangement. (Credit: National Instruments).
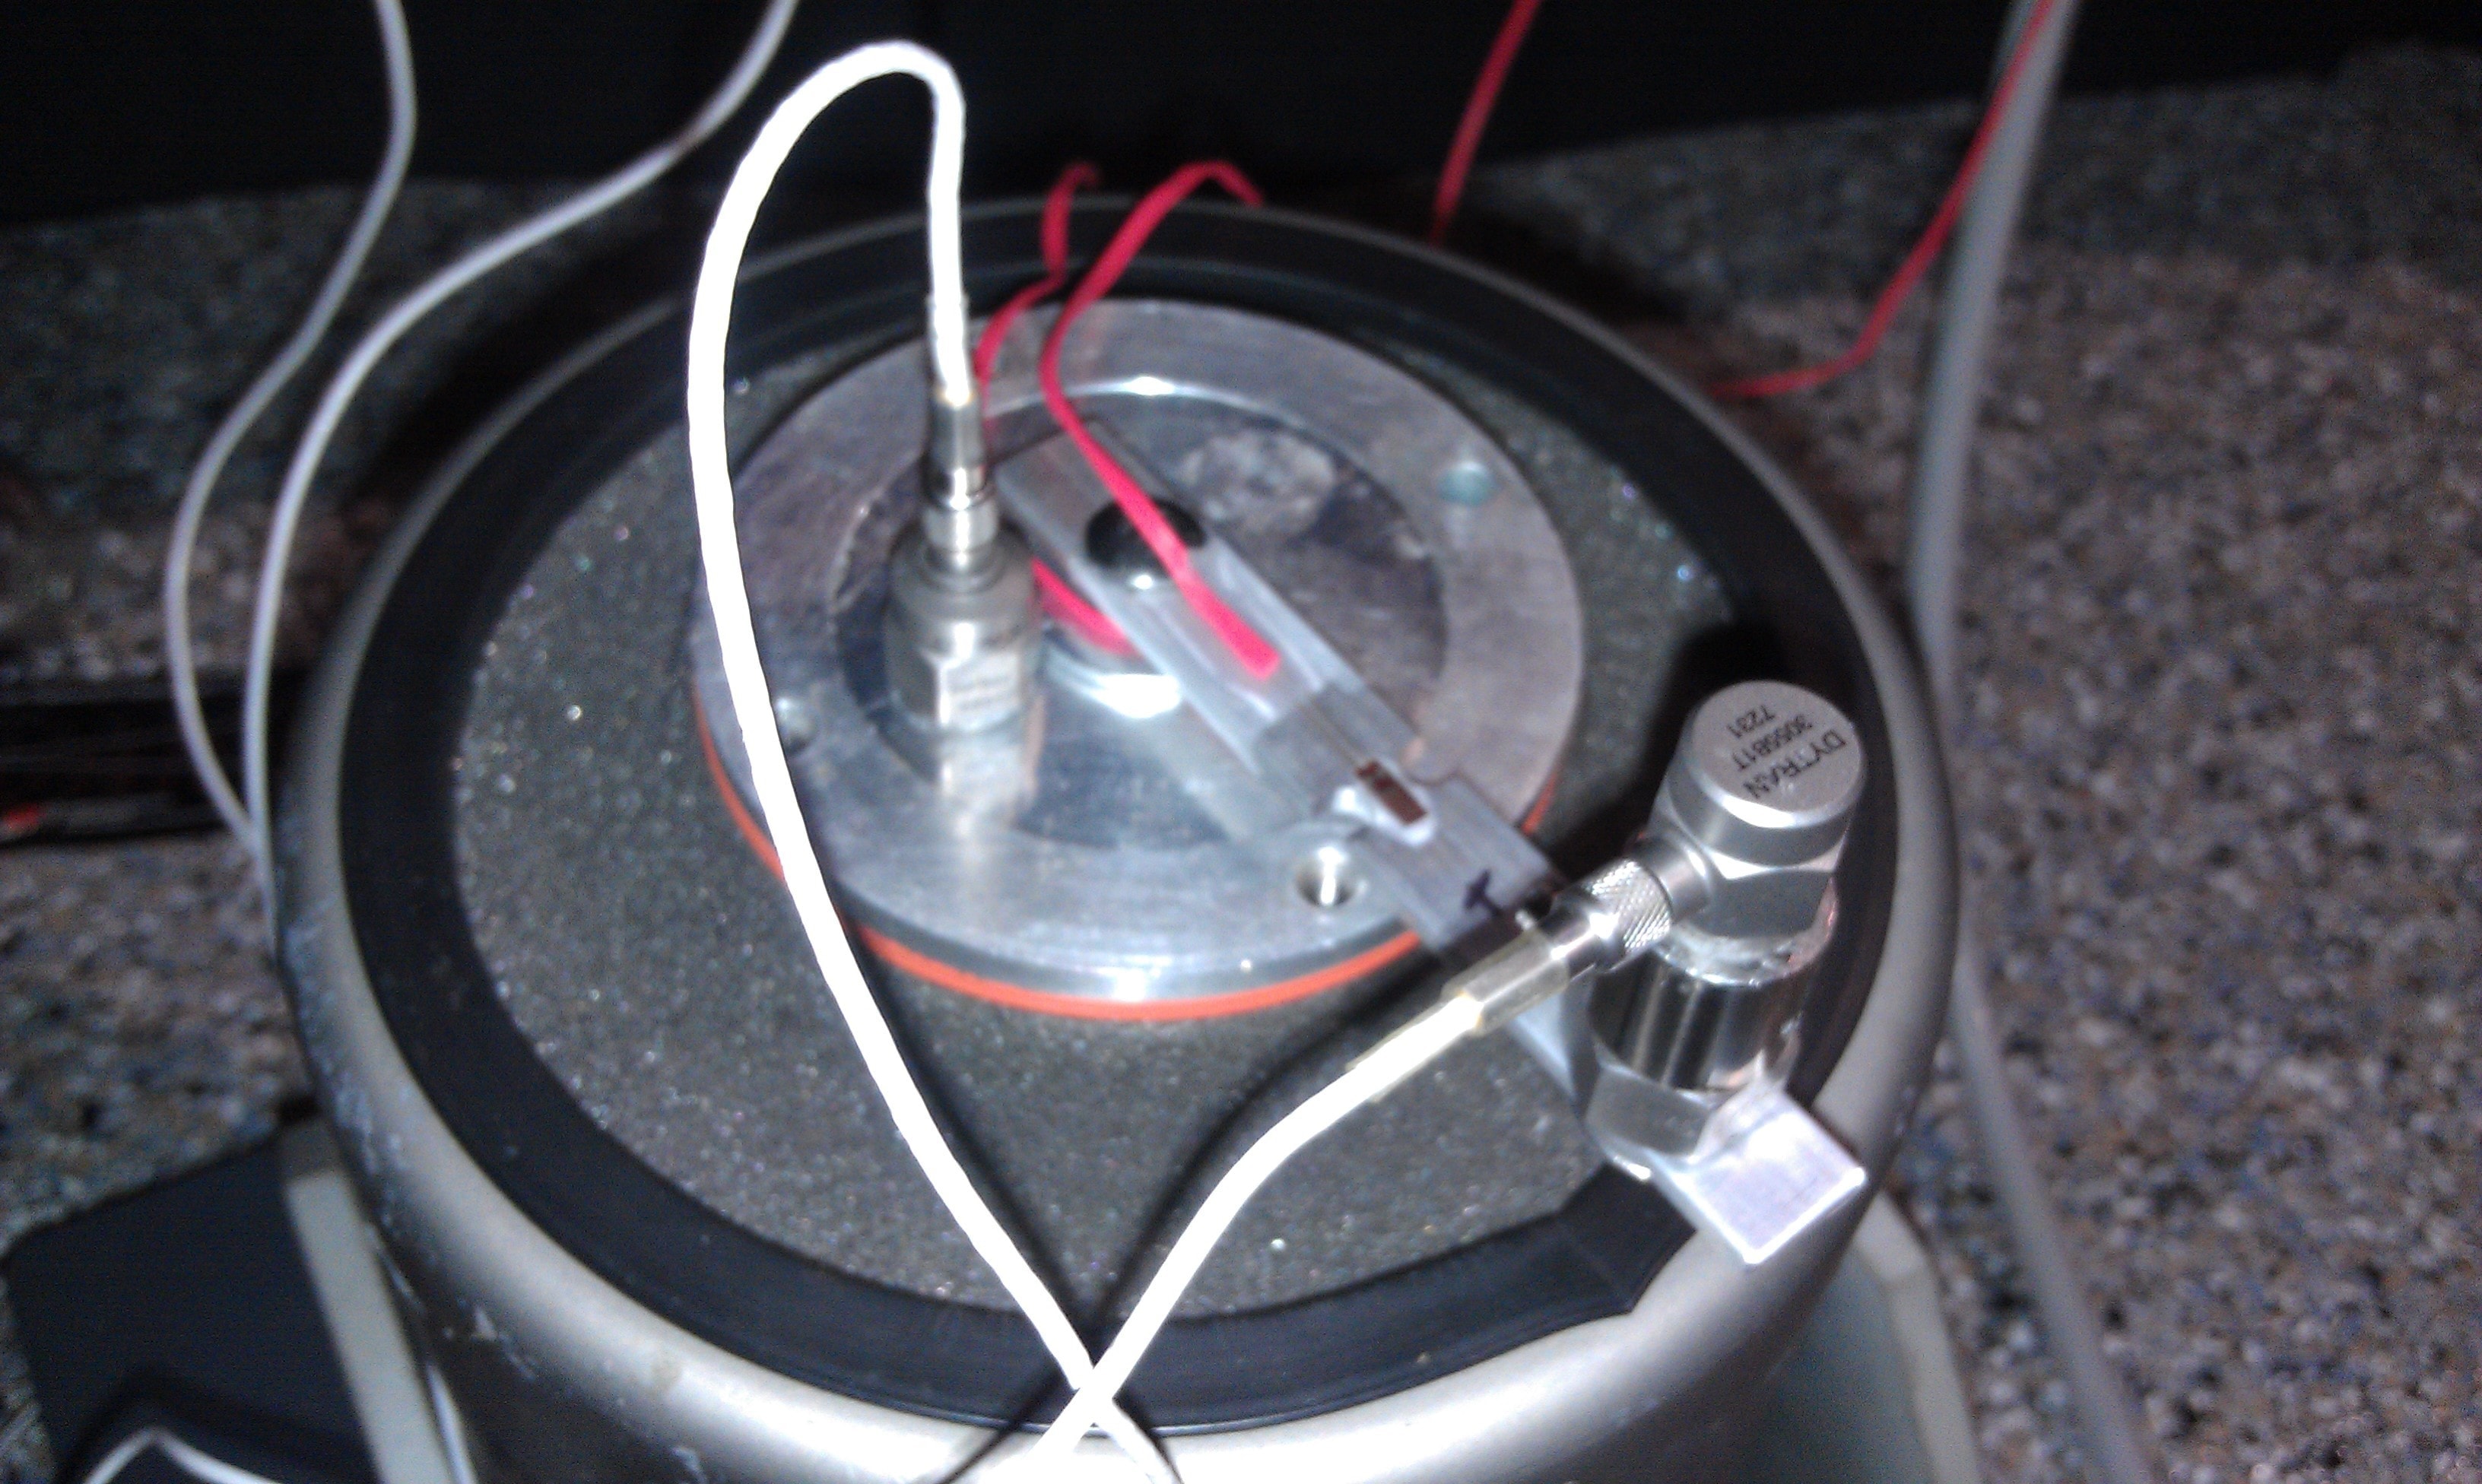
Figure 2. Strain gauge orientation on aluminum beam; one on top and one on bottom of the beam.
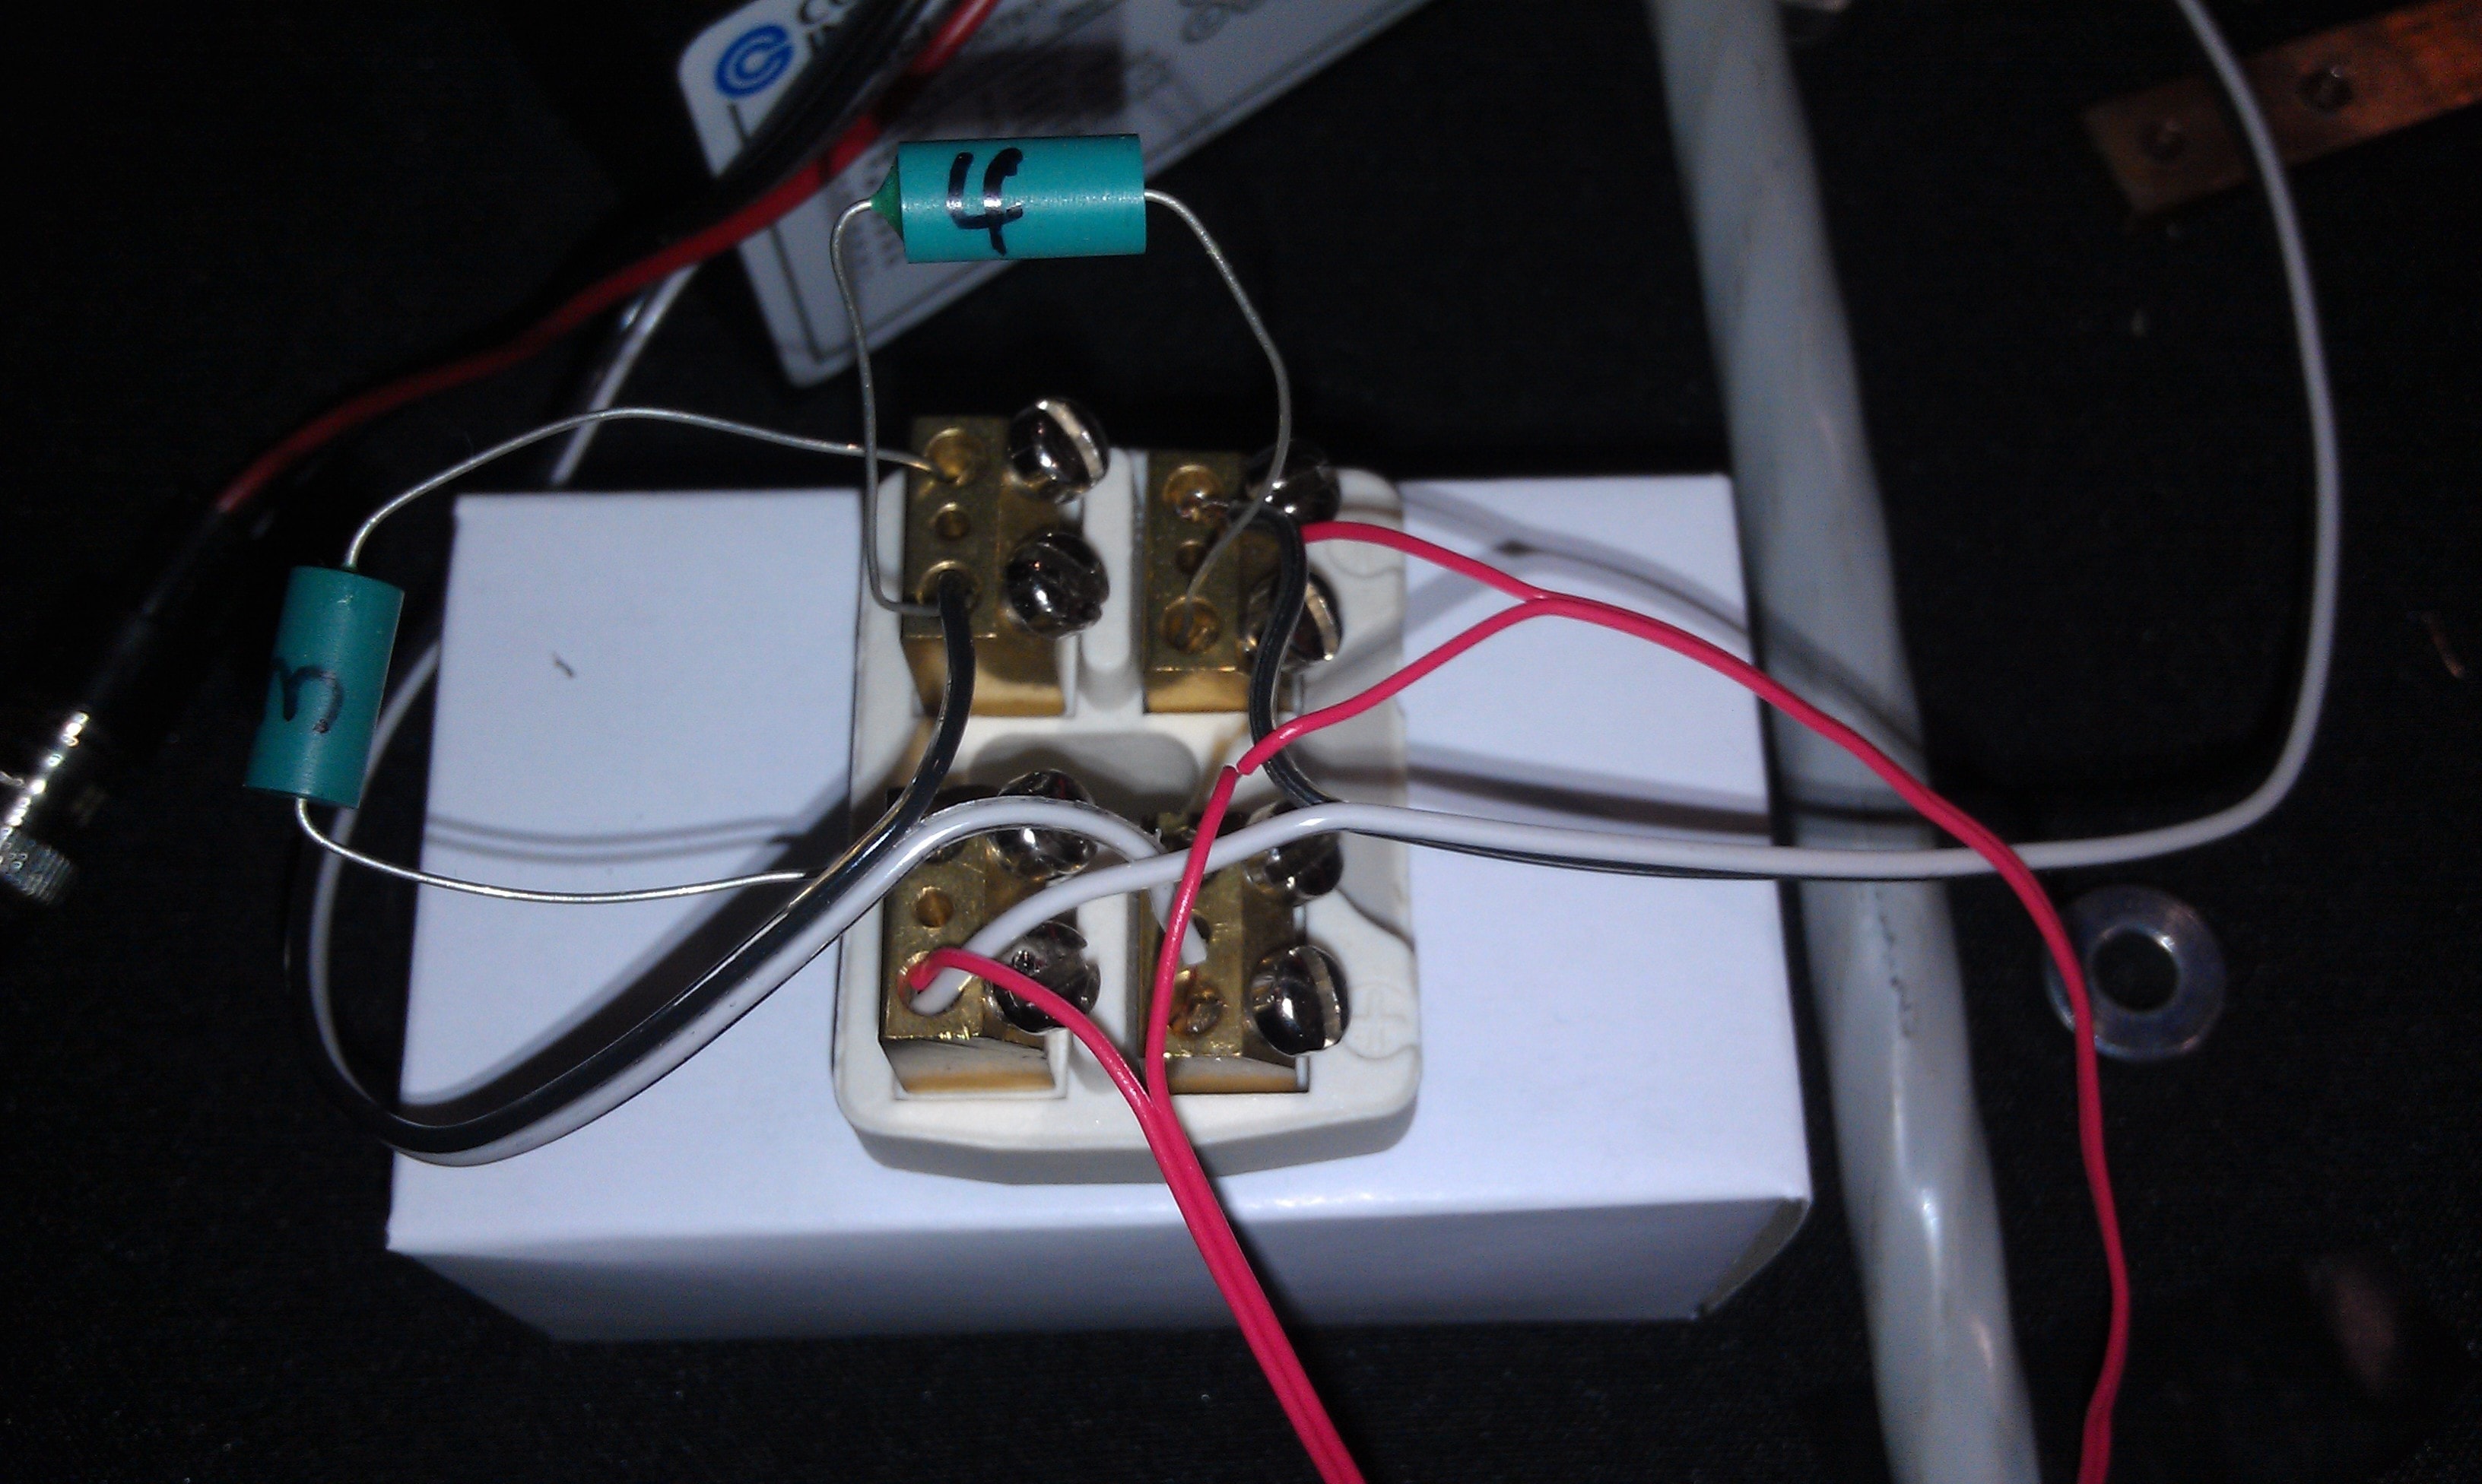
Figure 3. Actual circuitry for “half-bridge” arrangement.

Figure 4. Cooper Instruments DCM 460 Voltage Bridge Amplifier.
Notched Aluminum Test Beam
We used the same stock of notched aluminum test beams as in our 2010 study. The aluminum beam was made of aluminum 6061-T651 stock, milled to have the following dimensions: L=101.34 mm; W=12.75 mm; H=3.10 mm; B=3.79 mm (width at the notch).
An accelerometer was placed on the head of the shaker and another on the end of the beam. Various masses were also added to the end of the beam to change the fundamental resonance of the beam.
The beam was vibrated with a sine sweep from 20Hz to 500Hz. The acceleration of the shaker head and the end of the beam, as well as the strain at the notch, were measured throughout the test. The values for these measurements at the fundamental resonance of the beam were recorded.
The data was analyzed to determine whether the relative (shaker head (ch 4 (tee-off of ch 1) – beam tip (ch 3)) acceleration, velocity, or displacement of the end of the beam was proportionally related to the strain at the notch.
Results
Part A: Graphical Approach
Probably the most “direct” evidence to support our hypothesis was found using a graphical approach. A plot of the relative acceleration of beam vs. frequency, the relative velocity of beam vs. frequency, and the relative displacement vs. frequency were compared. Then, strain at the notch was overlaid on each plot. We then examined which plot most closely matched the strain plot.
From the plots, it appeared that the strain most closely matched the relative velocity vs. frequency plot, particularly through the large resonances. Even when the fundamental resonance changed because of end-beam mass, the results looked similar. The relative velocity plot matched well with the strain at the notch for the large resonances in the beam.
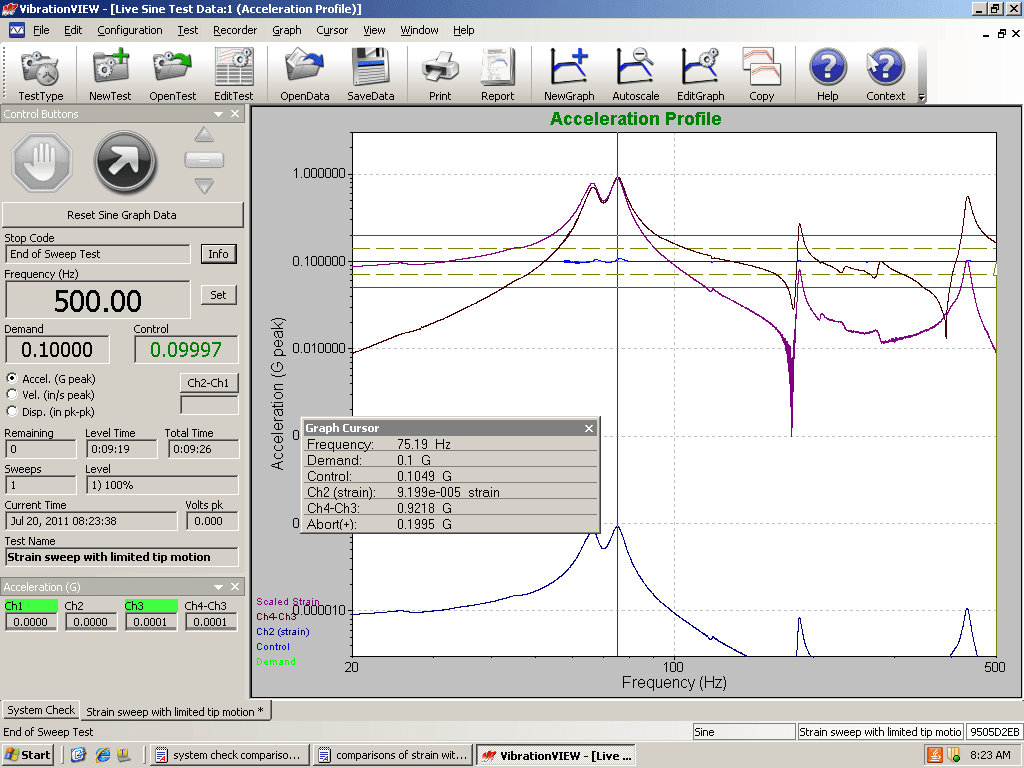
Figure 5. Acceleration vs. Frequency with stress overlay for the beam with end mass.
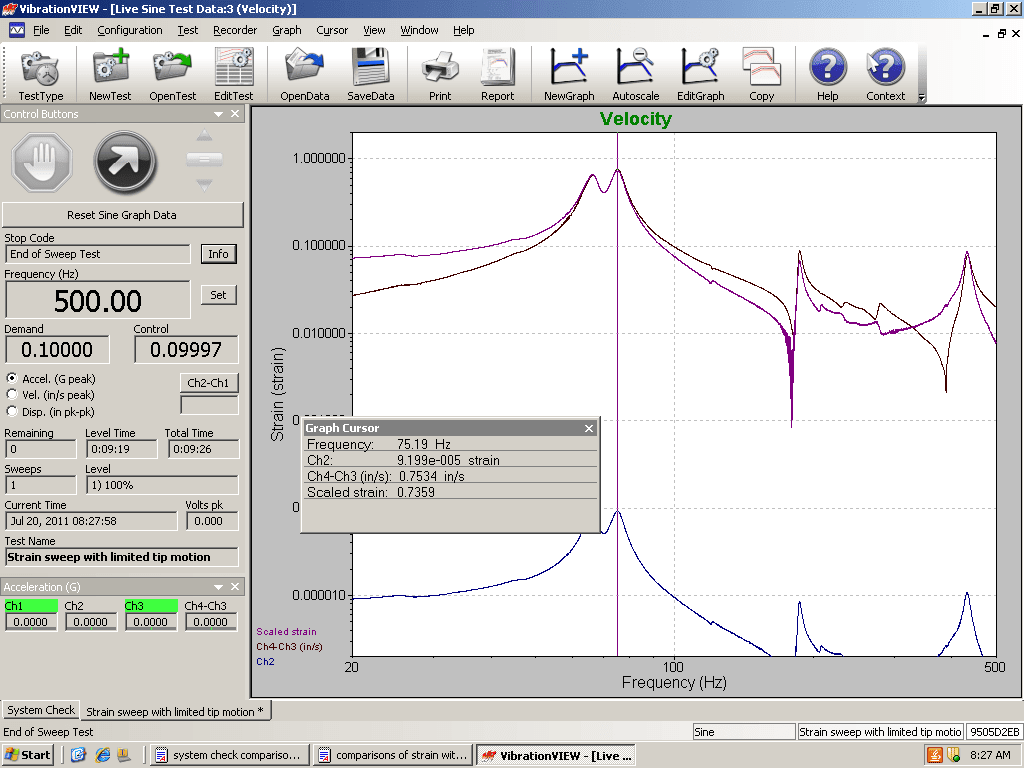
Figure 6. Velocity vs. Frequency with stress overlay for the beam with end mass.
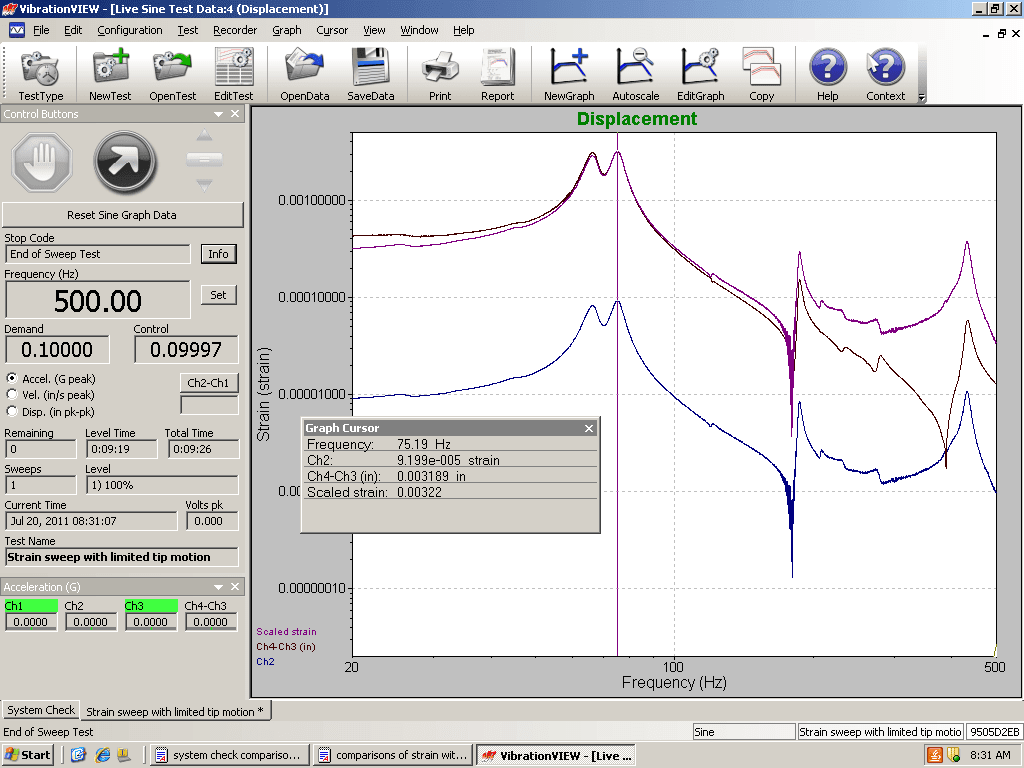
Figure 7. Displacement vs. Frequency with stress overlay for the beam with end mass.
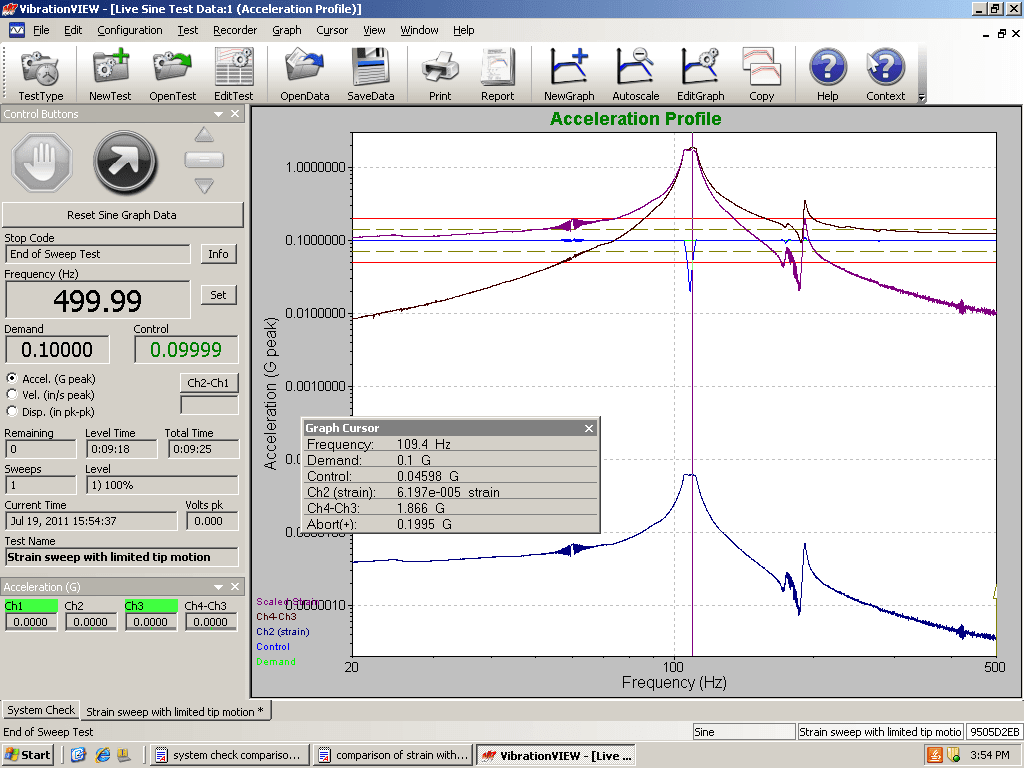
Figure 8. Acceleration vs. Frequency with stress overlay for the beam with heavier end mass.

Figure 9. Velocity vs. Frequency with stress overlay for the beam with heavier end mass.
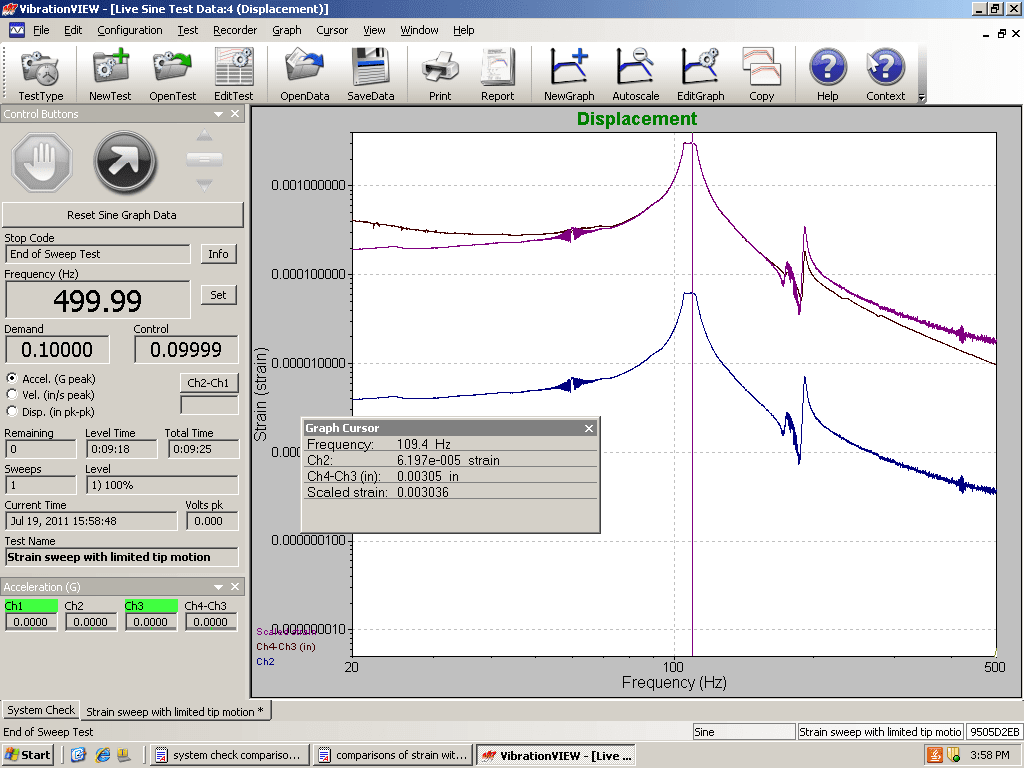
Figure 10. Displacement vs. Frequency with stress overlay for the beam with heavier end mass.
Part B: Varied Masses Approach
Rather than examine the plots of individual tests, it was decided to run a series of tests in which the fundamental resonance of the beam was changed by adding extra mass to the beam. The relative displacement values and the relative velocity values at the fundamental resonance were recorded and plotted for each trial. The plots were then examined for correlations.
The data sets, spreadsheets, and other experimental results are saved on the VRC network at P:Joels Summer 11 filesStrain tests2011.
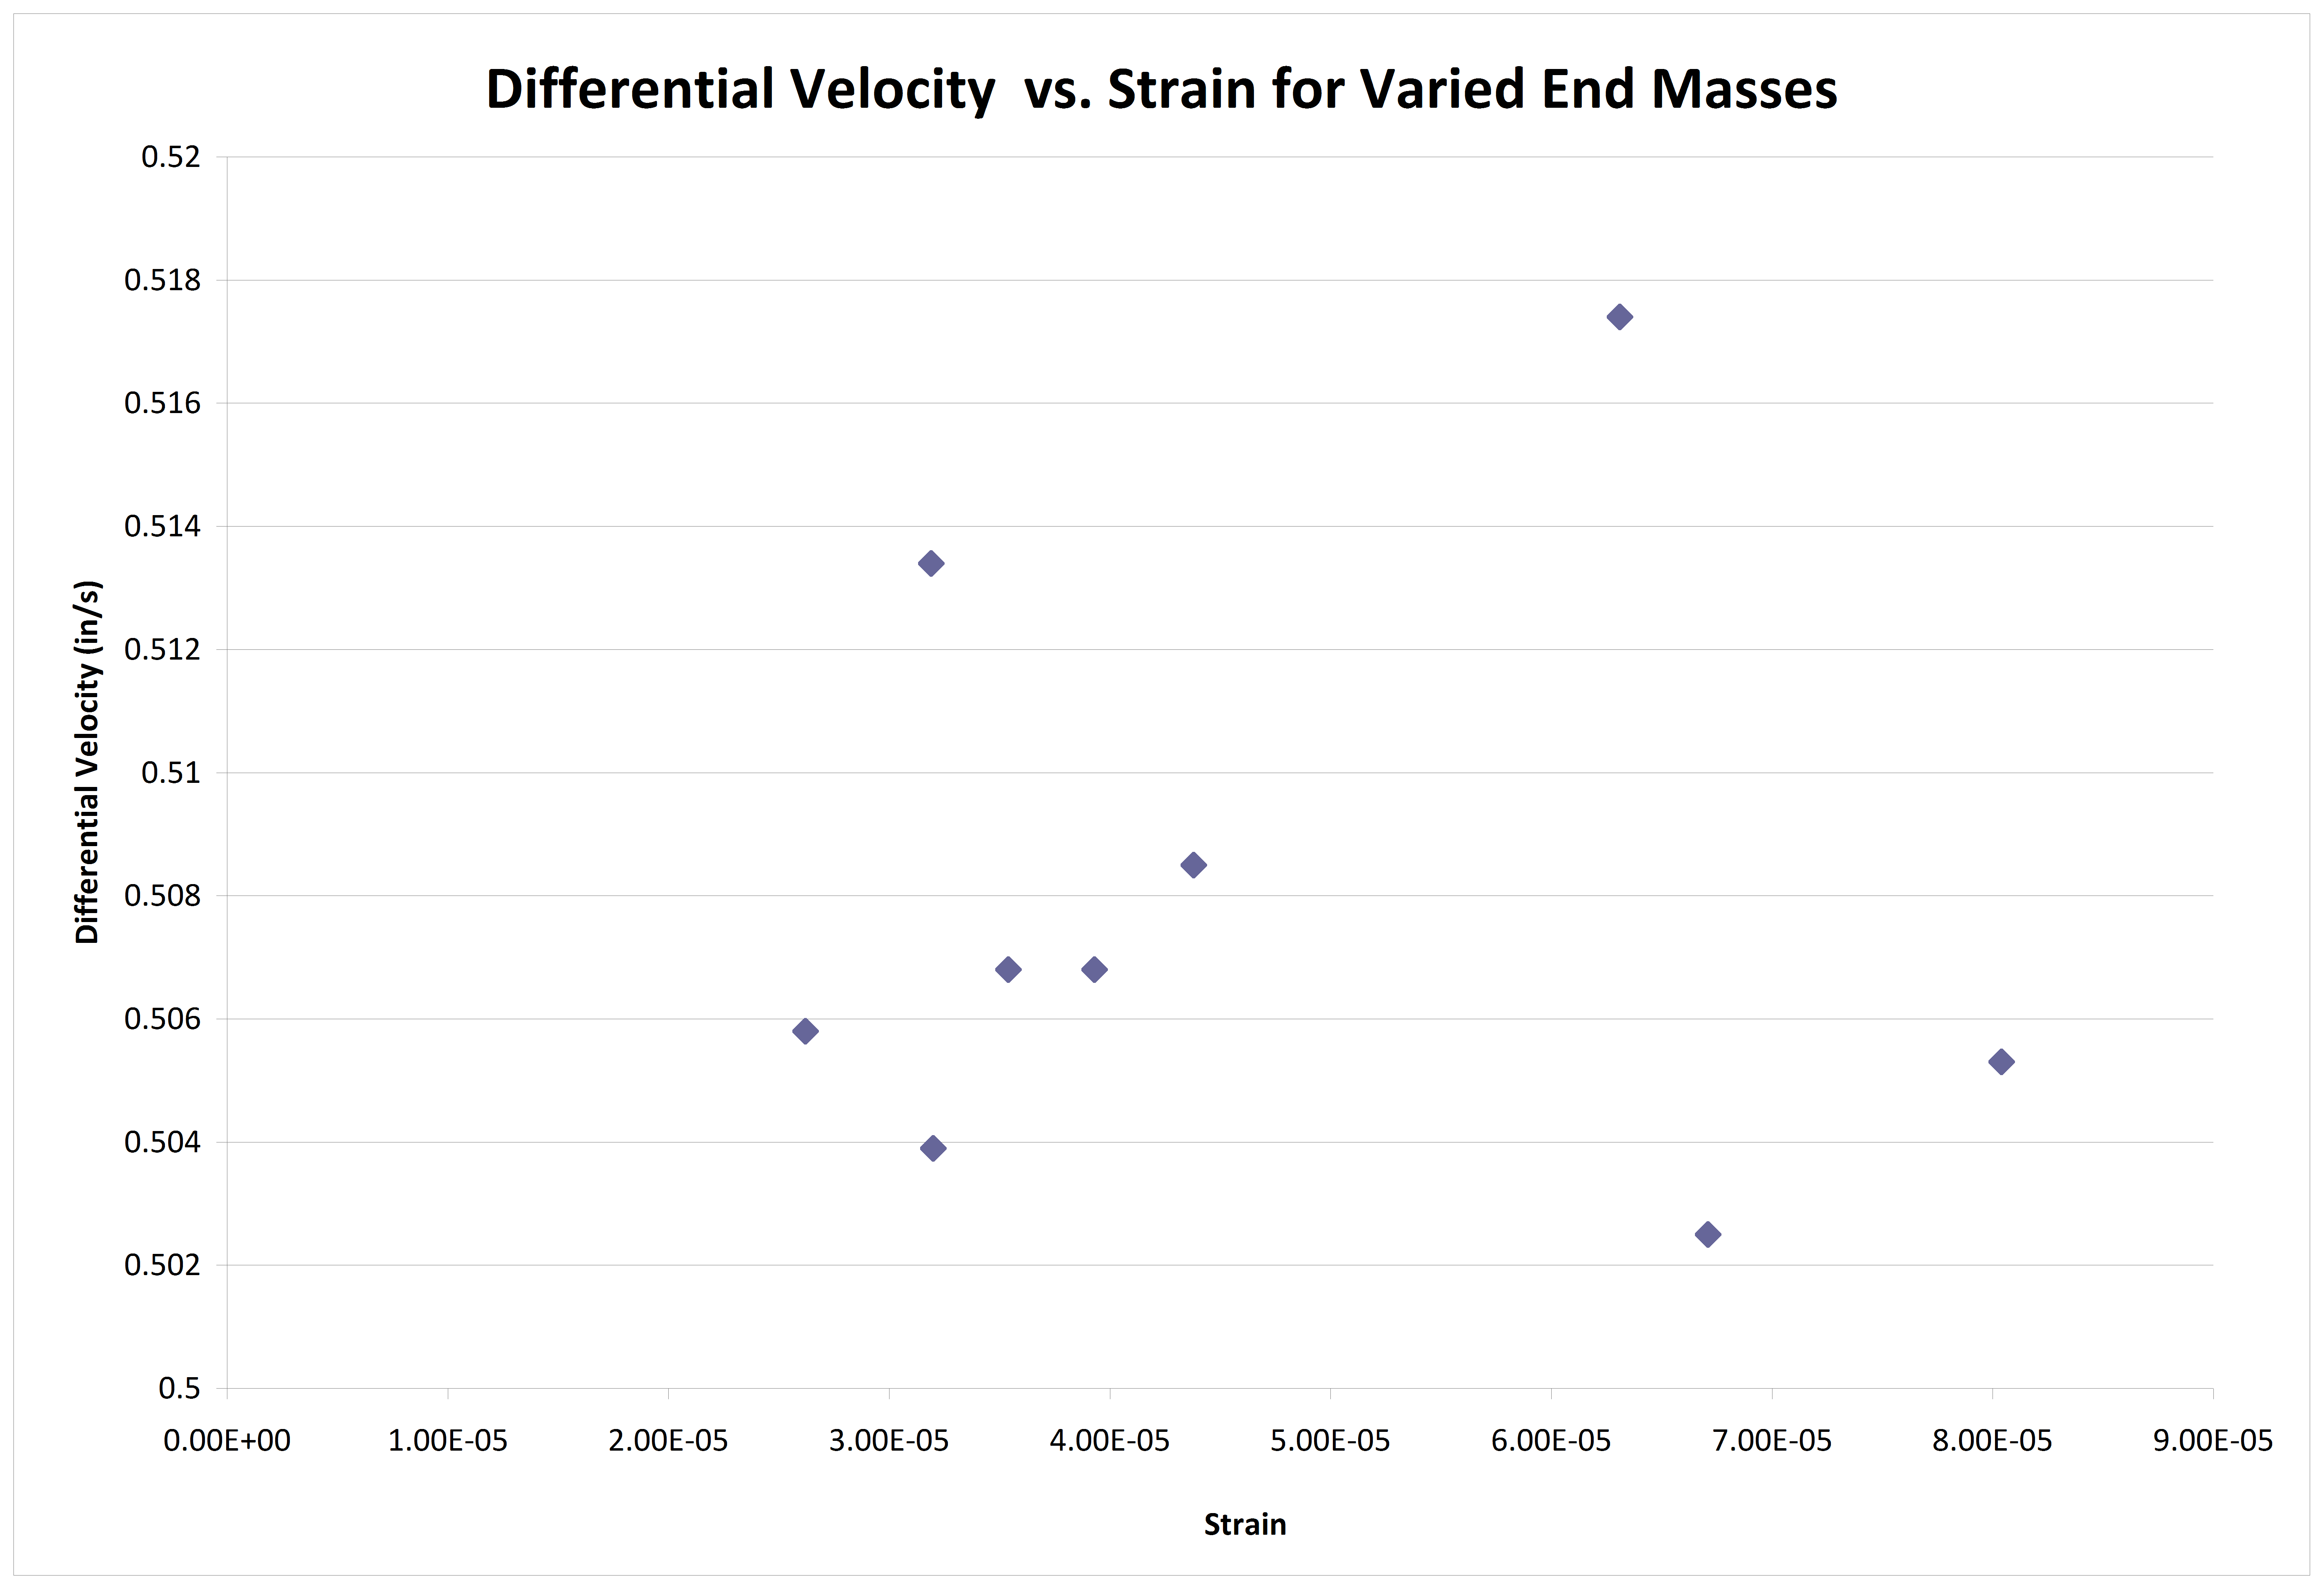
Figure 11. Velocity vs. Strain for trials with varied end mass.
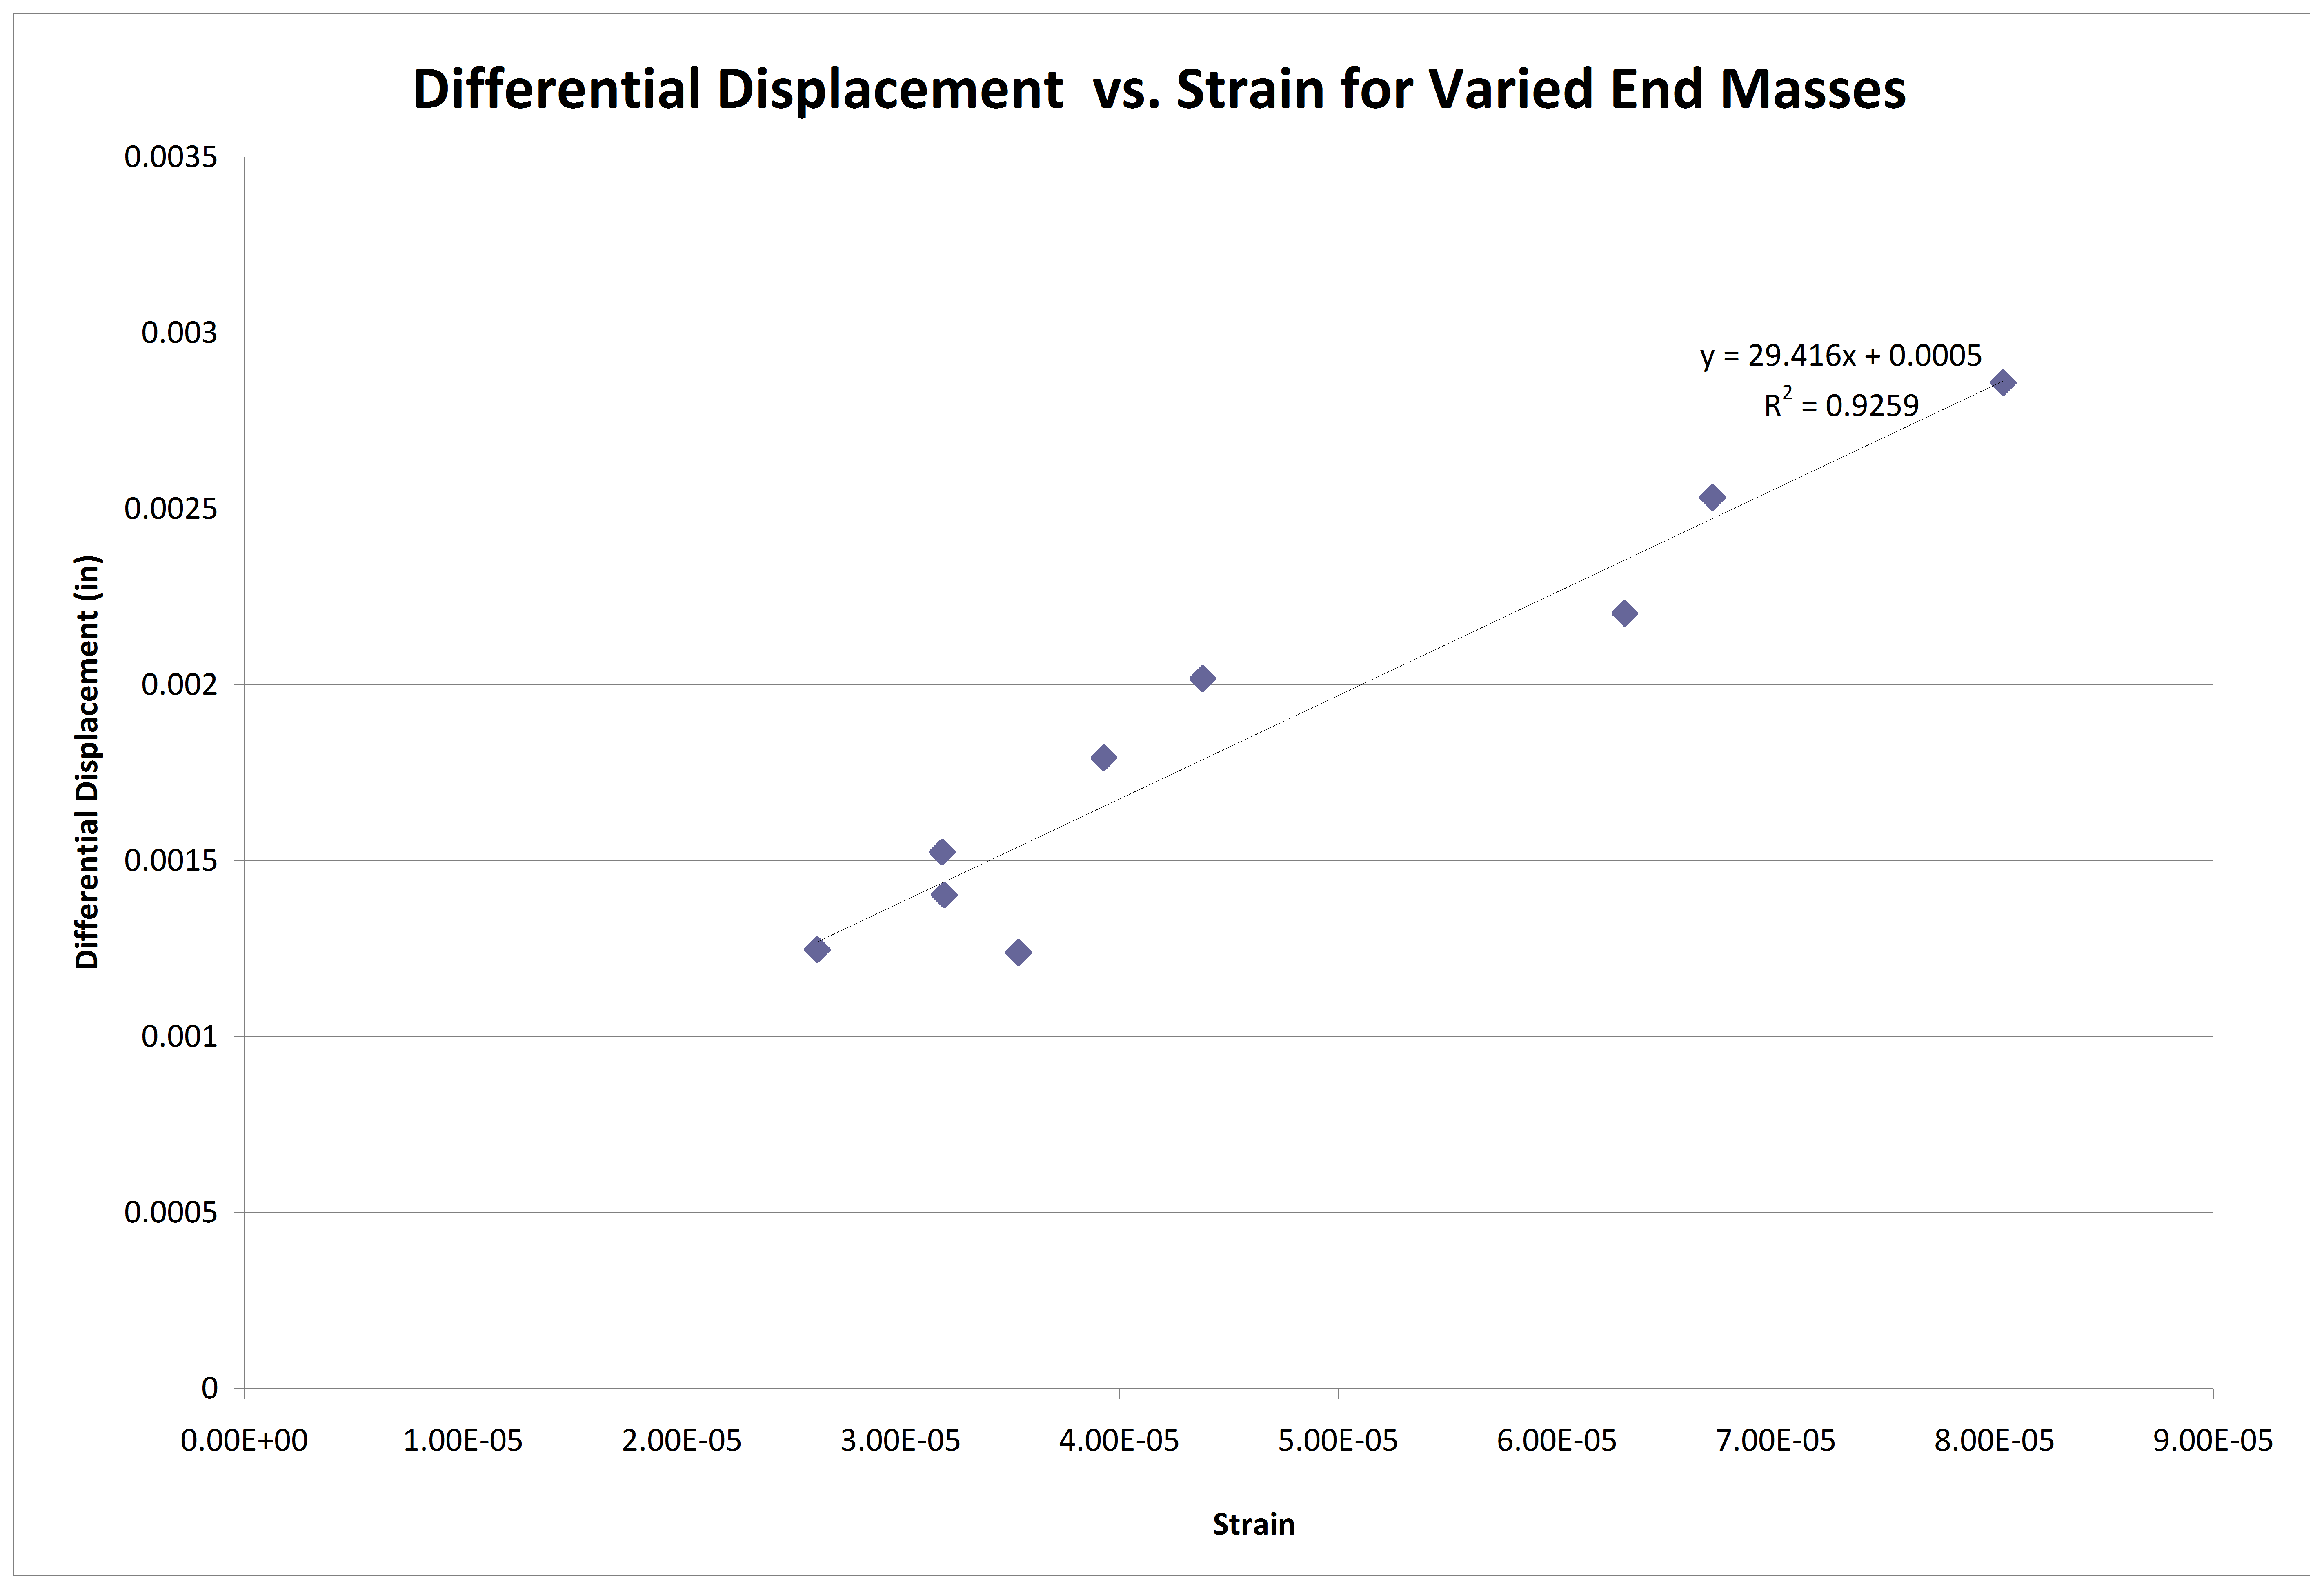
Figure 12. Displacement vs. Strain for trials with varied end mass.
Part C: Varied G Approach
The third test involved changing the G level of the test while maintaining a constant end mass on the beam.
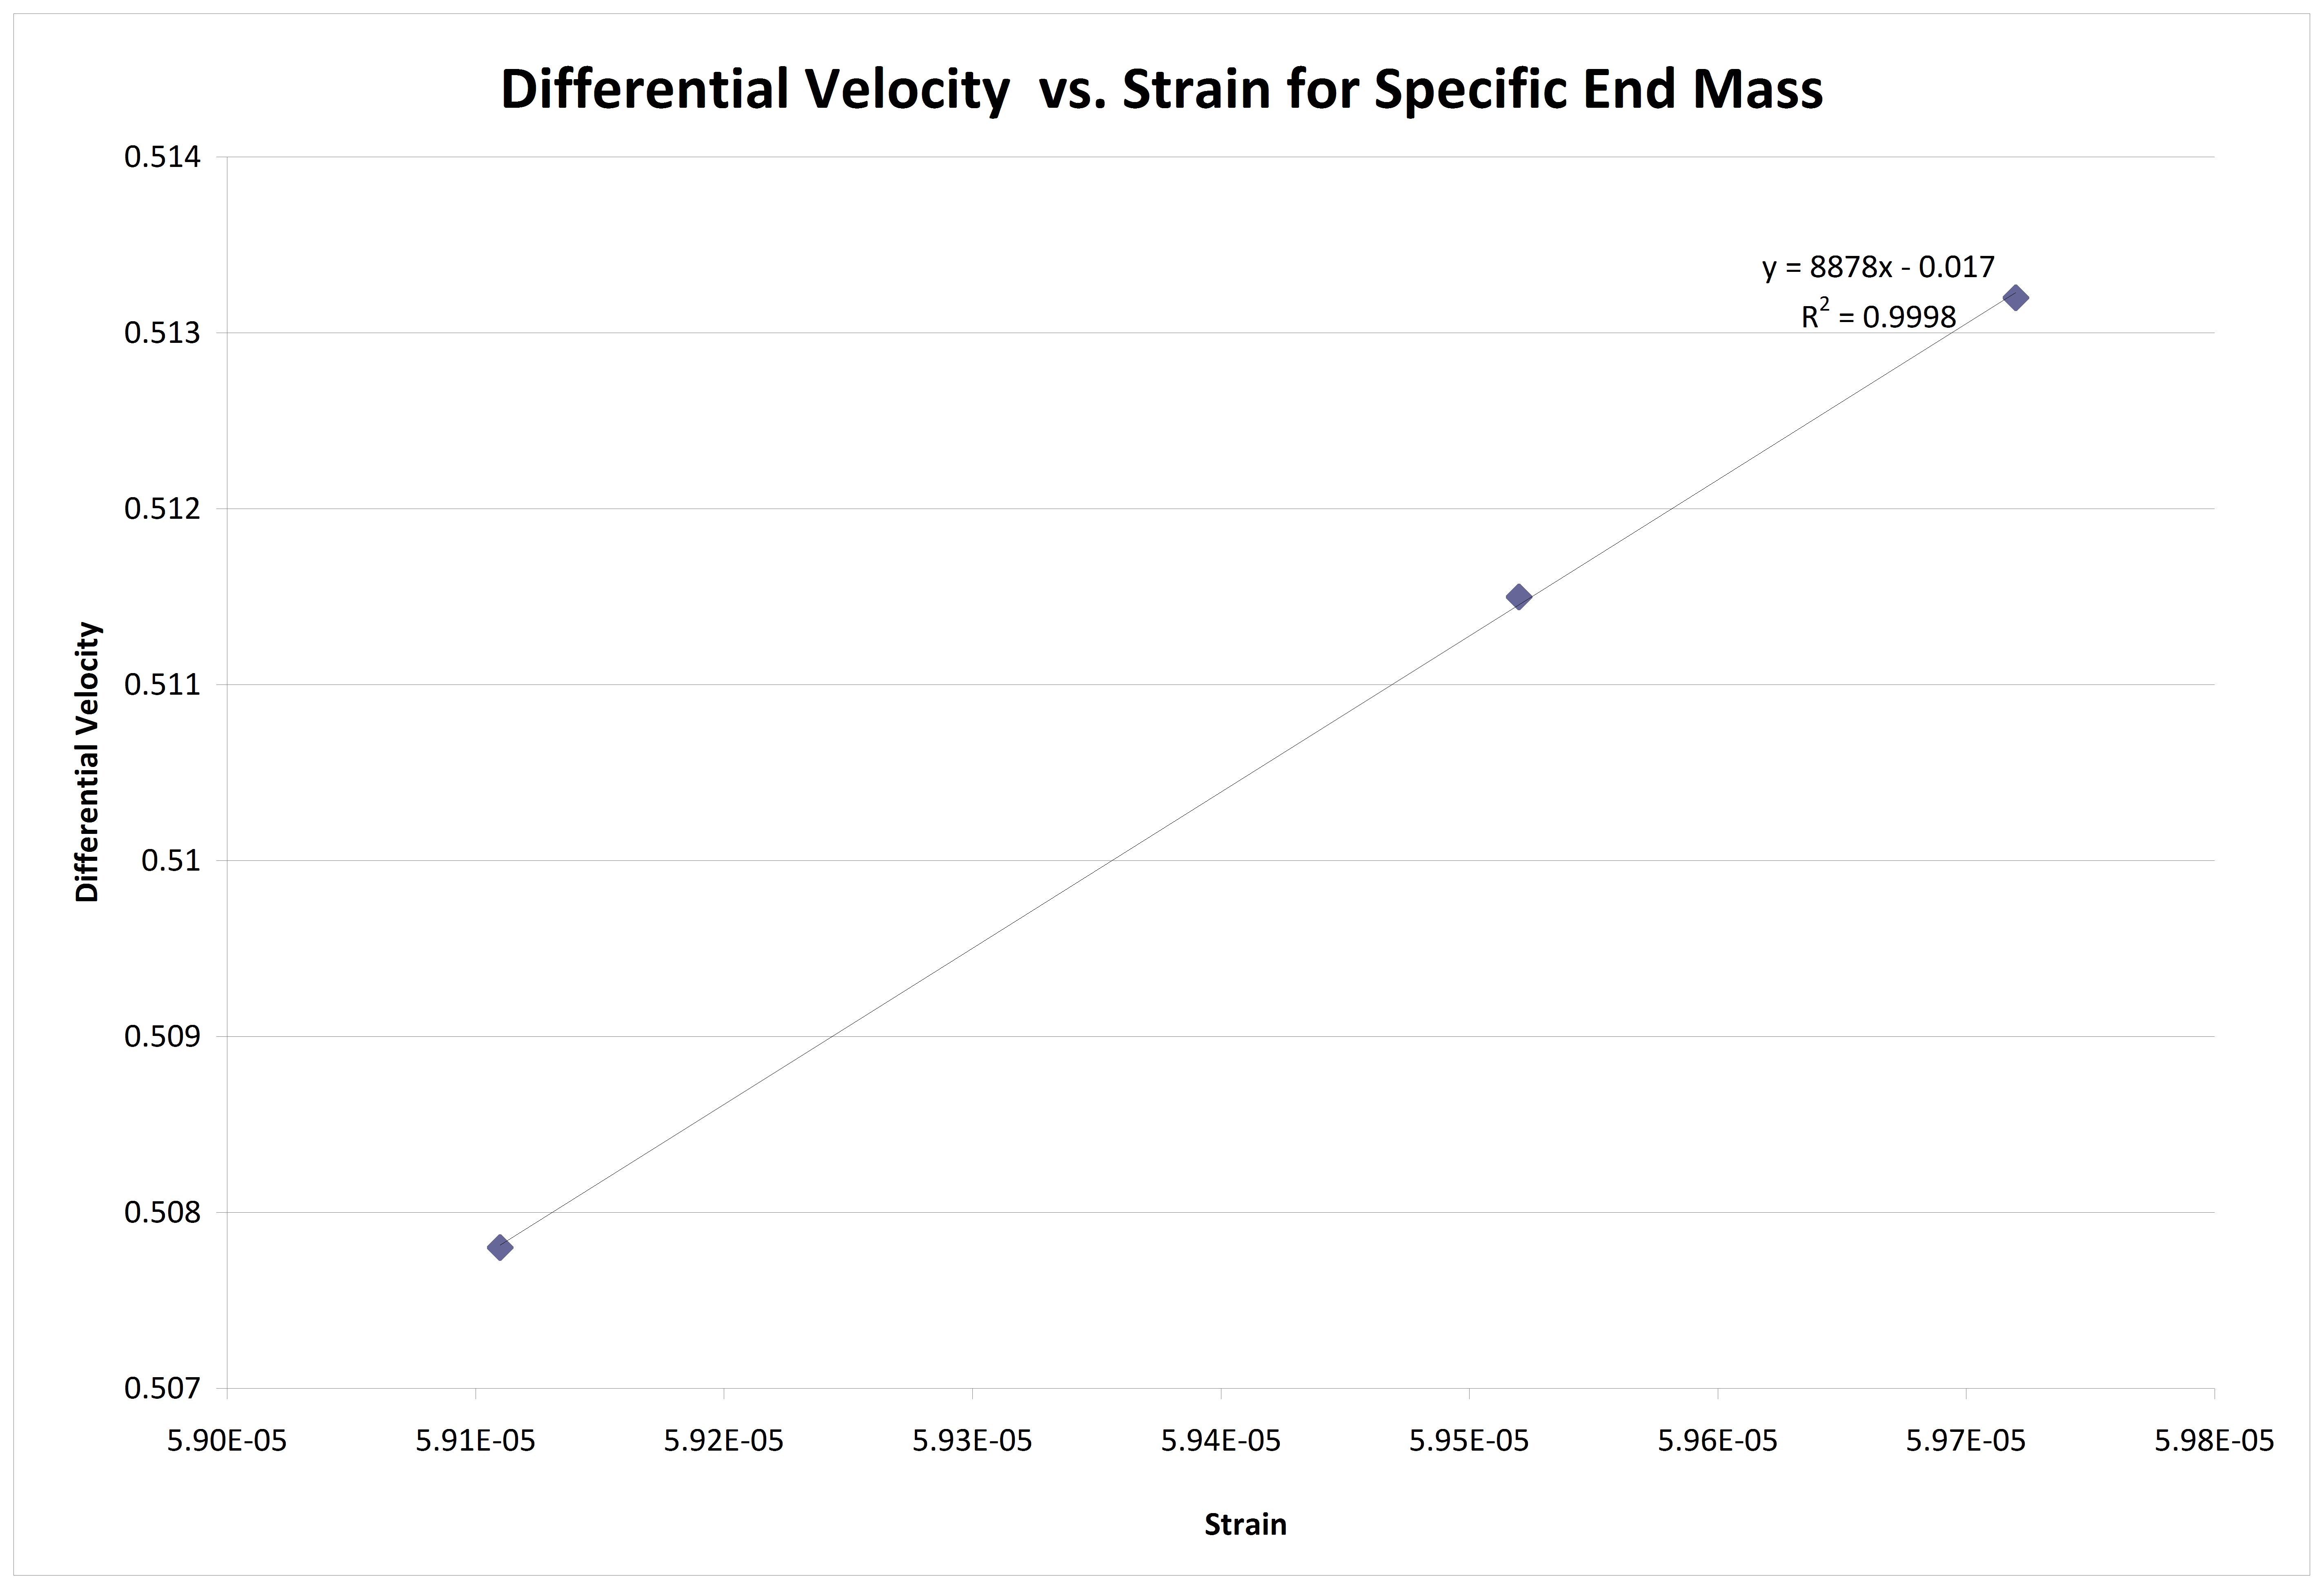
Figure 13. Velocity vs. Strain for varied G with constant end mass.
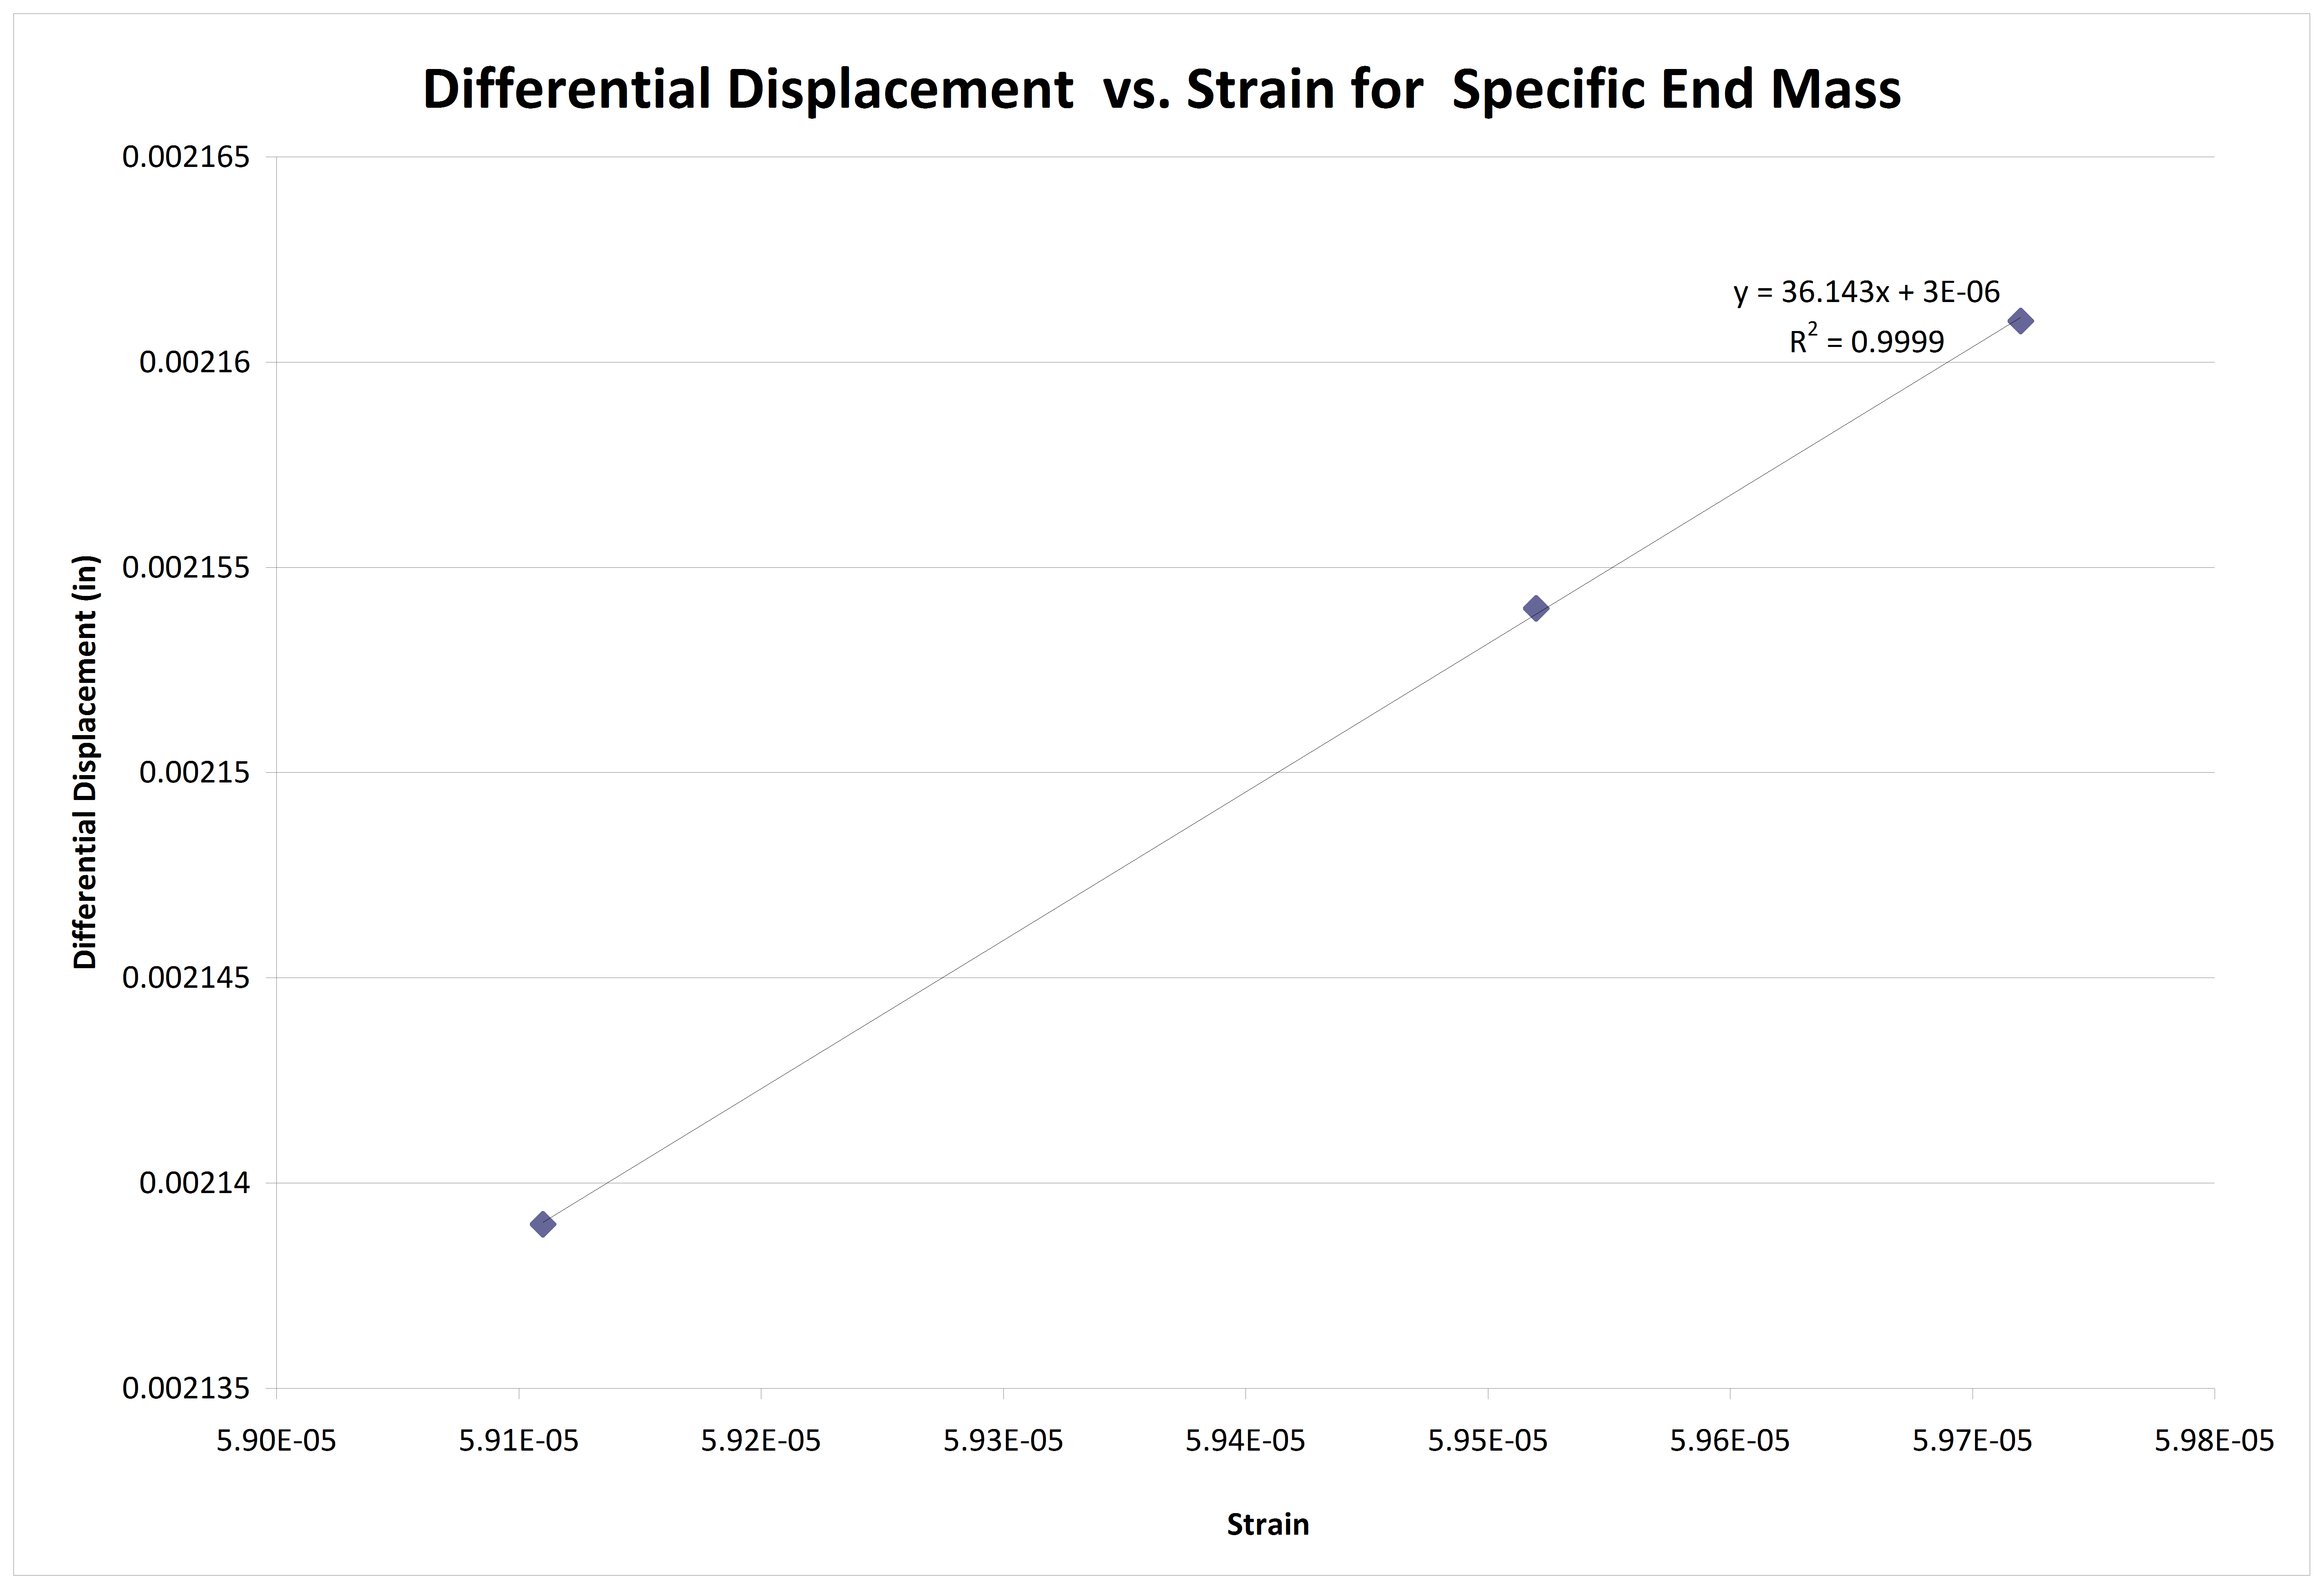
Figure 14. Displacement vs. Strain for varied G with constant end mass.
Conclusion
The study’s results do not show a strong relationship between strain and relative velocity. The best results were produced in the graphical approach. For a single frequency range, the strain curve matches the velocity curve very well, especially at resonances. This is important because most strain is introduced to the product at the resonances. If the velocity matches the strain values at the resonances, then a proportional relationship exists between the strain and the velocity at the frequencies that cause the most damage.
The increased G level also produced seemingly excellent results. However, simply increasing the G level for multiple trials is akin to repeating the same test over and over and getting the same result. The only difference is that when the tests were repeated with increased G level, all the values were scaled up. Consequently, there appears to be a direct correlation between strain and velocity (as there also appears to be for strain and displacement) but this test only shows that if you repeat the test you get the same result.
The “varied mass approach” held the most promise but gave the poorest results. In this approach, the mass at the end of the beam was changed for each trial to produce a different resonant frequency and, hopefully, a proportional velocity/strain relationship. The results, however, did not show any strong relationship between velocity and strain. In fact, a strong relationship between displacement and strain appears to exist. However, after giving some consideration to the procedure, the entire test appears to be invalid for the following reasons.
Problem Areas and Validity issues of “Varied Mass Approach”
Several problem areas were involved in the “varied mass approach” test.
Stress vs. Strain
The theory states that maximum modal velocity is proportional to the maximum stress in the beam (Gaberson; Irvine). Our procedure measured strain. Strain and stress are only proportional (by Young’s modulus) for a small range of strains called the “elastic range”. “As strain is increased, many materials eventually deviate from this linear proportionality, the point of departure being termed the proportional limit. This nonlinearity is usually associated with stress-induced ‘plastic’ flow in the specimen” (Roylance). If some of our data took the beam outside of its “elastic range,” then it would be impossible to find a linear relationship between velocity and strain.
Mass changed dynamics of the beam
To compare the velocity and strain values for multiple data points, we tried to change the resonant frequency of the beam. To do so, we added more mass to the end of the beam. This effectively changed the resonance of the beam. However, it likely changed other features of the beam as well. All the theory is based on a uniform beam. Our beam even had a notch in it to start with and we then added mass to its end – causing it to deviate significantly from the beams used in theory.
Strain measurement point
It was assumed that the maximum strain would be found at the point of the notch. However, it appears that the maximum strain may not necessarily be at that point. It could exist at the mounting point of the beam. This seems quite unlikely, however, since in the 2010 tests the beams all broke at the notch and not at the mounting point. Nevertheless, this is a point worthy of further investigation.
Velocity measurement point
Similarly, we measured the velocity (displacement and acceleration also) at the end of the beam. It was assumed that the end of the beam would experience velocities proportional to those at the notch. The end of the beam was also a convenient place to mount the masses and the accelerometer. However, like the strain measurement point, this may not have been the best location to measure the acceleration, velocity, and displacement.
Summary
Although the theory suggests that maximum modal velocity and maximum stress are proportional, we were unable to produce results that supported this theory by using the current set of tests and procedures.
A new and novel approach will need to be implemented in the future to try to experimentally demonstrate this theory.