This paper originally appeared in Sound & Vibration Magazine, September 2012, pp. 18-19.
Background
Download PDFThe transportation industry historically has used Gaussian random vibration tests to simulate real-world transportation data. However, an examination of real-world transportation data reveals that transportation data is Non-Gaussian in nature. Consequently, transportation test engineers should simulate real-world data using Non-Gaussian random vibration. Non-Gaussian random vibration (kurtosis control) increases the number of large peak accelerations (that arise in field data due, in part, to the pot-holes of transportation) that the Gaussian random vibration tests “average-away” with their averaging techniques. By implementing kurtosis control, the transportation industry would be well on its way to making their laboratory simulation tests much more realistic. And this, in turn, would result in better packaging – putting more products in the customer’s hand without damage.
Introduction
Millions of packages are transported along American roads daily.1 Whether the package contains highly sensitive electronics or that special birthday present for your 9-year-old son, the safety of the contents is of great importance. Packages come in all sizes and shapes and must be transported through a large range of temperatures and vibrating environments. To ensure the safe arrival of goods from one neighborhood to another and from country to country, the packaging industry has had to develop many packaging standards and shipment tests. And although the packaging industry has benefited greatly from implementing vibration industry tests, the vibration tests could be improved. Present-day random vibration testing utilizes a technique that averages out the large acceleration peaks that are found on the field and are the accelerations that cause the damage to products. Today, a more realistic random vibration test is available to the packaging industry. The newest innovation in random vibration testing is Kurtosion® – a technique that raises random vibration testing to a much more realistic level.
Problem with Present-day Random Testing
Present-day methods of random testing assume a Gaussian (Kurtosis = 3) mode of distribution of random data. This means that the vibration test controller software takes all the peak acceleration values from a data set and finds its average. It averages the data in such a way that the highest peaks produced by this process will be within +/- 3 sigma from the average. (See Figure 1.1 to see Gaussian distribution of accelerations in a sample kurtosis test).
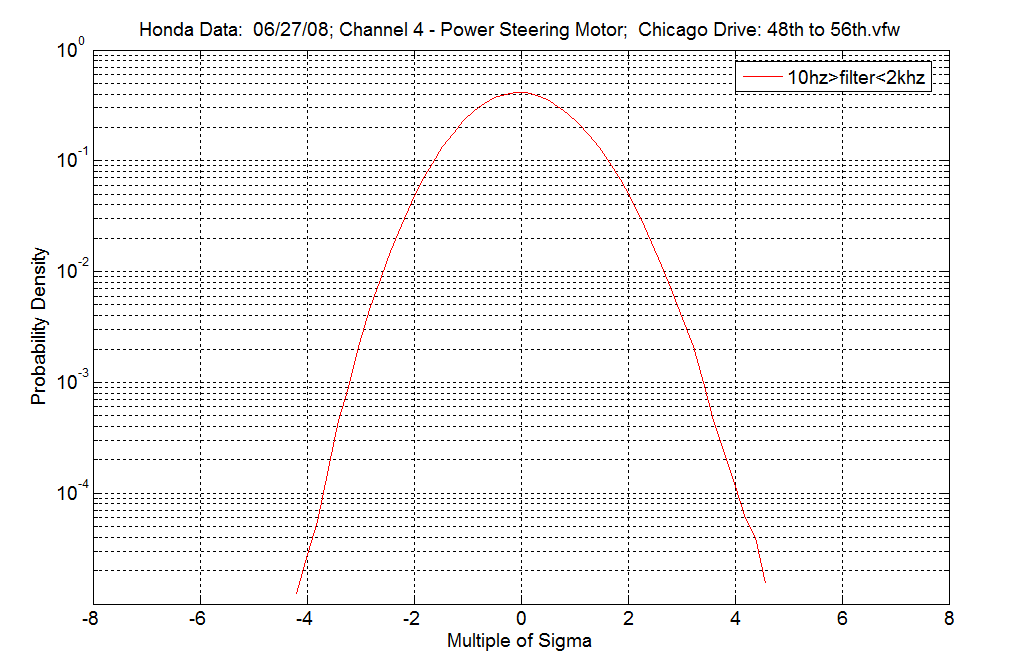
Figure 1.1 – Probability Density Function (PDF) for Road Data with Gaussian (k=3) Distribution
This process, consequently, removes (by its averaging process) the very large peak accelerations that occurred in the field-data. Thus, this kind of random test, although it contains the same amount of energy as the original field-data, it does not contain the same level of peak accelerations. This Gaussian method of random vibration is not realistic. It under-tests the product because it lacks the very large accelerations that are responsible for damaging the product. Therefore, in the context of the transportation industry, these Gaussian random tests will fail to identify the large peak accelerations that a product will encounter on the road, rail, or air. The packaging industry, therefore, will be prone to under-package their products.
A Solution for Random Testing Problem
A better method of testing products than using the Gaussian mode of distribution of data would be to adjust the distribution of data to more closely fit the field replicated data. Such a method would require an adjustment of kurtosis. Kurtosis is a statistical term used to describe the relative distribution of data. In simplified terms, kurtosis describes how many of the large peak accelerations are kept in the data set. If you want a greater number of peak accelerations in your test, then you need to increase the kurtosis level. This kurtosis parameter includes the higher peak accelerations without increasing the overall energy of the test.
Graphically speaking, kurtosis is a measurement of the size of the distribution’s “tails”. A set of data with a high kurtosis value will produce a distribution curve with higher peak values at the mean and longer “tails” or, in other words, more data points at the extreme values from the mean. Compare the distributions shown below for a kurtosis value of 5.7 with the traditional Gaussian distribution – kurtosis value of 3 (Figure 1.2). Note how the distributions with the higher kurtosis values have more data points in the “tails” – data points that are far from the mean.
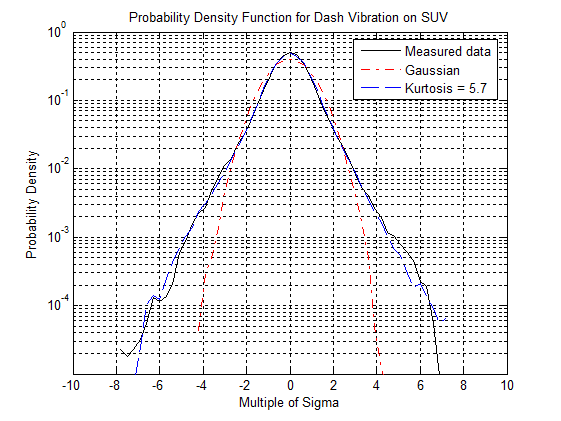
Figure 1.2: Probability Density Function for data gathered from interior automobile vibrations in a road test conducted by Vibration Research Corporation. Note how the higher kurtosis value contains more high peak accelerations (+/- 6 sigma) than Gaussian (+/- 3 sigma). Also, note how Kurtosis Control distribution more closely resembles the real-life measured data than does the Gaussian distribution.
Rather than distributing random data according to Gaussian distribution, which is so commonplace in the vibration testing industry today, it would be far preferable for the transportation industry to distribute the random data at a higher kurtosis level. This is preferable because, as has been shown in recently published studies, real-life data does not “fit” the Gaussian distribution, but fits a higher kurtosis level.2 Also see Figure 1.2 to see how a higher kurtosis distribution more closely resembles actual measured data than the Gaussian distribution.
A newly patented kurtosis control method for random vibration testing, as developed by Vibration Research Corporation, will permit the adjustment of the kurtosis levels while maintaining the same testing profile and spectrum attributes. Adjusting the kurtosis level will allow the product to be tested nearer to real-life scenarios.3,4 Kurtosion® will make testing by the transportation industry much more realistic.
The SRS Plot
What tools does the test engineer have to determine if the laboratory test satisfactorily matches the real-world data? Test engineers examine a test’s PSD. The PSD reveals the overall “energy” of the vibration test. When making a laboratory test, the test engineer must be sure that the PSD of the laboratory test matches identically with the PSD of the field-data (see how the PSD of road data is matched by the PSD of a laboratory test in Figure 2.1). However, two tests that are identical in terms of PSD, may have completely different kurtosis values. Ideally, the test engineer should be sure that the overall energy of the tests and the kurtosis of the tests match. While the PSD plot shows the overall “energy” of a vibration test, an SRS plot shows the “peak accelerations” that occur during a test and at what frequencies they occur. The SRS plot essentially displays a representation of the kurtosis of the test. Since the test engineer wants the kurtosis of both the field data and the laboratory test to match, the test engineer should make sure that the SRS plots also match (see Figure 2.1 to see how tests with the same PSD can have different SRS plots because the tests can have different kurtosis values).
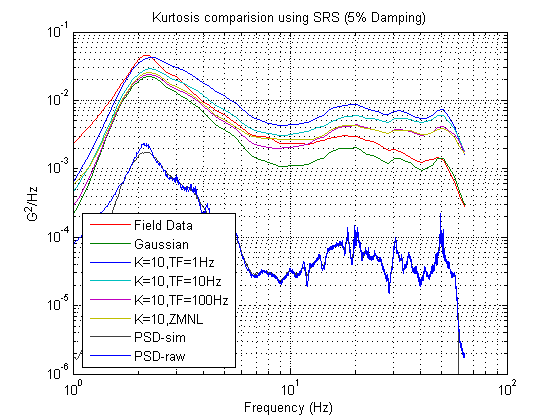
Figure 2.1: SRS plot of Transportation Data LB4 with random vibration tests with varying kurtosis values and varied Transition Frequency. Note how the SRS plot is a handy way to see how an increasing kurtosis value brings higher accelerations across the frequency spectrum. Note also how the plot of the PSD is identical for both the original data and the laboratory test data, indicating the tests are identical in terms of the “energy” of the test.
Demonstration Data
To illustrate the point that the packaging industry would benefit from using Kurtosion®, a transportation data set representing data from a truck-rail-truck run from California to Chicago (recorded on an IST EDR-4 recorder and obtained from Steve Smithson of Smithson and Associates – Edina, MN) was analyzed. The transportation data was played back in the laboratory, varying the kurtosis and Transition Frequency parameters, and graphing the SRS plots for each test.
The data was examined to determine its peak acceleration levels. The PSD and SRS of the data were analyzed. Then the data was replicated in the laboratory with VibrationVIEW software. The data set was played back in “Random” and the Kurtosis control method was applied. Various kurtosis values were used and compared. The kurtosis control method keeps the overall PSD (the amount of energy of the test) the same regardless of the kurtosis setting. The SRS plots will differ for each trial because the tests with higher kurtosis settings will have higher peak accelerations.
Consider the results of this demonstration as shown in Figure 3.1. Note that the PSD of the original data and the PSD of the replicated data are the same for all tests – indicating that the tests are identical in terms of their total energy. Note also that the SRS plot nicely illustrates that as the kurtosis increases for each of the tests, the peak acceleration levels also increase across the frequency spectrum. This shows how a test engineer could manipulate the peak acceleration levels by adjusting the kurtosis level. Finally, note that the Gaussian distribution (k=3) “under-tests” the product, evidenced by the fact that the Gaussian’s SRS plot is lower than the SRS plot of the original field-data. This further substantiates that field-data is not Gaussian in nature and that the transportation industry would better replicate field data by using Kurtosion®, which allows the adjustment of the laboratory’s kurtosis, rather than assuming an unrealistic Gaussian distribution.
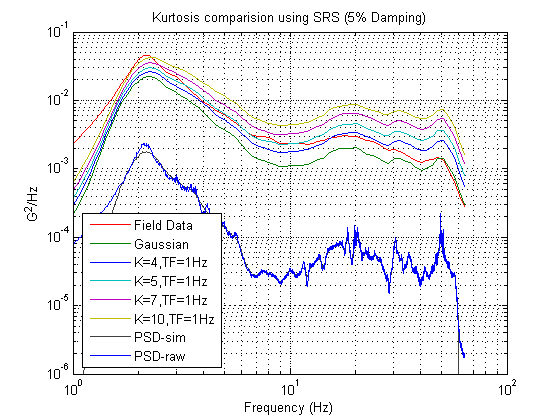
Figure 3.1: SRS plot of Field Data and various Kurtosis values at Transition Frequency = 1 Hz. Note how the higher kurtosis values also have higher SRS plots and how the Gaussian (k=3) SRS plot is considerably below the SRS plot of the Field Data.
Conclusion
In a “global society” the transportation industry will be called upon more than ever to move goods from country to country and from home to home. The vibration industry has known for some time now that field data is not always Gaussian in nature as has been assumed for many years. In fact, the data sets from Steve Smithson that are examined in this paper clearly illustrate that transportation data is certainly not Gaussian either. With Vibration Research Corporation’s newly patented Kurtosion®, the transportation industry needs no longer to assume Gaussian vibration when replicating field data. Kurtosion® will allow the test engineer to create a random vibration test with the same kurtosis level as the field data while maintaining the same energy (PSD) and other attributes of the test. This will provide much more realistic tests, ensuring that the product is tested more closely to the environment it will experience on the road, on the rail, or in the air. Using Kurtosion®, the transportation industry can bring more precious packages safely to their customers. That’s sure to make millions of faces smile every day.
Authors: John Van Baren, President & Philip Van Baren, VP/Engineering, Vibration Research
Published: Sound & Vibration Magazine, September 2012 pp 18-19.