This paper originally appeared in the Journal of the Engineering Integrity Society, Volume 47, September 2019, pp. 10-13.
Abstract
Shock Response Spectra (SRS) testing uses a synthesized pulse to drive a shaker, simulating a transient event. Originally developed to replicate Seismic shocks, the SRS approach is also widely used for defense and aerospace applications.
Test engineers can select from a variety of synthetic waveform methods to create an SRS pulse, with the best choice depending on the application. For example, the Burst Random and Enveloped Burst Random methods produce long-duration stationary random waveforms that work well in earthquake simulation tests. However, often there is no synthetic waveform that closely matches a real-world transient event; engineers need a better, more realistic way to create an SRS test.
This paper focuses on a unique approach, where the recorded field environment can be modified to meet or exceed a specified SRS. This provides a time waveform similar to the original field environment and, more importantly, it has the same frequency response function as the original field environment.
The paper will first introduce the basic concepts of SRS, then step through the details involved in using the new method with currently available software tools. Topics include creating enveloped data from data recordings and then generating an SRS test based on the enveloped data.
The final section of the paper will evaluate an enveloped environment SRS waveform by comparing it with various standard synthetic waveforms. The visual evidence makes a compelling case for the new approach.
2. Introduction
Background
Analyzing a shock pulse in the frequency domain provides much more insight than simply looking at the same pulse in the time domain. A Fast Fourier Transform (FFT) can make the conversion from time to frequency domain data, providing both the magnitude of the shock pulse accelerations and the phase information about the shock pulses at each frequency; from an FFT it is possible to recreate the original shock pulse.
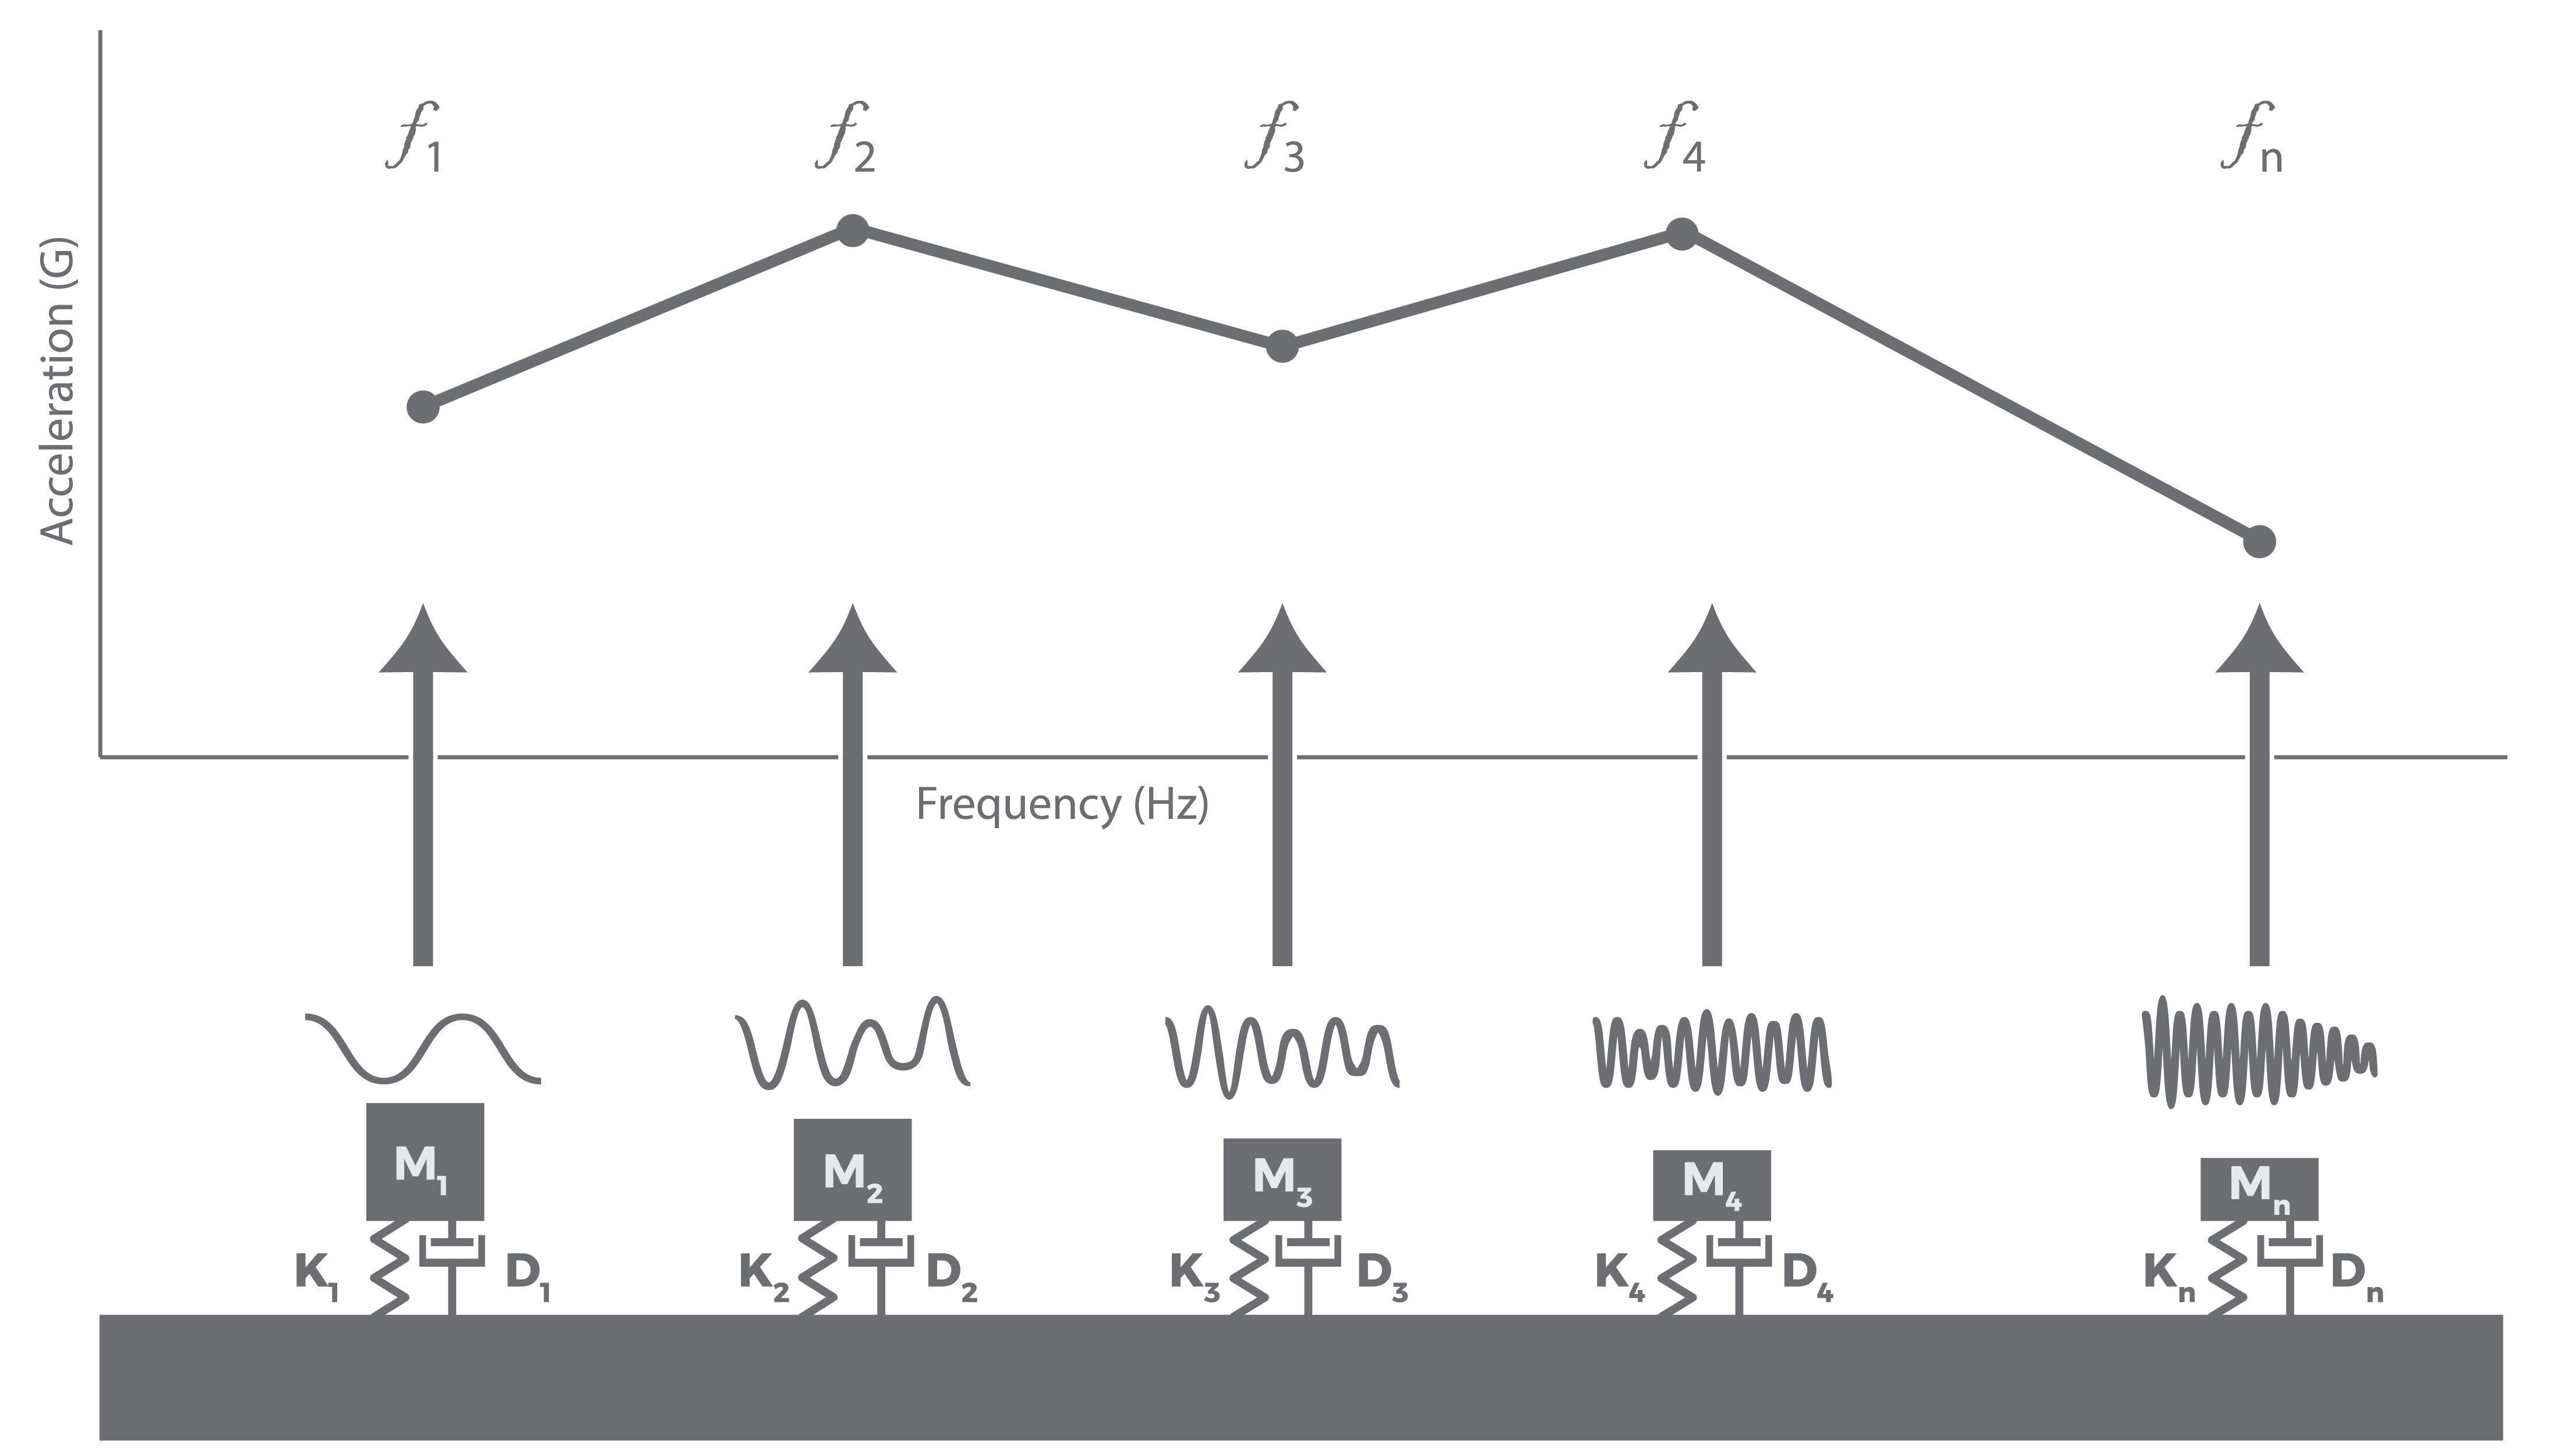
Figure 1. A basic model of the SRS.
The FFT calculation is an excellent tool for analyzing a continuous, repetitive waveform; it produces a PSD which displays an average acceleration for each frequency bin in the waveform. However, an FFT is not very useful in mechanical shock studies. Test engineers are interested in the maximum shock acceleration at each frequency bin rather than the average. This discrepancy leads test engineers to study mechanical shock using a Shock Response Spectra (SRS) approach.
An SRS models response channels using a theoretical series of single degree of freedom (SDOF) mass-damper-spring oscillators. The natural frequency of each SDOF oscillator defines the horizontal axis of a plot and a computed response for each oscillator is plotted on the vertical axis. This computed response is the absolute maximum acceleration of the SDOF oscillator to the pulse, referred to as the maximax, not the average acceleration.
The SRS calculation does not provide phase data, so it cannot be used to replicate the original shock pulse. Nor is the maximum acceleration value of the SRS the actual maximum acceleration of the original shock pulse. But despite not providing a replica of the original shock data, an SRS does provide highly valuable information to the test engineer about the maximum dynamic load as a function of frequency for a particular test.
Examples of Standard Synthetic SRS Waveforms
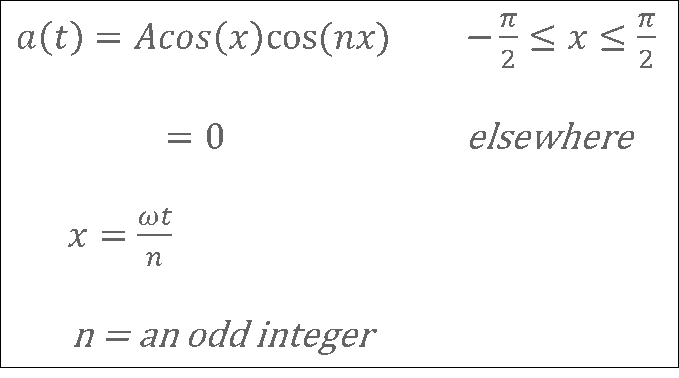
Figure 2: Definition of the WavSyn waveform
When producing an SRS waveform for a test to study mechanical shock, various parameters are used to synthesize a pulse that matches a specified SRS. While a range of waveforms can be created to achieve a required SRS, the testing industry usually relies on a set of standard synthetic waveforms; each of these waveforms is based on a specific set of equations and uses a unique set of calculations to produce an SRS.
Selecting the appropriate synthetic waveform type depends on the application. For example, the WavSyn method produces short duration, high-frequency waveforms appropriate for pyro shock tests, and the Burst Random or Enveloped Burst Random methods produce long-duration stationary random waveforms appropriate for earthquake tests.
Below are brief descriptions of the standard synthetic waveforms supported by Vibration Research’s VibrationVIEW software:
| Linear Chirp | A frequency sweep with the frequency changing at a fixed Hz/second rate; it is useful for testing across small frequency ranges.
|
| Exponential Chirp | A frequency sweep with the frequency changing at a fixed octaves/second rate. This type of sweep is good for sweeps over a wide frequency range, where the start and end frequencies are a multiple of 10 or greater apart.
|
| WavSyn | A superposition of multiple sine beat waveforms, with one sine beat for each frequency in the SRS spectrum. WavSyn synthesis can be Centered, Aligned Left, Sequential, or Alternating. Centered alignment builds the sine beat waveforms from the center time of the waveform. Aligned Left builds the waveform from the left. Sequential builds the waveform from the left with sine beats starting with the highest frequency, which optimizes for required peak acceleration. Alternating builds the waveform from the left starting with the highest frequency and alternates the polarity of the sine beats, which optimizes for required displacement. The WavSyn method produces appropriate short duration, high-frequency waveforms that are well-suited for pyro shock type tests.
|
| Burst Random | A Gaussian Random waveform with a smooth ramp up to level, then constant level, and ending with a smooth ramp back to zero. This type of waveform is well suited for long duration (20 to 30 seconds) earthquake simulations.
|
| Linear Chirp on Burst Random | The superposition of both the Linear Chirp waveform and the Burst Random waveform. The chirp (a fast sine sweep) is useful for achieving high peaks over a narrow frequency range, while the Burst Random is useful for covering a broad frequency range.
|
| Exponential Chirp on Burst Random | The superposition of both the Exponential Chirp waveform and the Burst Random waveform.
|
| Enveloped Burst Random | A Gaussian Random waveform, enveloped using a ramp up, then an exponential decay in amplitude levels. This generates a waveform that more closely resembles a true earthquake event.
|
| Damped Sine Waves | The superposition of multiple sine waves with an exponentially decaying amplitude (damped oscillation).
|
| Synthetic Waveform Limitations | Unfortunately, there is often no synthetic pulse with a frequency response that matches well to a specific real-world transient event. To approximate a real event, the synthetic waveform must test the DUT across the same range of frequencies found in the real-world waveform. A synthesized waveform test that misses either low frequency or high-frequency vibrations will not result in a truly realistic test, while a waveform with excessive energy in a given frequency range will create an over-testing problem. |
3. Using Field-recorded Data
There is a unique approach, where the recorded field environment is modified to meet or exceed a specified SRS. This provides a time waveform similar to the original field environment and, more importantly, its frequency response function closely matches the original field environment. The following sections describe the field data approach in more detail.
Generating an Enveloped Set of Real-world Recordings
A real-world data set is representative of only a single unique event; using this one event as the basis for creating a synthesized SRS waveform gives an incomplete description of shock vibrations that may occur in a particular setting. A different approach is to use multiple real-world data sets and incorporate them into one representative waveform.
For transient events, the proper way to combine multiple real-world data sets is not to find their average accelerations, but to find the maximum value at each frequency. This ‘max enveloping’ technique produces an SRS curve using the maximum acceleration value from a group of real-world data sets for each frequency.
The following steps start the process of producing an enveloped SRS using the VibrationVIEW and Microsoft Excel® software tools:
| Load recordings: Take several real-world recordings of the same event and then individually load the recordings into VibrationVIEW. The data shown in Figures 2-4 were collected from many repetitions of a golf club hitting a ball. |
| Copy the data to Excel®: For each recording loaded into VibrationVIEW, copy the data file, and paste it into a Microsoft Excel® worksheet. |
| Determine the maximum of each recording at each frequency (Envelope): With all the data files of the real-world recordings pasted into Excel®, select the maximum acceleration value for each frequency. This process is called ‘creating an envelope’. |
CREATING A MODIFIED USER WAVEFORM
SRS synthesis parameters are then used to create a pulse matching a specified SRS curve. The following steps produce a user modified waveform that is based on enveloped recording data.
1. Import a real-world data file (as .txt) to begin building a user-defined transient: select one of the real-world recordings and import the recording’s data file as a VibrationVIEW ‘User Defined Transient’ test type.
2. Use the enveloped data to create a maximax breakpoint table: Select and copy the max envelope data file from the Excel® worksheet and paste into the breakpoint table section of the User Defined Transient test profile.
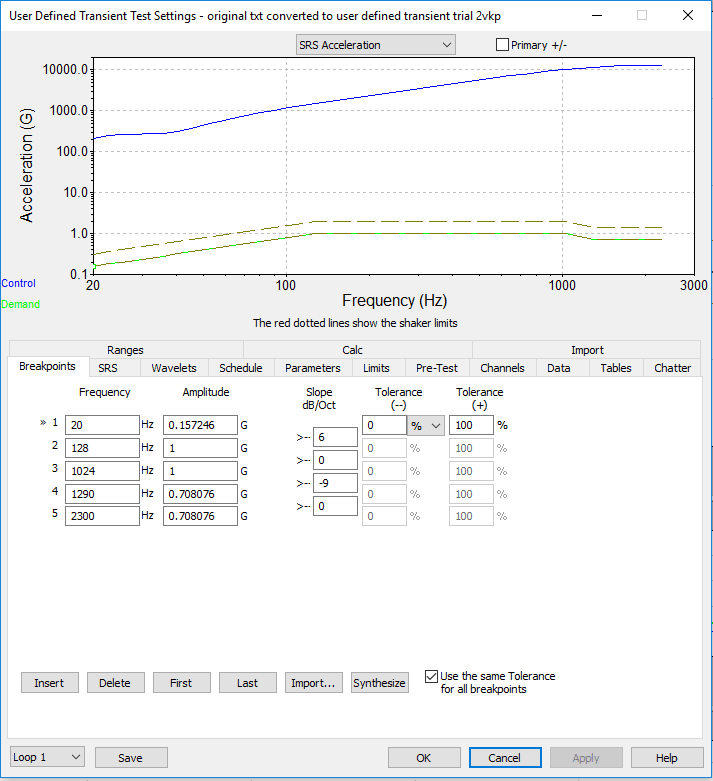
FIGURE 3: USE ENVELOPED DATA TO CREATE A BREAKPOINT TABLE
3. Synthesize a modified user waveform: In the VibrationVIEW User Defined Transient test, under the SRS tab, select ‘From User Waveform’ and click the ‘Synthesize’ button.
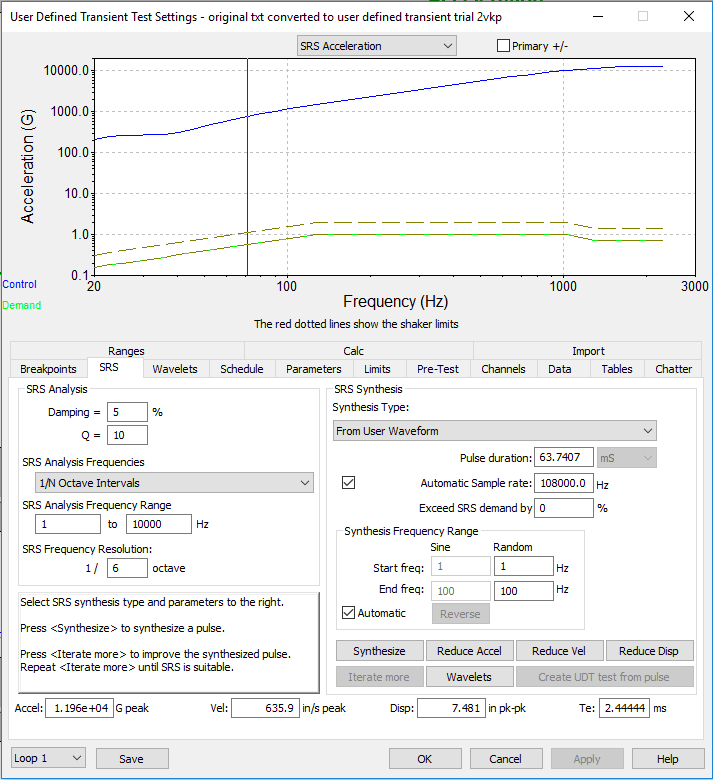
FIGURE 4: SYNTHESIZE THE WAVEFORM
4. Iterate as necessary: Clicking the “Iterate More” button adjusts the wavelets, modifying the SRS to create a waveform that meets or exceeds the SRS maximax breakpoint table values.
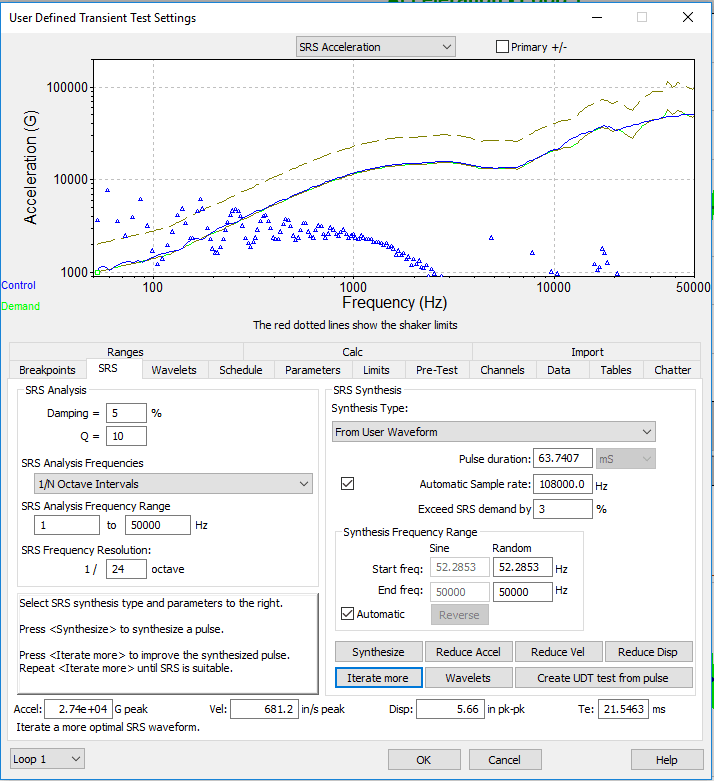
FIGURE 5: ITERATE TO ADJUST WAVELETS
5. Run the test: Save the test profile and run the test. Running the test will generate a data file for this synthesized waveform that can be compared to the real-world data. See Figure 10.
4. Comparing Waveforms
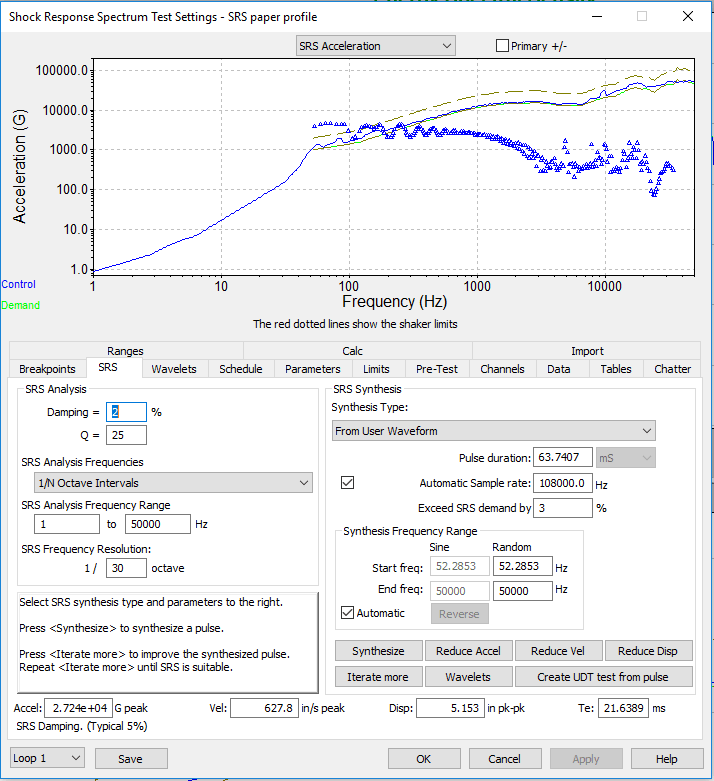
Figure 6: Creating standard synthesized waveforms
Both the modified user waveform developed from the enveloped environment and the standard synthesized waveforms can be evaluated by comparing them with a recorded waveform.
The standard synthesized waveforms shown below were created with the maximax SRS breakpoint table used by the enveloped environment waveform. To implement this in VibrationVIEW, with the breakpoint table loaded, choose a selection under ‘Synthesis Type’ on the SRS tab.
Test engineers should consider three factors when they compare a synthetic waveform with a real-world recording.
Waveform shape
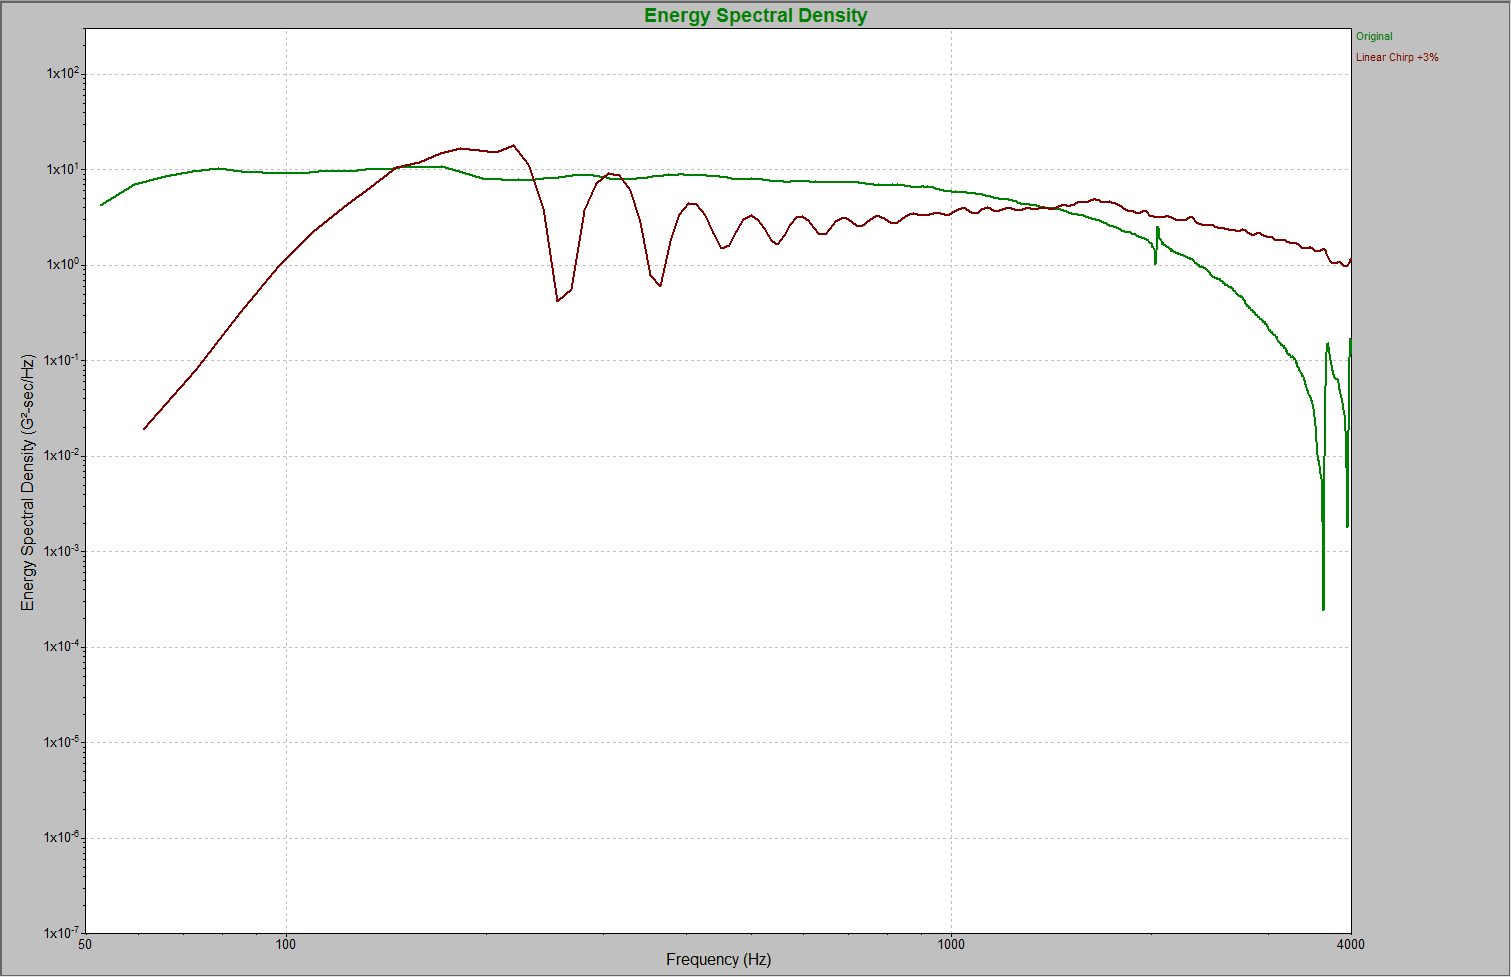
Figure 7: A Linear Chirp waveform overlaid on the original recording
The first factor to consider is waveform shape; it is important because, to be realistic, a mechanical shock test needs to test the DUT at the correct amplitudes across the frequency domain. Figure 7 compares the Linear Chirp waveform with an original real-world recording by overlaying their Energy Spectral Density plots. It clearly illustrates how the Linear Chirp synthetic method did not follow the real-world data waveform’s shape. The real-world data waveform has a sharp drop from about 1000 Hz to 4000 Hz, while the Linear Chirp synthetic waveform has only a small deflection in that range.
Frequency content
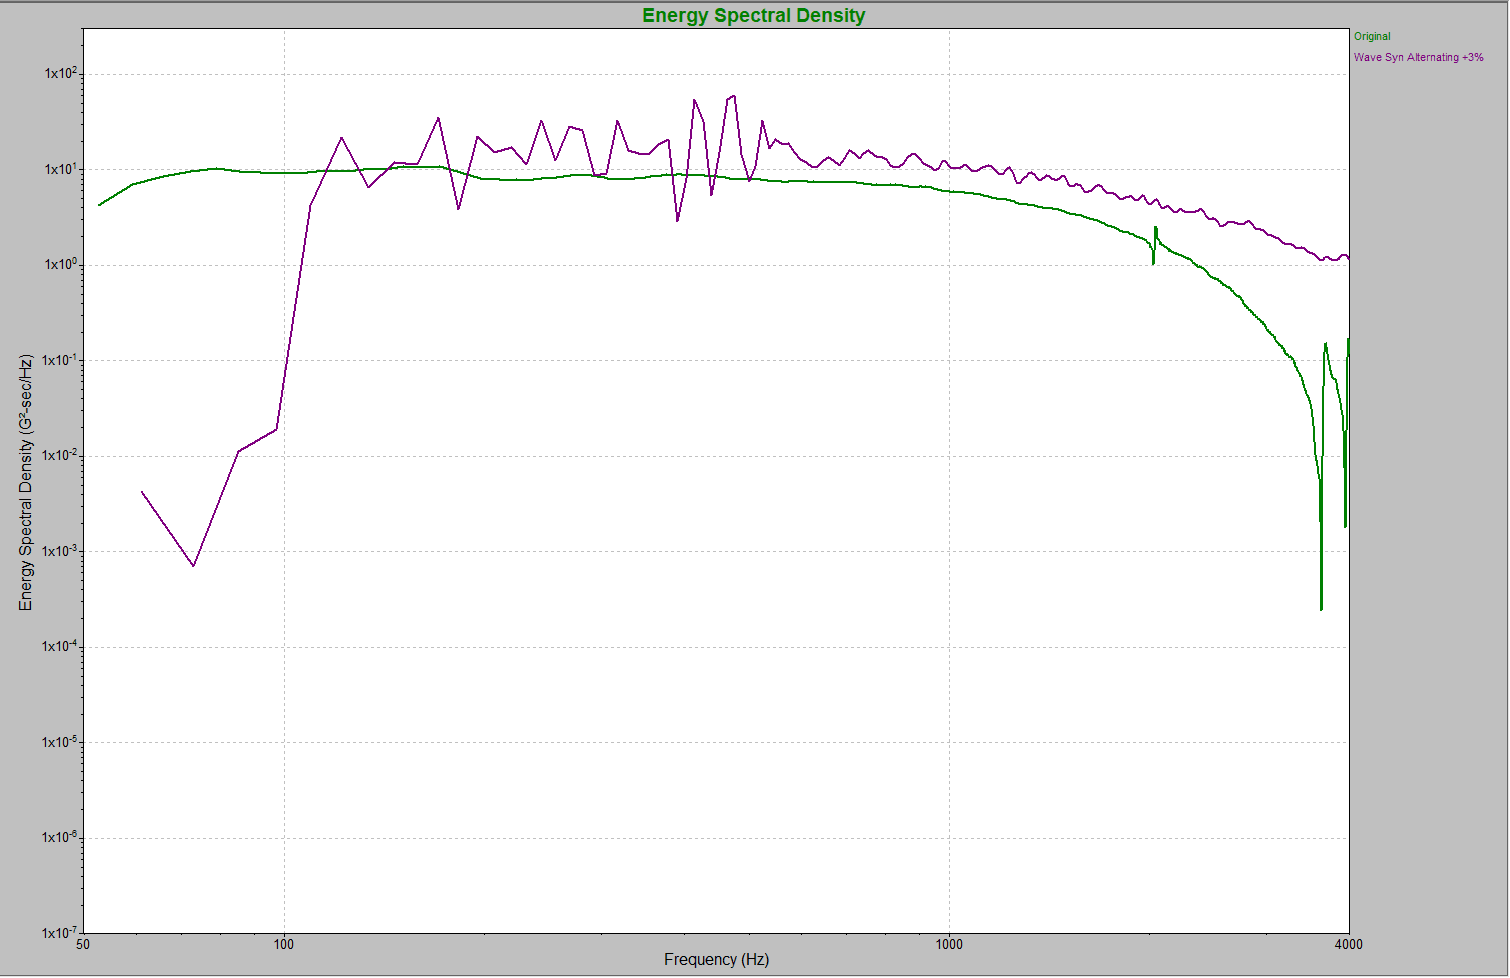
Figure 8: A WavSyn Alternating waveform overlaid on the original recording
The second factor to consider is frequency content, as a useful synthetic waveform must test a DUT across the same range of frequencies found in the real-world waveform. A synthesized waveform test that misses either low frequency or high-frequency vibrations will not result in a truly realistic test. Figure 8 shows that the WavSyn Alternating the synthesized waveform.
Energy/amplitude
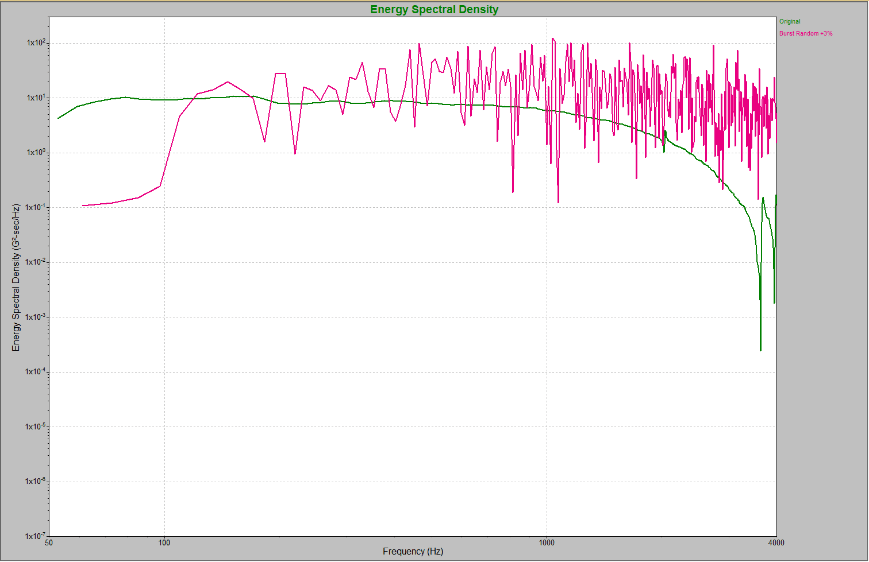
Figure 9: A Burst Random waveform overlaid on the original recording
Finally, test engineers should consider the energy or amplitude of the waveforms. While it is important for a test to have the correct waveform shape and the correct frequency content, a realistic test must also have the same amplitude as the real-world waveform. In Figure 9, the Burst Random synthetic waveform has amplitude vibrations across the frequency spectrum that are 10X greater than those of the real-world waveform, indicating a potential over-testing situation.
Comparing the Modified User Waveform with an Original Real-world Recording
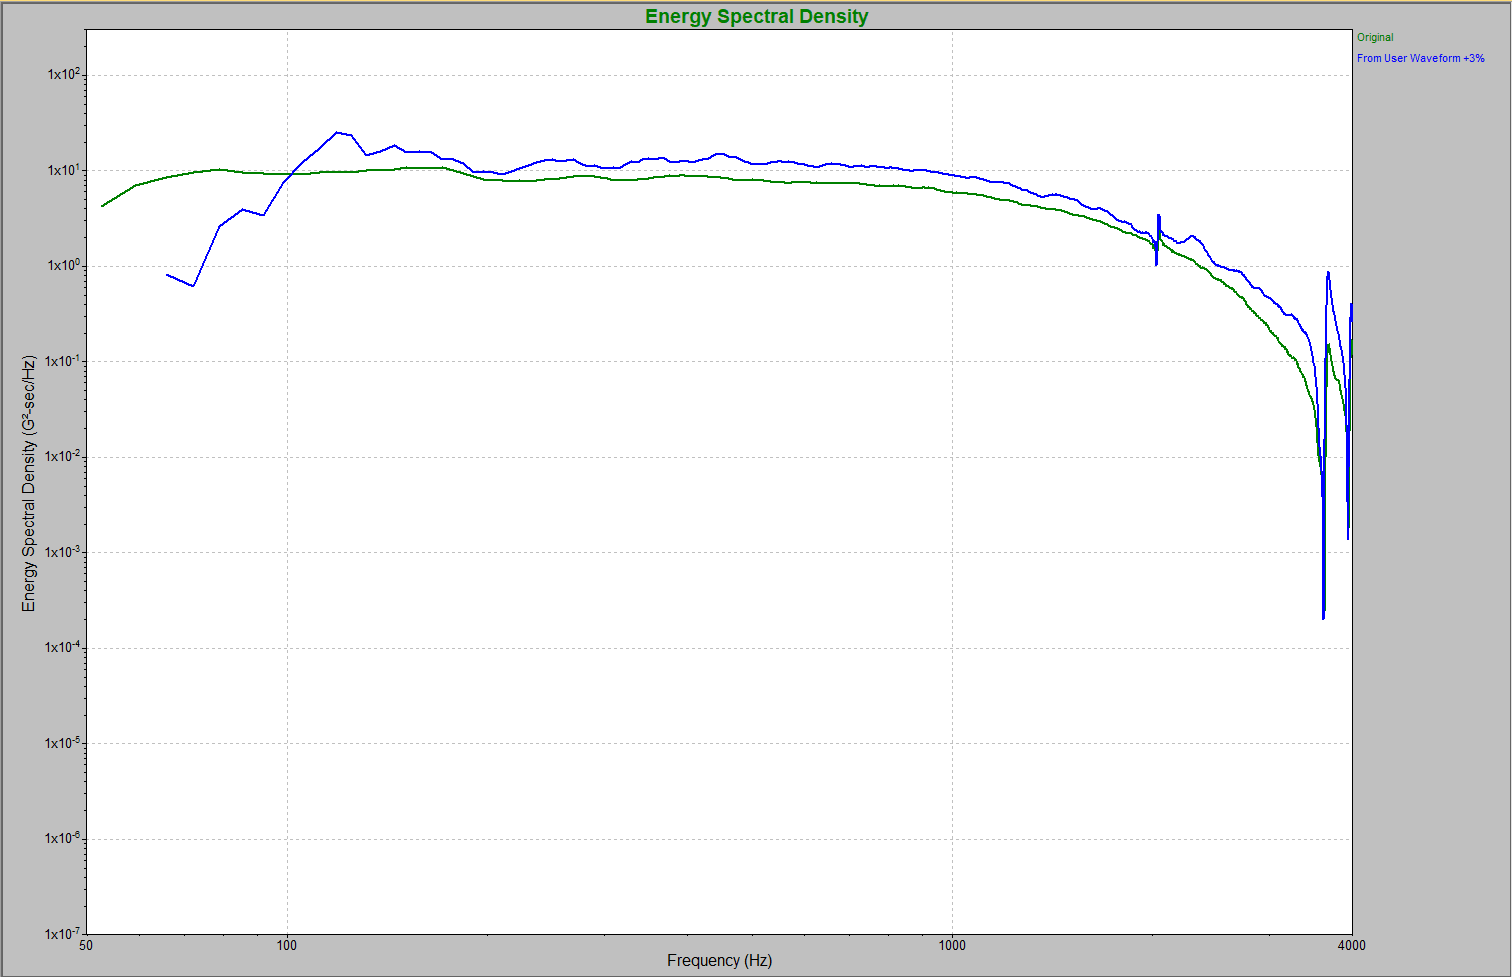
Figure 10: The modified user waveform overlaid on the original recording
After seeing the limitations of the standard synthetic waveforms, a comparison of the synthesized modified user waveform with the original real-world recordings is striking. As shown in Figure 10, they match very closely in terms of frequency content, waveform shape, and amplitudes across the frequency range.
5. Conclusions
This study’s data clearly shows that the modified user waveform generated with the max enveloping technique yields an SRS waveform closely matching the original real-world waveform in terms of waveform shape, frequency content, and amplitude.
As demonstrated in this paper, standard synthetic waveforms often do not closely match real-world transient events. They are generated from math algorithms and cannot duplicate the realistic qualities of a modified user waveform adjusted by a series of iterations to match a maximax SRS.
The modified user waveform, based on an enveloped set of real-world recordings, maintains real-world characteristics and creates an SRS waveform that accurately reflects those recorded events.