Introduction
There are strong opinions in the vibration industry when it comes to calculating accumulated fatigue damage. The main argument centers around the concept of stress and its relationship to the acceleration, velocity, and displacement of the device under test (DUT). Stress is directly related to fatigue. Thus, the correct relationship to stress will dictate the correct measurement of fatigue.
In 2011, Vibration Research Corporation conducted a study and was unable to produce conclusive evidence to illustrate that strain, and consequently stress, is proportional to velocity as theory suggests. However, a second study revealed a significant finding.
Study of Methodologies
Henderson and Piersol[1] maintain that “it is velocity rather than acceleration that has a direct relationship to stress” (p. 21). Consequently, they define the “damage potential spectrum” as:
(1) ![\begin{equation*} D=\frac{f_{n}T}{c}\left[\frac{k^2G_{aa}(f_{n})}{8\pi f_{n}\Zeta}\right]^{b/2}\Gamma[1+b/2] \end{equation*}](https://vibrationresearch.com/wp-content/ql-cache/quicklatex.com-01442f09c30bbf5f5e7268c377b9dfac_l3.png "Rendered by QuickLaTeX.com")
Although written with a Gaa term, this equation was derived from a Gvv term because of the assumption that damage is related to the velocity of the DUT (p. 21).
If it is assumed that some other parameter such as acceleration or displacement governs the equation for damage, then the equation would be adjusted by multiplying the Gaa term by 2π(fn) for the case of acceleration or dividing Gaa by 2π(fn) for the case of displacement.
The second study conducted by Vibration Research is the discussion of this paper. In the study, the fatigue damage spectrum (FDS) was calculated using three methodologies: 1. assuming the damage was related to acceleration, 2. assuming the damage was related to velocity, and 3. assuming the damage was related to displacement.
Testing of Methodologies
Using MATLAB scripts, several data sets were generated with varied kurtosis values. One of the data sets was passed through a MATLAB script and processed with the assumption that the fatigue damage was related to acceleration. The script produced an FDS and a probability spectrum density (PSD) graph.
The PSD data were then passed through a different MATLAB script and converted into a Gaussian waveform data set. The Gaussian waveform data set was passed through the initial fatigue damage script that assumed the fatigue damage was related to acceleration to produce a secondary FDS and PSD.
This process was repeated on the same data set with the assumption that the fatigue damage was related to velocity. The process was repeated a third time with the assumption that the fatigue damage was related to displacement.
The tests were performed on the same recorded waveform (TF=2 Hz; K=3.9834; T=60 sec). A second recorded waveform (TF=10; K=6.96145; T=60 sec) was used for comparison purposes and produced the same results as the first waveform. In this report, only the graphs of the K=3.9834 test are displayed.
Test Results
The test results displayed two interesting details.
Same PSD for all trials regardless of methodology
The VibrationVIEW software’s programming code converts a random waveform file into an FDS using the velocity-based fatigue damage method, although other methods could easily be incorporated. The FDS, in turn, is converted to a PSD plot. A new test profile is defined from the PSD and can be used by the test engineer to simulate the specific degree of damage in an original recording.
During the study, each trial utilizing a different method of calculating fatigue damage produced different FDS plots (Figure 1). Of course, one would expect that different methods of calculation would produce a different FDS.
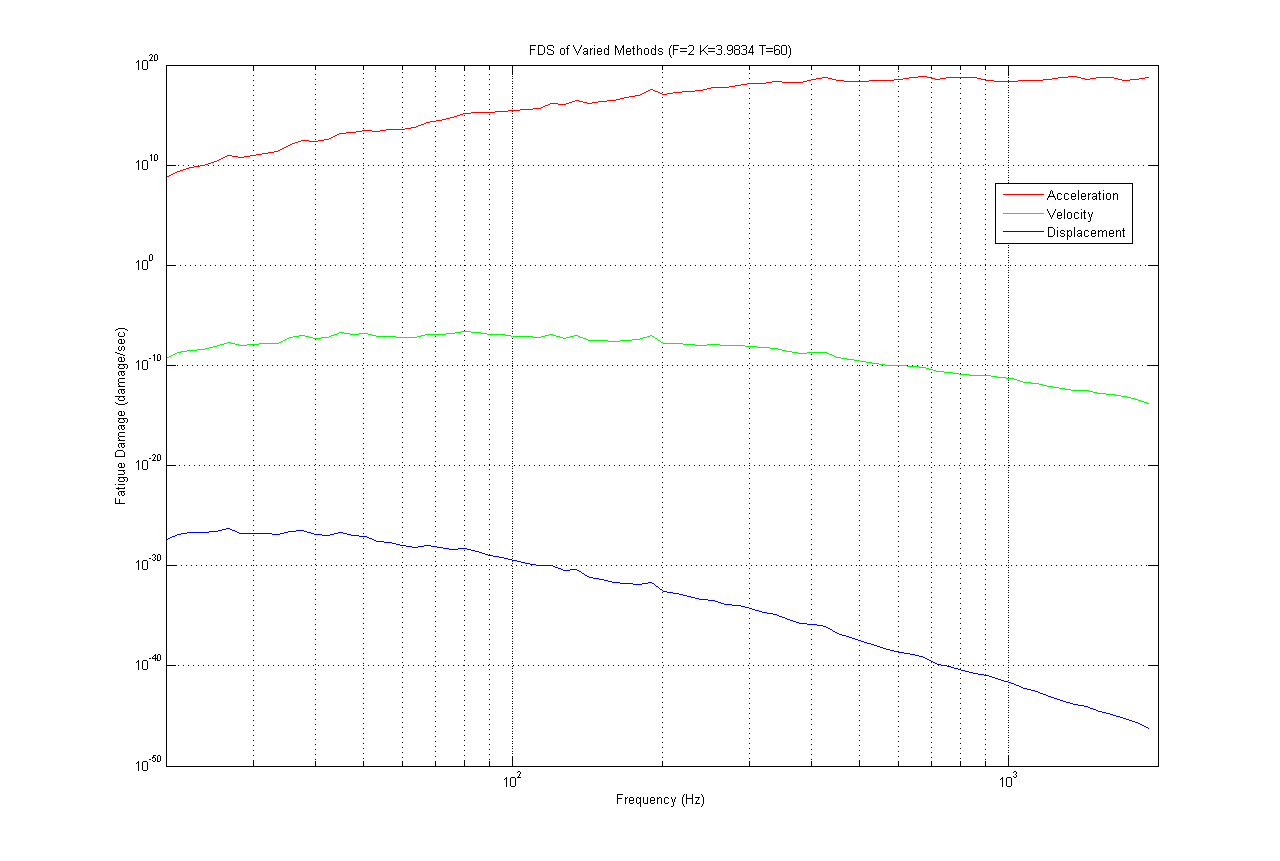
Figure 1. Different FDS for each methodology for a test of K=4.
However, when the FDS plots were converted into PSD plots, the same PSD was produced regardless of the methodology used to calculate the fatigue damage (Figures 2 and 3). It can be concluded that regardless of the FDS methodology utilized, the same PSD will be created.
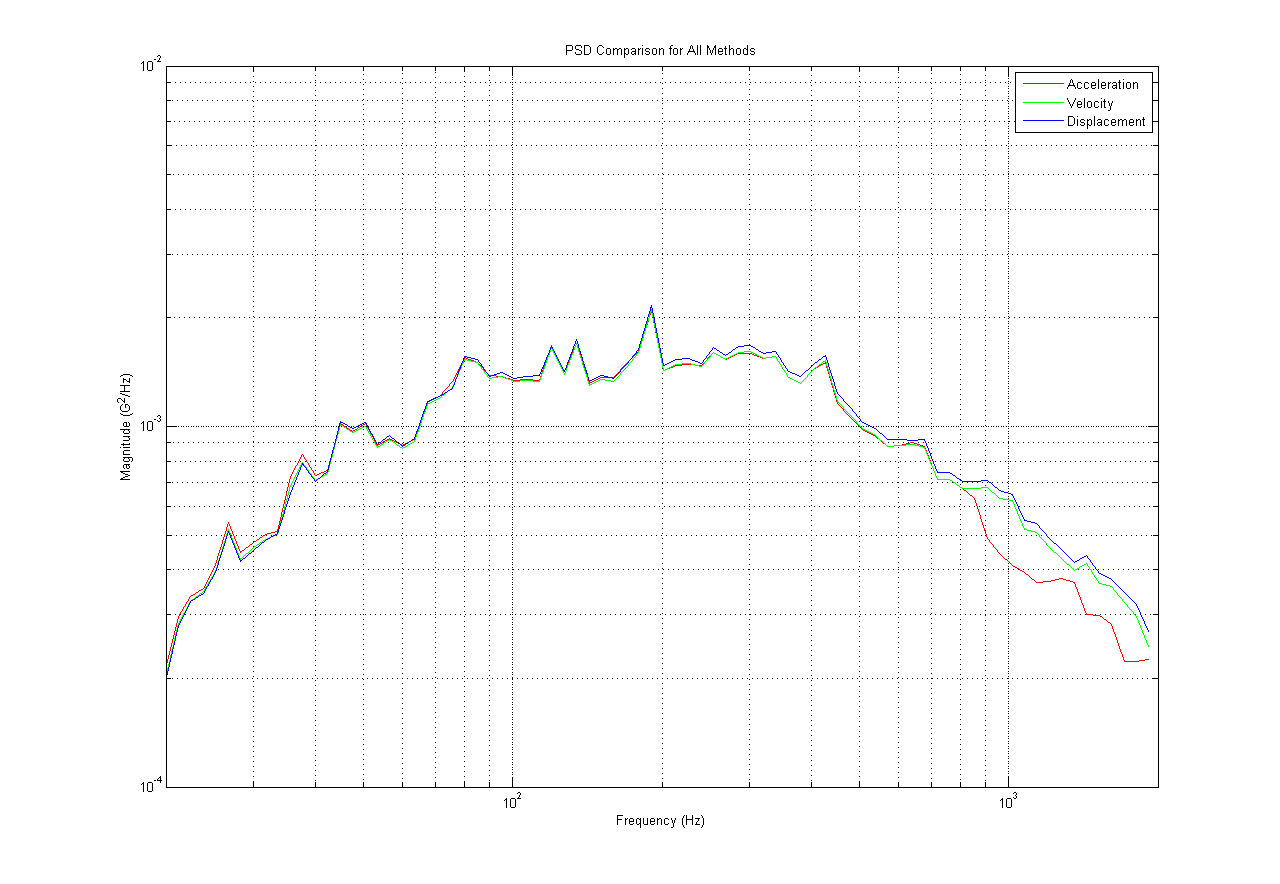
Figure 2. PSD for K=4 trial for all three methodologies.
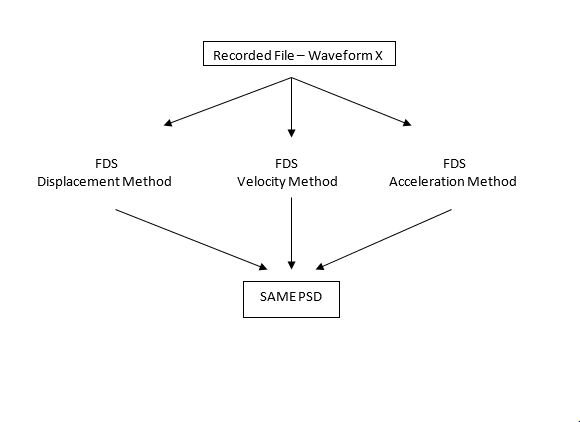
Figure 3. Representation of results of different fatigue calculation methodology trials.
Same PSD and FDS of the original and generated waveforms for each methodology
Although the FDS from the methodologies differed (Figure 1), the FDS of the original waveform and the FDS of the waveform generated from the original waveform’s PSD (calculated with the same methodology) were identical (Figures 4-6).
This finding demonstrates the effectiveness of VibrationVIEW programming. When a waveform is imported into VibrationVIEW, the software converts it into an FDS. The FDS is then converted into a PSD from which the test engineer can run tests (Gaussian waveform) to bring the product to a specific amount of fatigue (as illustrated by the FDS). If this Gaussian test were run and recorded, its recording would have the same FDS as the original waveform. This test shows that the VibrationVIEW code will produce the same FDS in a generated Gaussian waveform as in the originally recorded data.
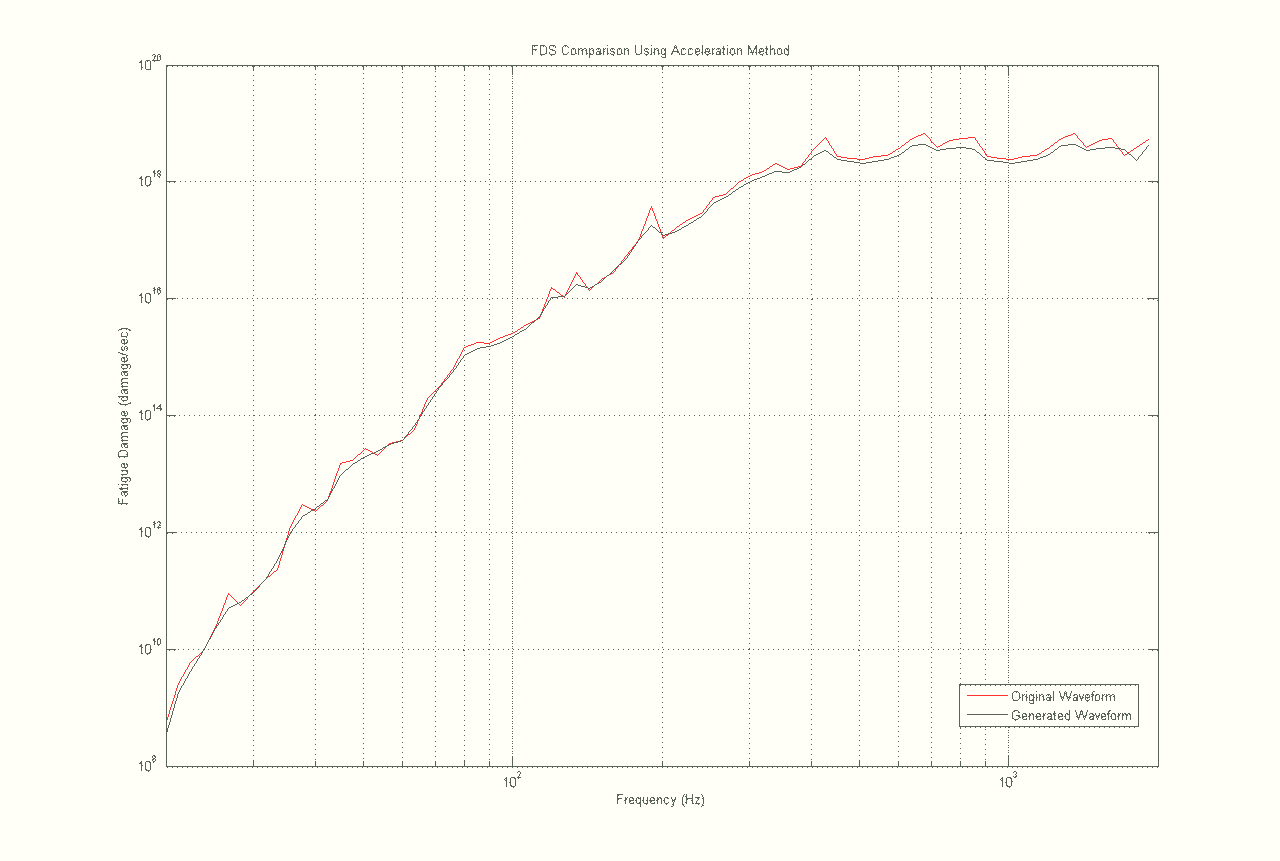
Figure 4. FDS for original and generated waveform using the acceleration methodology.
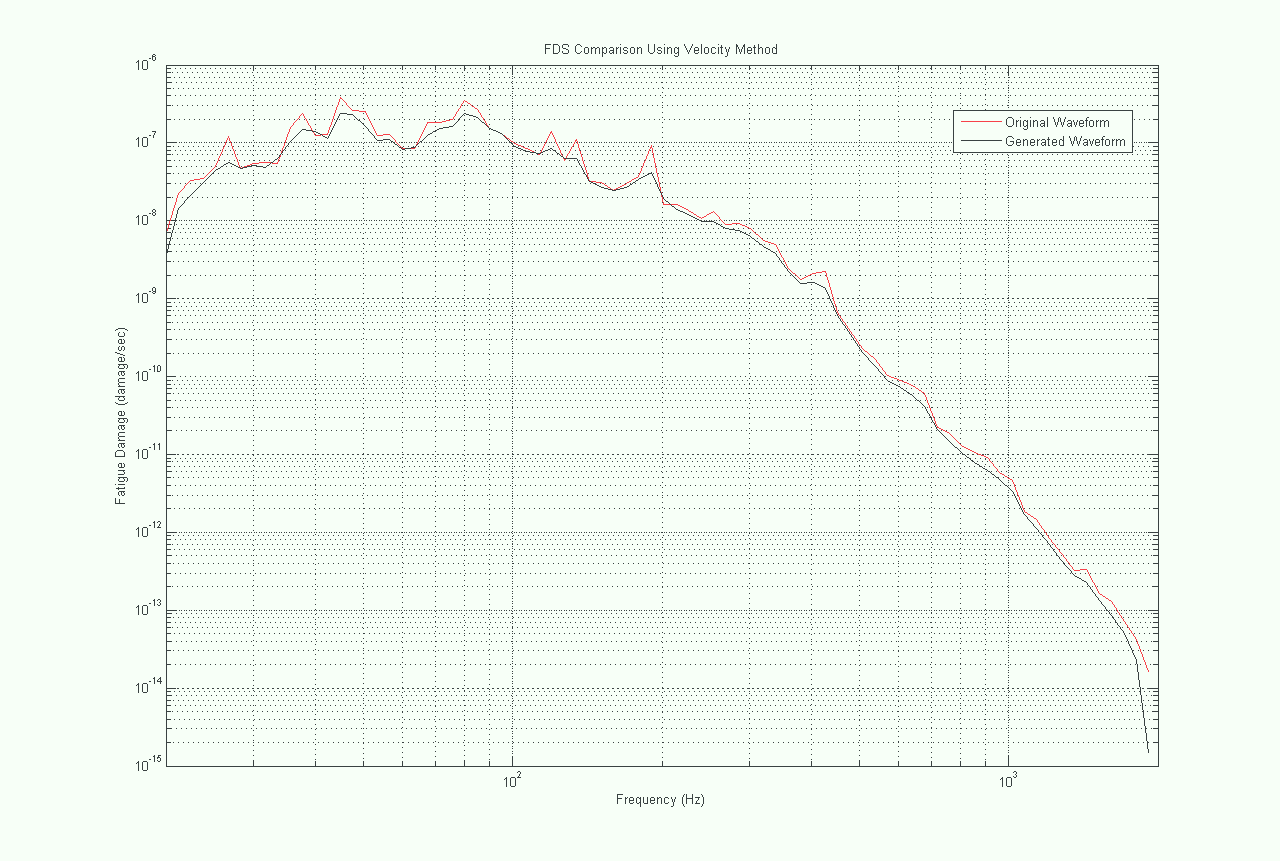
Figure 5. FDS for original and generated waveform using the velocity methodology.
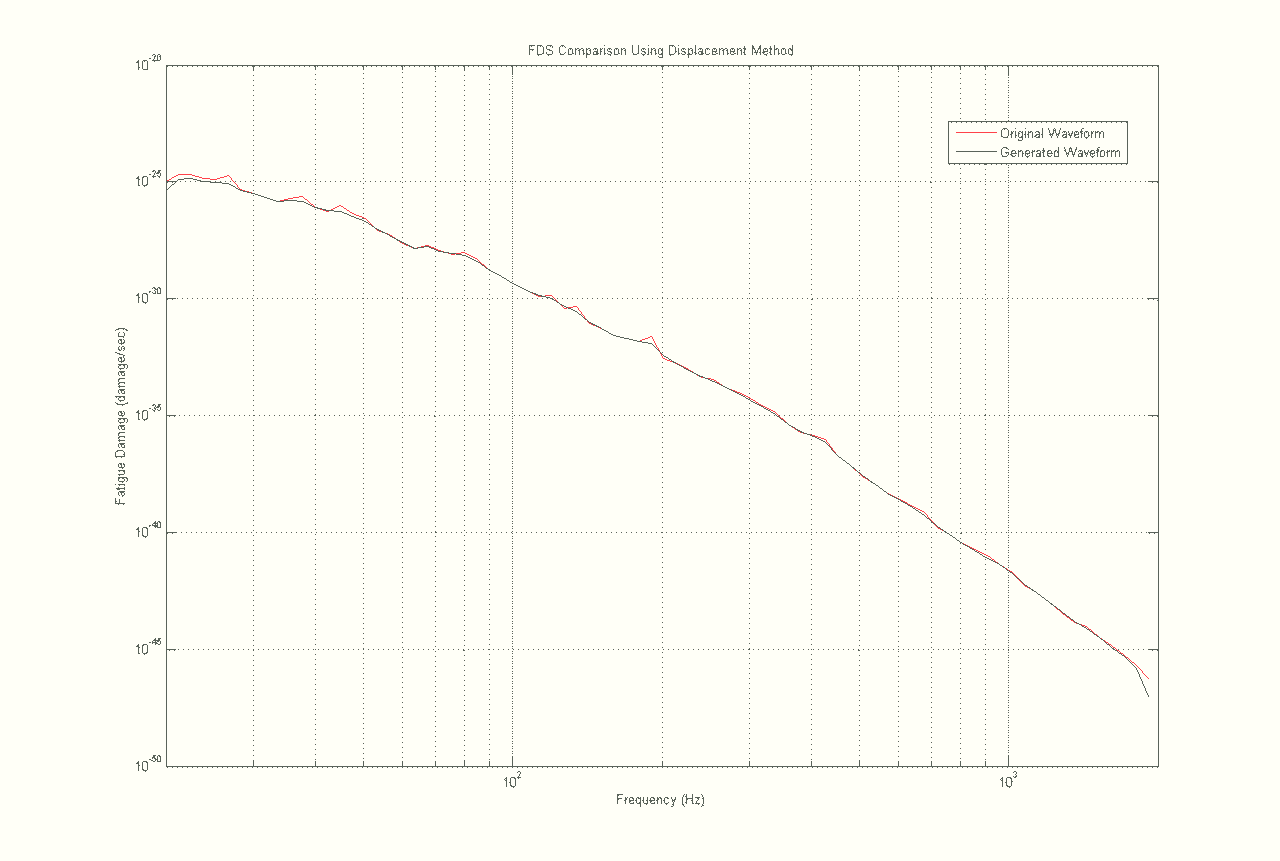
Figure 6. FDS for original and generated waveform using the displacement methodology.
Conclusion
Engineers have written many papers to emphasize that the stress, and therefore the fatigue damage, of a DUT’s member is proportionally related to the velocity of the member[1],[2],[3],[4]. On the basis of the definition of strain, others have argued that strain, and consequently the stress during the elastic period of the S-N curve, is directly related to the displacement of the DUT’s member (see definition of strain[5]).
What this study indicates is that the argument is a moot point. Engineers can choose the methodology of their preference (acceleration-based fatigue; velocity-based fatigue; or displacement-based fatigue) and run the test assuming fatigue is related to that methodology. Although one engineer may choose displacement-based fatigue and another may choose velocity-based fatigue, in the end, the different methodologies will produce the same PSD. The argument over which parameter is most closely related to the fatigue damage that the DUT experienced is irrelevant.
In the testing industry, it is often true that there is only one correct answer. In this case, however, we learn that all roads lead to the same PSD. This makes for a happy vibration testing community.