Abstract
Random vibration testing is the industry workhorse for simulating the environment for a broad range of products. Tests specifications typically define a spectrum shape and overall root mean square (RMS) amplitude. The test controller then controls a measured reference acceleration at these parameters. The controller forces a shaped-random response with a normal, or Gaussian, amplitude distribution.
Experience has shown that Gaussian distributed tests may be too conservative for some product/environment combinations; they do not always produce the same damage statistics observed in the field. Adding a third control dimension leads to more realistic random vibration tests that better match the damage potential of the field environment. That third dimension is kurtosis control, which matches the test’s amplitude distribution to that of the product’s environment.
Introduction
Random vibration testing has largely remained unchanged in technique since its introduction in the early 1950s. It attempts to capture the behavior of a product’s service vibration environment and reproduce a similar environment in the test lab. To do so, it summarizes the test environment using a frequency spectrum, which provides the relative weighting of each frequency band and an average overall signal intensity. The frequency spectrum is typically defined as an acceleration power spectral density (PSD), and the overall signal intensity is typically defined as an averaged RMS acceleration.
Random vibration testing produces a waveform similar in appearance to those measured in the field. However, despite the similarity of random tests and environmental waveforms, the industry is beginning to recognize that many current test specifications do not capture the field vibration environment with sufficient intensity. For example, in the automotive world, engineers often find that random tests do not produce the product faults that should occur during vibration testing. They sometimes take the specified random spectrum and increase the intensity level according to their own internal, home-cooked formula to improve test effectiveness. They increase the intensity level to match the random peak g levels to the real world.
Another method to rectify this random test pitfall is to use a Field Data Replication (FDR) technique, where the engineer reproduces a waveform measured in the field on a shaker in the lab. This method can be helpful in many test scenarios. However, critics of FDR techniques claim it doesn’t capture the variability in the field because the test waveform reflects just one field measurement. For example, each lap around a test track will produce a different vibration waveform. Recording a single lap and repeating it many times on your shaker removes the variability.
Additionally, the amount of data involved in FDR techniques makes it difficult for the industry to define a standard and test pass/fail criteria. As such, there are few test specifications based on FDR techniques.
Experience strongly suggests that the problem with current random test techniques is the inability to reproduce the peak accelerations occurring during product use. The solution to this problem involves adding a third parameter to vibration tests. Presently, random techniques are controlled by two parameters: one that controls the frequency content of the PSD spectrum and a second that controls the overall test amplitude (RMS). By adding a third parameter of kurtosis control, engineers can control the time that random tests run at higher RMS values. This parameter adds desired peak accelerations that cause real-life product failures—i.e., the values that current random vibration techniques are missing.
Industry History
Present-day methods of random testing assume a Gaussian mode of data distribution. Modern controllers run random vibration tests where most RMS values are near the mean level, and the product vibrates at peak RMS values for only a brief period. A Gaussian waveform will instantaneously exceed three times the RMS level 0.27% of the time.
Recorded field data shows amplitudes exceeding three times the RMS level as much as 1.5% of the time. This difference can be significant, as it has been reported that most fatigue damage is generated by accelerations in the range of two to four times the RMS level [1]. Significantly reducing the time spent near these peak values can reduce the fatigue damage caused by the test relative to what the product will experience in the real world. Gaussian distribution, therefore, is not entirely realistic.
Why Use a Gaussian Distribution?
The industry has used Gaussian distribution since the infancy of random vibration testing into the present day for several reasons. First, the linear filtering of one Gaussian distribution will result in another Gaussian distribution. As such, spectrum shaping and the shaker frequency response function do not change the amplitude distribution. This linear transformation property also means that Gaussian data in the time domain transformed with a fast Fourier transform (FFT) (as is done in digital random control systems) results in a Gaussian distribution in the frequency domain.
Secondly, two parameters can determine a Gaussian distribution: the mean and standard deviation. In the context of random vibration, the mean (average acceleration) is always zero. Therefore, a single parameter can define the Gaussian distribution of a standard random vibration test: the standard deviation (acceleration RMS). The industry uses a Gaussian distribution because of its simplicity.
Kurtosis: A Better Method than Gaussian Distribution
It is necessary to review the meaning and significance of the statistical term kurtosis to understand how a third parameter of kurtosis control can improve upon Gaussian distribution.
Kurtosis is a statistical term that describes the relative distribution of data. It is defined as the ratio of statistical moments. Statistics defines normalized kurtosis as the fourth statistical moment divided by the square of the second statistical moment. Normalization removes variability from the measurement due to waveform amplitude. In a normalized form, the kurtosis for Gaussian data is always 3, regardless of the RMS level or PSD. The normalized kurtosis value k can be computed from N samples of zero-mean waveform data, xi, using Equation 1.
(1) 
Equation 1
If your data is not zero-mean, you can subtract the mean before using Equation 1. Therefore, true Gaussian data will have a kurtosis value of 3.
Graphically, kurtosis is a measurement of the size of the distribution’s “tails.” A data set with a high kurtosis value will produce a distribution curve with a higher peak value at the mean and longer tails or, in other words, more data points at the extreme values from the mean (Figure 1).
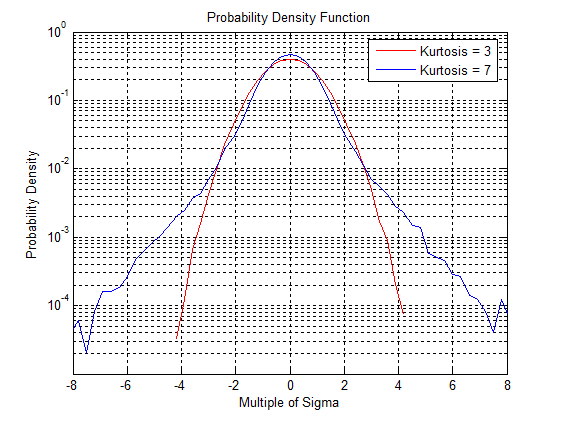
Figure 1. A comparison of PDFs with kurtosis values of 3 and 7. The higher kurtosis value includes higher sigma values (higher peak accelerations).
A Gaussian distribution of a standard random vibration test can inadequately represent real-world data. Since Gaussian distribution can be defined using a single parameter (the standard deviation or RMS acceleration), it is beneficial to consider additional parameters. Ideally, test specifications could add one other number to capture the peaks’ probability density distribution. What mathematical manipulation can do this?
The “Peakiness” Factor
In statistical parameters, the mean is the first statistical moment, and the RMS is the square root of the second statistical moment. An obvious extension to consider is matching additional statistical moments between lab and field data distribution. The third statistical moment (skewness) is zero for symmetric distributions centered around zero. The fourth statistical moment (kurtosis) is sensitive to the increased probability of peaks. Kurtosis is sometimes referred to as the “peakiness” factor. It is a desirable parameter to include in the random controller to more closely match the PDF to field data. Test standards may even require it as a parameter for the random test to be realistic.
A better method of testing products than a Gaussian distribution of data is adjusting the distribution to more closely fit the real-world data by adjusting the kurtosis level. The difference between a Gaussian distribution and a higher kurtosis value is the time spent at or near the peak levels. Adjusting the kurtosis level to match the measured levels in the field will result in a more realistic test.
Demonstrating Real-world Data are Non-Gaussian
REAL-WORLD STATISTICS SHOW THE NEED FOR KURTOSIS CONTROL
To demonstrate that field data are often significantly non-Gaussian, data were collected from a series of 40 measurements in four different environments:
- Automotive: 1999 Oldsmobile Bravada (Trial Number 1-13)
- Aeronautical: 2004 Cessna Syklane 182 Turbo (Trial Number 14-24)
- Agricultural: TS110 New Holland Tractor and Celery Harvester (Trial Number 25-37)
- Industrial: Ground Heater-Diesel, single-cylinder generator, Kubota engine (Trial Number 38-40)
Accelerometers were mounted at various locations (windows, dashboards, armrests, steering column, power take-off motor, loader frame, engine bracket, etc.). The vibration was measured using a data recorder software program. Figure 2 shows the kurtosis values computed for all 40 measurements. Of the 40 data sets, 58% of the data had a kurtosis level greater than 3.3. In these instances, kurtosis reproduction would have a significant effect.

Figure 2. The kurtosis values for 40 tests conducted by Vibration Research; note the variety of kurtosis values. Twenty-three tests have a k > 3.3.
The results corroborate others’ results [1, 2, 3]. While a Gaussian PDF may be sufficient in some cases, field data are often significantly non-Gaussian.
Using Kurtosis Control to Match Real-World Distribution
The PDF spectrum of an example real-world data set was examined and a comparison was made between a standard controller-produced Gaussian distribution and a kurtosis-controlled distribution. Acceleration data were recorded on an automotive dashboard while driving on a gravel road. The measurements were imported into a random vibration control software program, which calculated the measured data’s average PSD and kurtosis. The kurtosis was 3.8, indicating that the environment was non-Gaussian.
Then, two random tests were run using a vibration controller to match the recorded environment. Both tests were controlled to the same measured PSD spectrum and overall RMS values. One of the tests used a standard algorithm to produce a Gaussian signal. The second test used a kurtosis control algorithm to match the measured 3.8 value.
Results
Figure 3 shows that the PDF of the kurtosis-controlled test produced a far better match to the field measurements than the Gaussian-controlled test. The field measurement and kurtosis-controlled test both exhibit broader PDF tails than the Gaussian test. These tails indicate the measured environment was more severe than the Gaussian test intended to represent it.
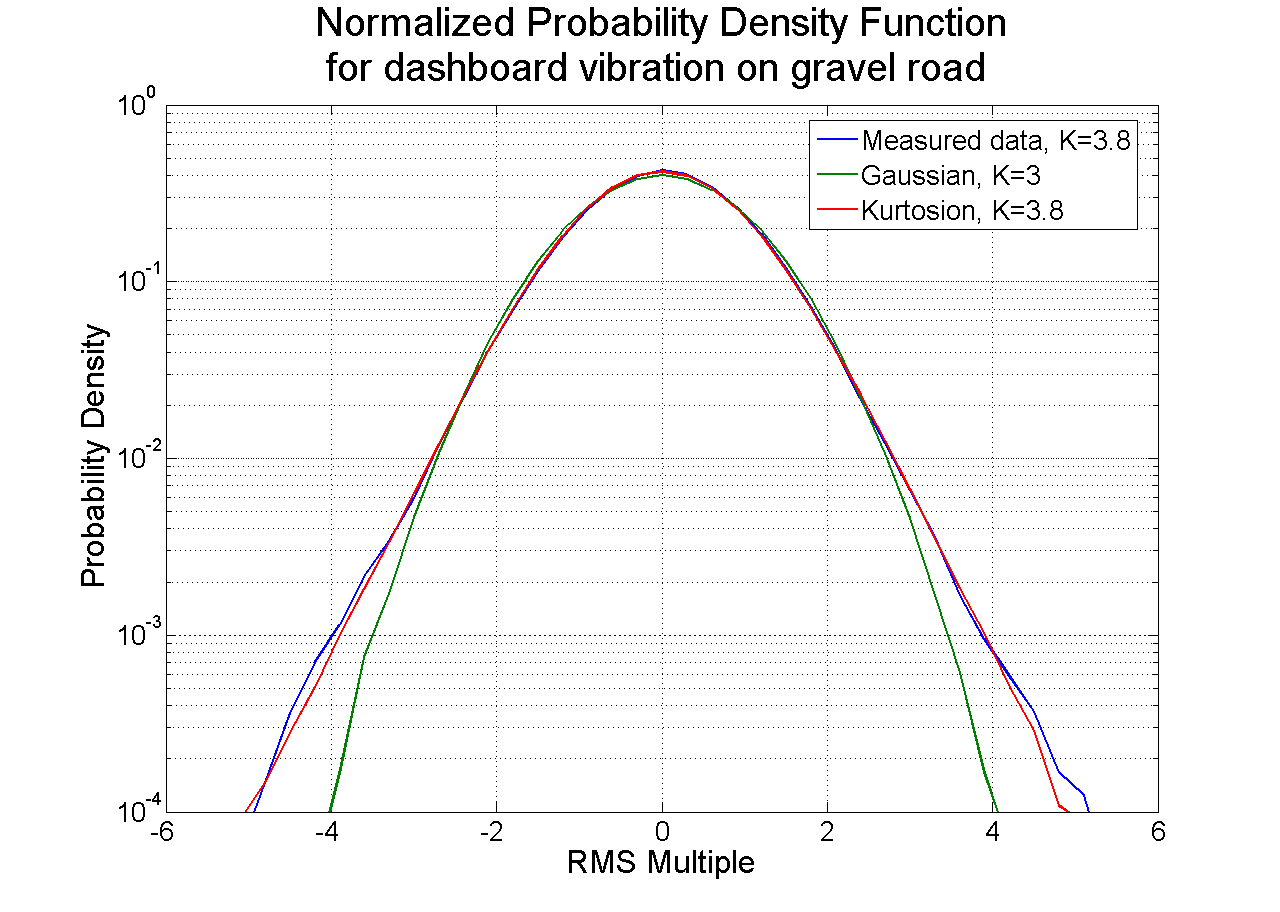
Figure 3. The probability density function for measured field data compared with that produced by random vibration testing with and without matching kurtosis. When the kurtosis is matched, the probability density function reproduced in the lab environment matches much more closely to field measurements.
Developing the Third Dimension of Random Vibration Control
The latest advancement in random vibration testing is the patented Kurtosion® software, a closed-loop method of kurtosis control developed by Vibration Research. This test development method allows engineers to adjust the kurtosis levels while maintaining the test profile and spectrum attributes.
With Kurtosion, engineers define a kurtosis parameter in addition to the standard PDF and RMS parameters to produce a shaker test profile. It is similar to current random testing but one step closer to the measured field vibration. Engineers can measure the kurtosis parameter from field data using Equation 1, similar to how they determine the RMS and PDF from field data.
Shifting the Distribution
The Kurtosion technique begins with a statistical distribution similar in shape to the distribution of the field-measured data and with a variable kurtosis level controlled by a single parameter. Figure 4 shows the distribution for a sampling of kurtosis values. The distribution tails are extended to achieve the increased kurtosis in the same way as non-Gaussian field measurements.
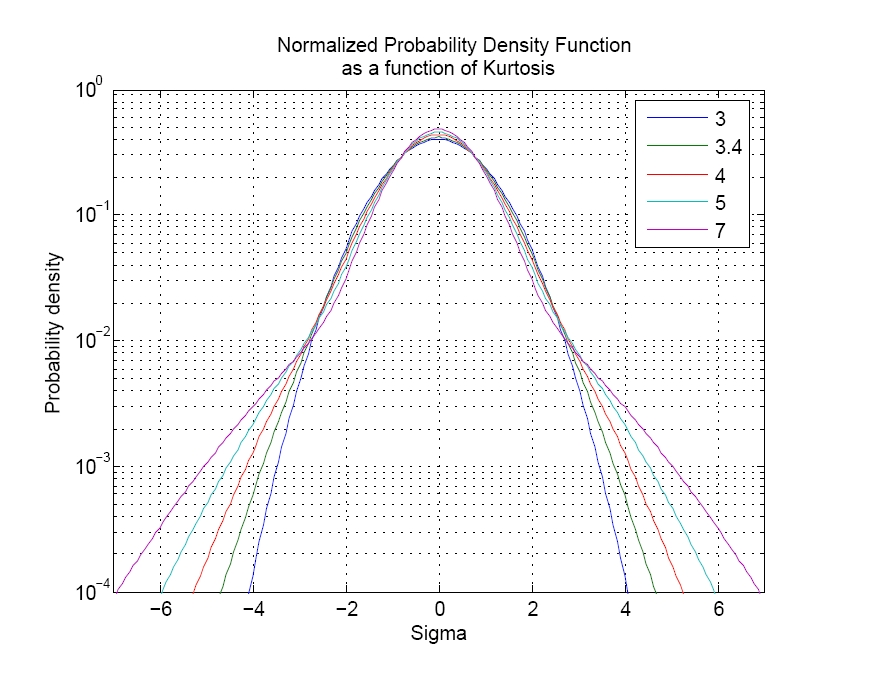
Figure 4. The normalized probability density function for a set of data at several kurtosis values.
The kurtosis parameter shifts the distribution smoothly over the full range from Gaussian through high kurtosis levels. A feedback control loop implemented in the controller can achieve the desired kurtosis level in the acceleration waveform. Implementing feedback control on the acceleration measurements is critical because the kurtosis level at the controller output will typically differ from that in the acceleration waveform. Without feedback control, the engineer could set the kurtosis of the controller output signal, but it would not achieve the desired kurtosis on their shaker.
Figure 5 is an alternative view of the distribution, displaying the probability of exceeding an absolute-value amplitude. This view is interesting because it is readily evident that the kurtosis parameter directly translates to an increased time spent at higher amplitudes. The traces cross at twice the RMS value, with a probability of 4.6%. Regardless of the kurtosis, the instantaneous acceleration is less than twice the RMS value for 95.4% of the test time for the selected family of distributions. The most damaging events occur at the higher levels, which represent less than 5% of the test duration. Kurtosis strongly affects the severity of these events.
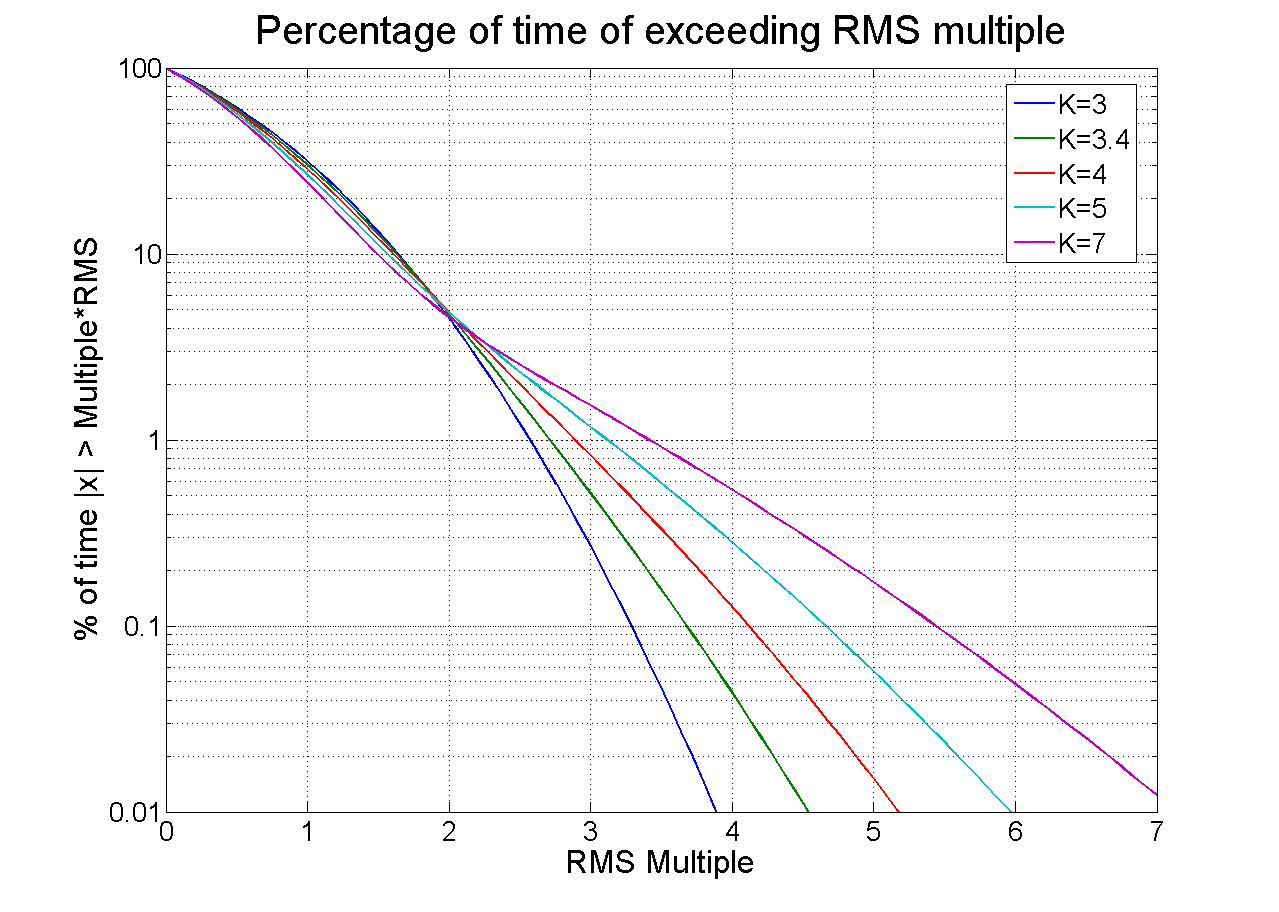
Figure 5. Percentage of time spent above multiples of the RMS level at several kurtosis values. Higher kurtosis levels significantly increase the amount of time spent at or near peak levels.
For example, a Gaussian distribution (k=3) spends only 0.27% of the time above three times the RMS level. Increasing the kurtosis to four will increase the time to 0.83%; increasing it to seven increases the time to 1.5%. This increase may not sound like much but consider that during a 1-hour test, the test article will be approaching a full minute at levels above three sigma rather than below. This statistic can translate to significant product stresses. These stresses will not occur with a traditional Gaussian distribution but do occur in the field environment.
To illustrate this point, we divided each vertical amplitude in Figure 5 by the amplitude for k=3 (Gaussian) to get the relative time above the absolute value versus three sigma for each value of k (Figure 6). With increased kurtosis, the relative amount of time spent at the higher levels is increased many times over the Gaussian case.
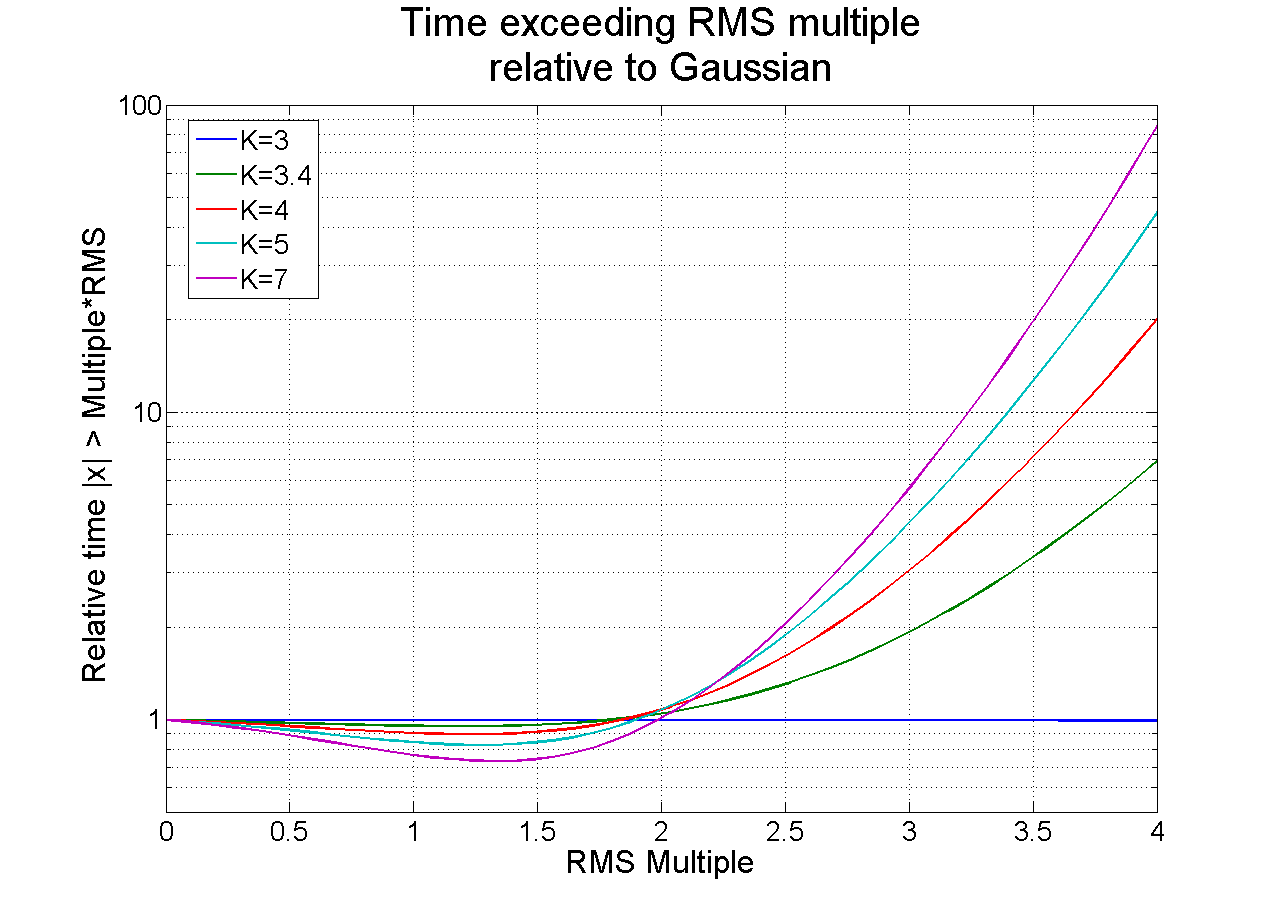
Figure 6. Illustrating how kurtosis increases time spent at higher levels.
Maintaining the Frequency Spectrum
The Kurtosion control technique can control PSD and RMS levels like standard random tests. Engineers can run any test previously run on a standard random controller system with the same PSD specifications and a user-defined kurtosis value. This technique maintains the frequency spectrum and operates so that the engineer can adjust the kurtosis of the acceleration waveform without affecting or distorting the spectrum. As a result, the kurtosis feedback control loop can operate independently from the standard random control without any effect on the spectrum.
Frequency spectra (acceleration spectrum profile) for a celery harvester (Figures 7 and 8) illustrate this feature. Figure 7 is a standard Gaussian distribution with 3-sigma clipping. Figure 8 shows the same field-recorded data with a kurtosis control set at 5. The acceleration profile spectra are identical even though the kurtosis levels differ. These figures demonstrate the second aspect of the Kurtosion control technique: an adjustment in kurtosis levels does not affect the PSD and RMS levels.
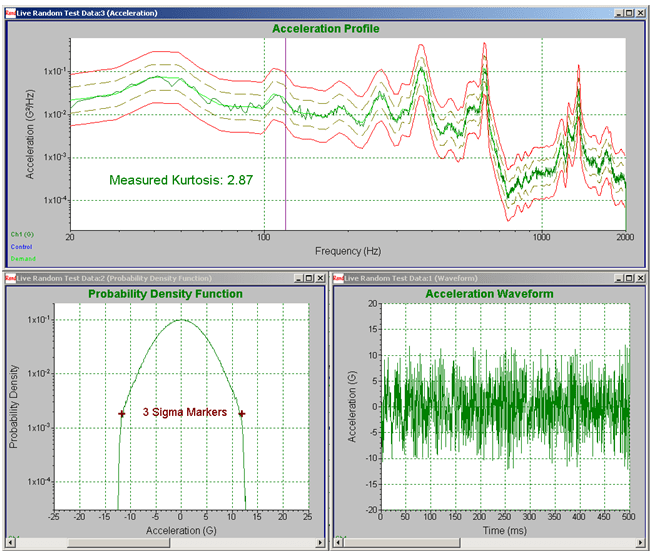
Figure 7. Harvester acceleration profile with Gaussian Distribution and 3 sigma clipping.

Figure 8. Harvester acceleration profile with k=5.
Increasing Kurtosis Across the Bandwidth
The Kurtosion control technique introduces kurtosis so that all frequencies in the test spectrum have an increased kurtosis. This feature is critical because most devices under test have narrow-band resonances. The control must increase the kurtosis at the resonant frequencies, or the resonances will not see the resulting increased peak amplitudes, and the results at those frequencies will be no different from standard random control techniques. This technique increases the kurtosis across the entire bandwidth of the random test, including the resonant frequencies of the device under test.
Avoiding Harmonic Distortion
The Kurtosion control technique does not change the controller’s dynamic range. This technique does not contain non-linear elements; therefore, it does not introduce harmonic distortion into the test. Harmonic distortion is the primary factor limiting dynamic range in random vibration controllers, so avoiding it in the control algorithm is critical. For example, a harmonic distortion of 0.003% will limit the achievable dynamic range of a random vibration control system to 90 dB.
Since Kurtosion does not add harmonic distortion, the control system’s dynamic range is only limited by the harmonic distortion of the accompanying analog electronics. This technique has the same dynamic range characteristics as a standard random vibration controller system.
Demonstration
To demonstrate the third and fourth aspects of this new kurtosis technique, a random vibration test was run with standard Gaussian random control (kurtosis = 3) and then also with kurtosis = 5, with kurtosis applied to frequencies above 10 Hz. The breakpoints for this profile are listed in Table 1. For the sake of comparison, the proposed non-linear method of kurtosis control (ref. 3) was also computed for skewness = 0 and kurtosis = 5.
| Frequency (Hz) | g2/Hz |
| 20 | 1 X 10⁻¹⁰ |
| 80 | 0.1 |
| 300 | 0.1 |
| 350 | 1 X 10⁻¹⁰ |
| 500 | 1 X 10⁻¹⁰ |
| 600 | 0.001 |
| 650 | 0.001 |
| 700 | 0.1 |
| 750 | 0.001 |
| 800 | 0.001 |
| 1000 | 0.1 |
| 1500 | 0.1 |
| 2000 | 0.001 |
Table 1. Breakpoints for Dynamic Range Test
To examine the relationship between kurtosis and frequency, the data were separated into one-third octave bands, and the kurtosis of each band was computed. These results are plotted in Figure 9. This definitively demonstrates that the new kurtosis control method increases the kurtosis across the entire frequency band for the test, while the other non-linear kurtosis method shows no increase over any single narrow band. This demonstrates the important third aspect of the new method of kurtosis control – that kurtosis increases across the entire bandwidth of the random test, including the resonant frequencies of the object under test.
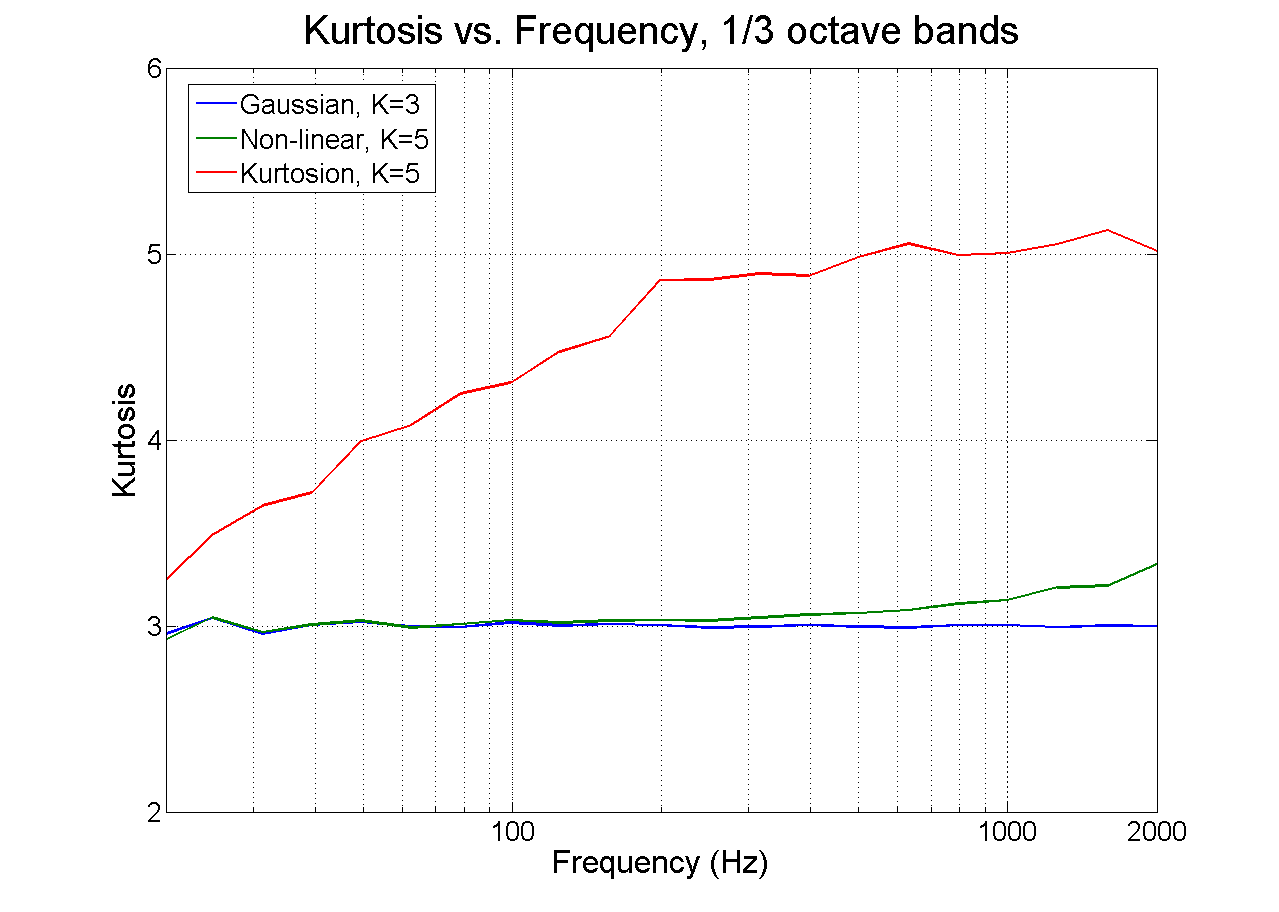
Figure 9. Kurtosis measured in one-third-octave bands for the standard Gaussian random control (kurtosis = 3), for the new method with kurtosis = 5, and for the previous nonlinear method. The new method increases kurtosis through the frequency band of the test.
Figure 10 demonstrates the benefits of the fourth aspect of the new kurtosis control technique. It shows that the spectrum with the new technique is unchanged by the increase in kurtosis, demonstrating that the same PSD with the same dynamic range is achieved regardless of kurtosis level. As the spectrum control is unchanged by the kurtosis change, it is possible to change the kurtosis from 3 to 5 to 7 (and beyond) without any change in the resulting spectrum. In contrast, the proposed non-linear technique shows a significant loss in dynamic range, so that only 23 dB of the dynamic range remains.
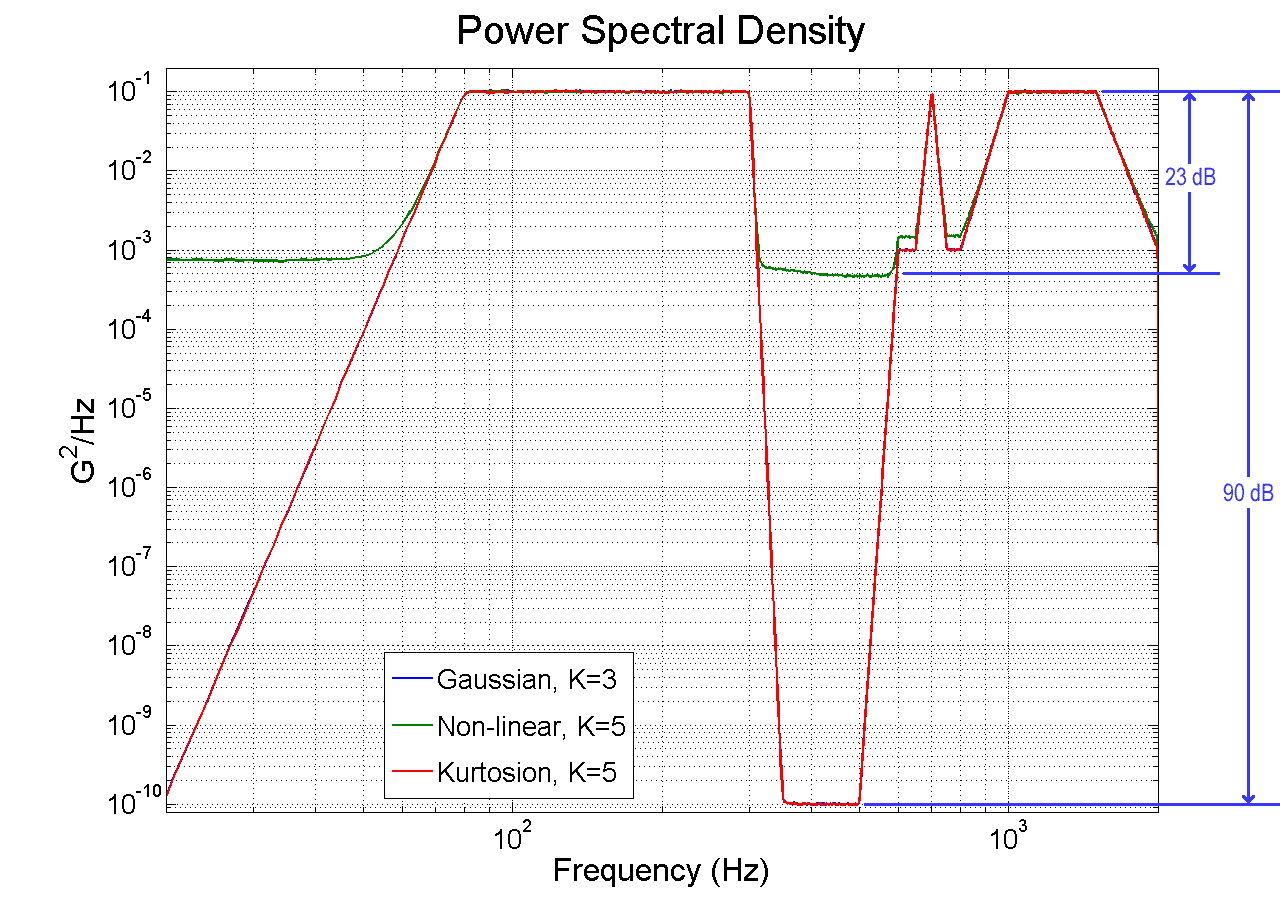
Figure 10. Power spectral density plot for a new method, plotted for kurtosis value of 5, compared to both standard Gaussian random control (kurtosis = 3) and for the previous non-linear method. The new method maintains the controller dynamic range while the non-linear method severely limits dynamic range.
Experimental Results
The obvious question is “What significance does this have to vibration testing?” The bottom line in vibration testing is that the testing should highlight potential field failure problems early in development before they become issues in the field. If including a kurtosis control parameter does not make a difference in isolating product weaknesses, then it would be a meaningless function. With this in mind, we constructed a simple controlled experiment to investigate the effects of increased kurtosis on time to failure. Ordinary 75-watt light bulbs were chosen as the test item because the failure of a light bulb is readily evident. Light bulbs also are inexpensive, allowing for many test runs to improve the statistical significance of the results.
The PSD used was based on a standard automotive specification, referred to as “body and IP profile,” – a vibration profile for automobile instrument panels – with a modification of extending the bandwidth of the low-frequency energy level out to 100 Hz to encompass the observed 90 Hz resonance frequency present in the light bulbs. The breakpoints for this profile are listed in Table 2. A fixture with two light bulb sockets was mounted to the table of an electrodynamic shaker, as shown in Figure 11.
| frequency (Hz) | g2/Hz |
| 5 | 0.0001 |
| 20 | 0.1242 |
| 100 | 0.1242 |
| 155 | 0.001 |
| 200 | 0.1242 |
| 300 | 0.00016 |
| 1000 | 1 x 10⁻⁵ |
Table 2. PSD breakpoints used for light bulb test.
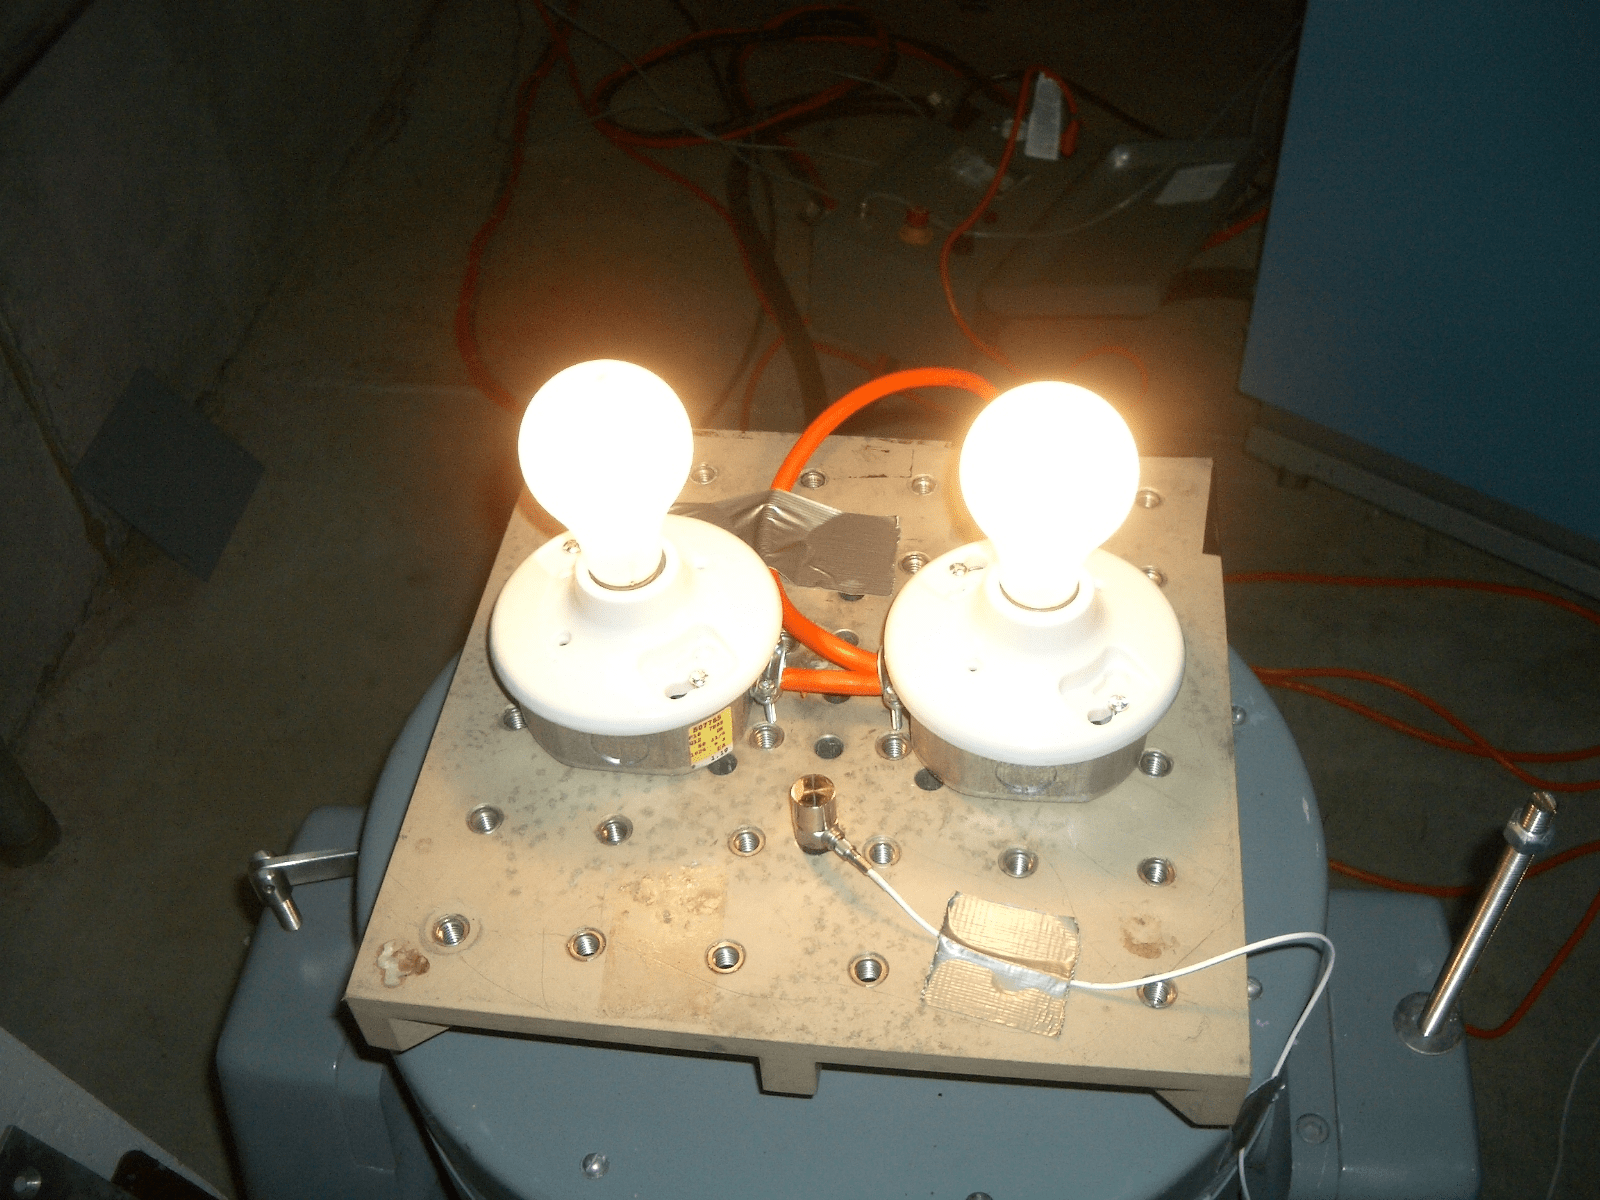
Figure 11. Setup for vibration testing of light bulbs with kurtosis.
Tests were performed on a total of 66 light bulbs, testing 22 bulbs each at kurtosis levels of 3, 5, and 7. While the vibration test was running, the current through the light bulbs was monitored and plotted on the display. As a light bulb began to fail, the current would increase somewhat. When complete filament failure occurred, the current would drop suddenly. The time to failure was measured as the time from the beginning of the test to the time of the sudden drop in current. Since two bulbs were tested simultaneously, the test was allowed to continue until both bulbs had failed, and then the time to failure was computed individually for each bulb. Sample screenshots from the controller software are shown in Figure 12. Note that the PSD was the same in all cases, while the higher kurtosis levels translated into higher acceleration peak levels and shorter time to failure. Thus, the simple light bulb test clearly demonstrates that a kurtosis control parameter is a significant addition to random vibration testing because while it maintained the same test specifications, it brought the light bulbs to failure sooner.
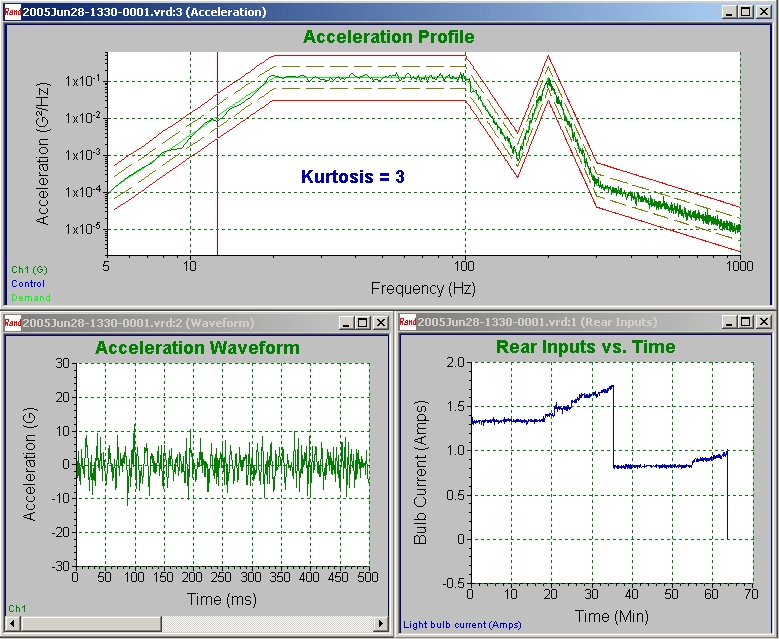
(a)
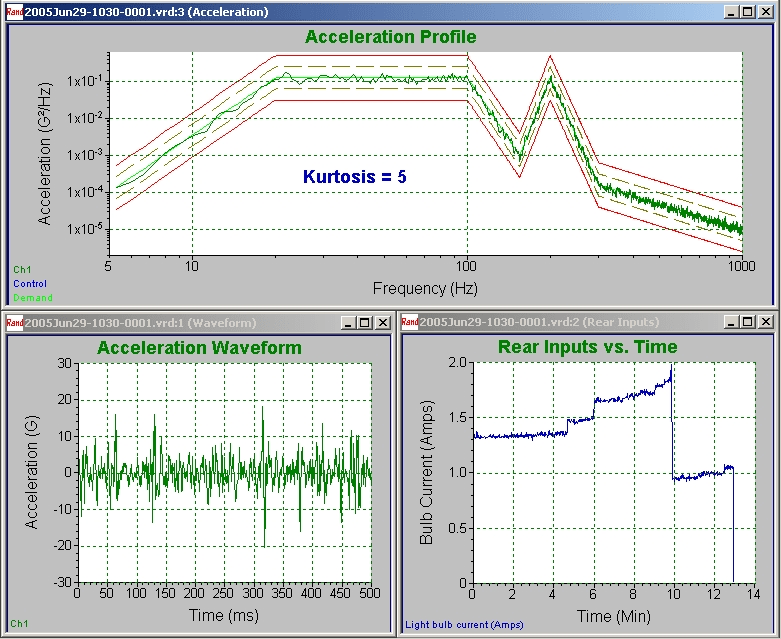
(b)
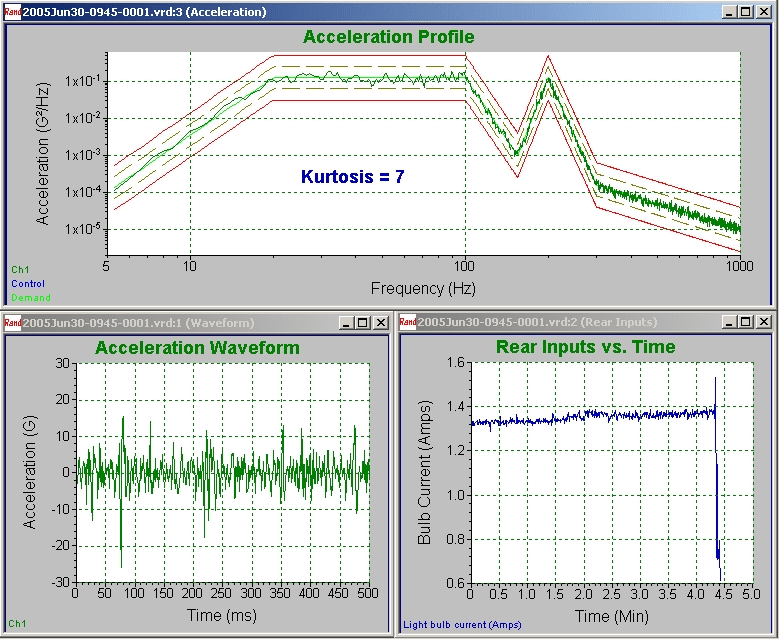
(c) Figure 12. Controller software screenshots of testing at a.) kurtosis = 3; b.) kurtosis = 5; and c.) kurtosis = 7. Note that higher kurtosis levels give the same PSD but result in higher acceleration peak levels and shorter time to failure.
The time to failure for all tests is shown in Figure 13.
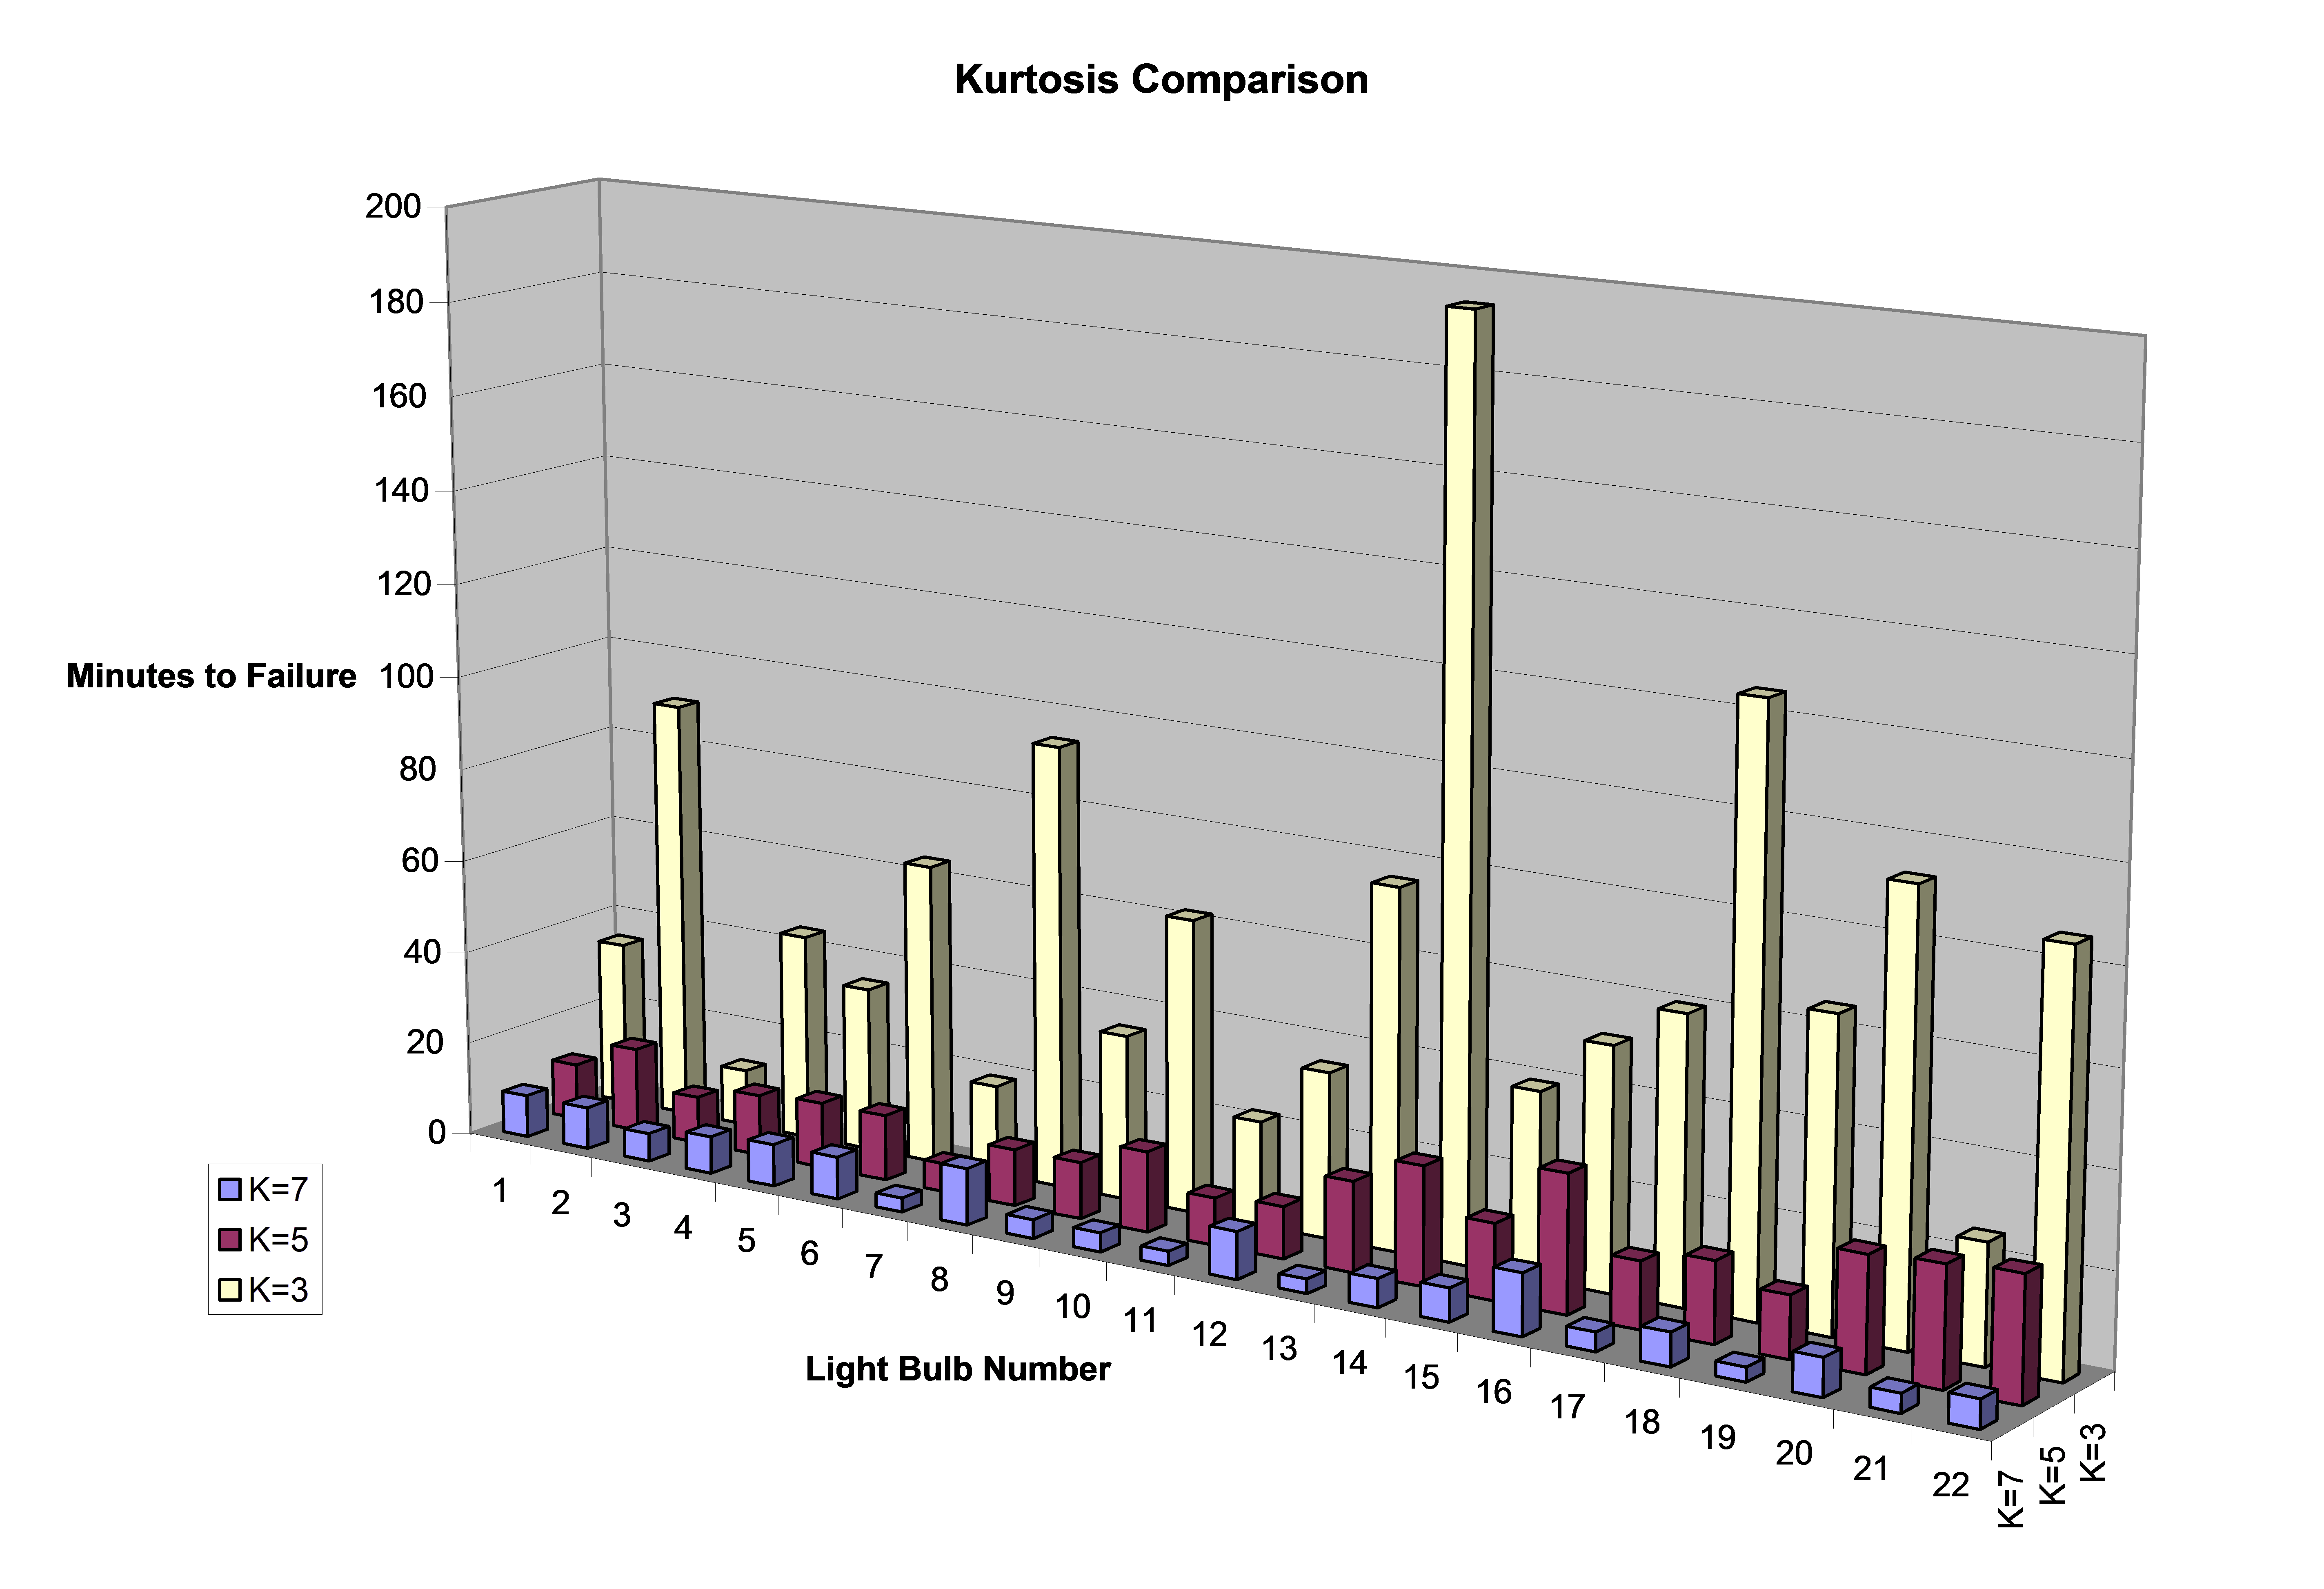
Figure 13. Time to failure of all light bulb tests.
This figure further shows that the time to failure decreased as the kurtosis level increased. Taking the average time to failure of the 22 tests at each kurtosis level, it becomes readily evident that the light bulbs are brought to failure significantly faster when the kurtosis is increased, from 62 minutes with kurtosis = 3, to 16 minutes with kurtosis = 5, to 6.7 minutes with kurtosis = 7 (Figure 14).
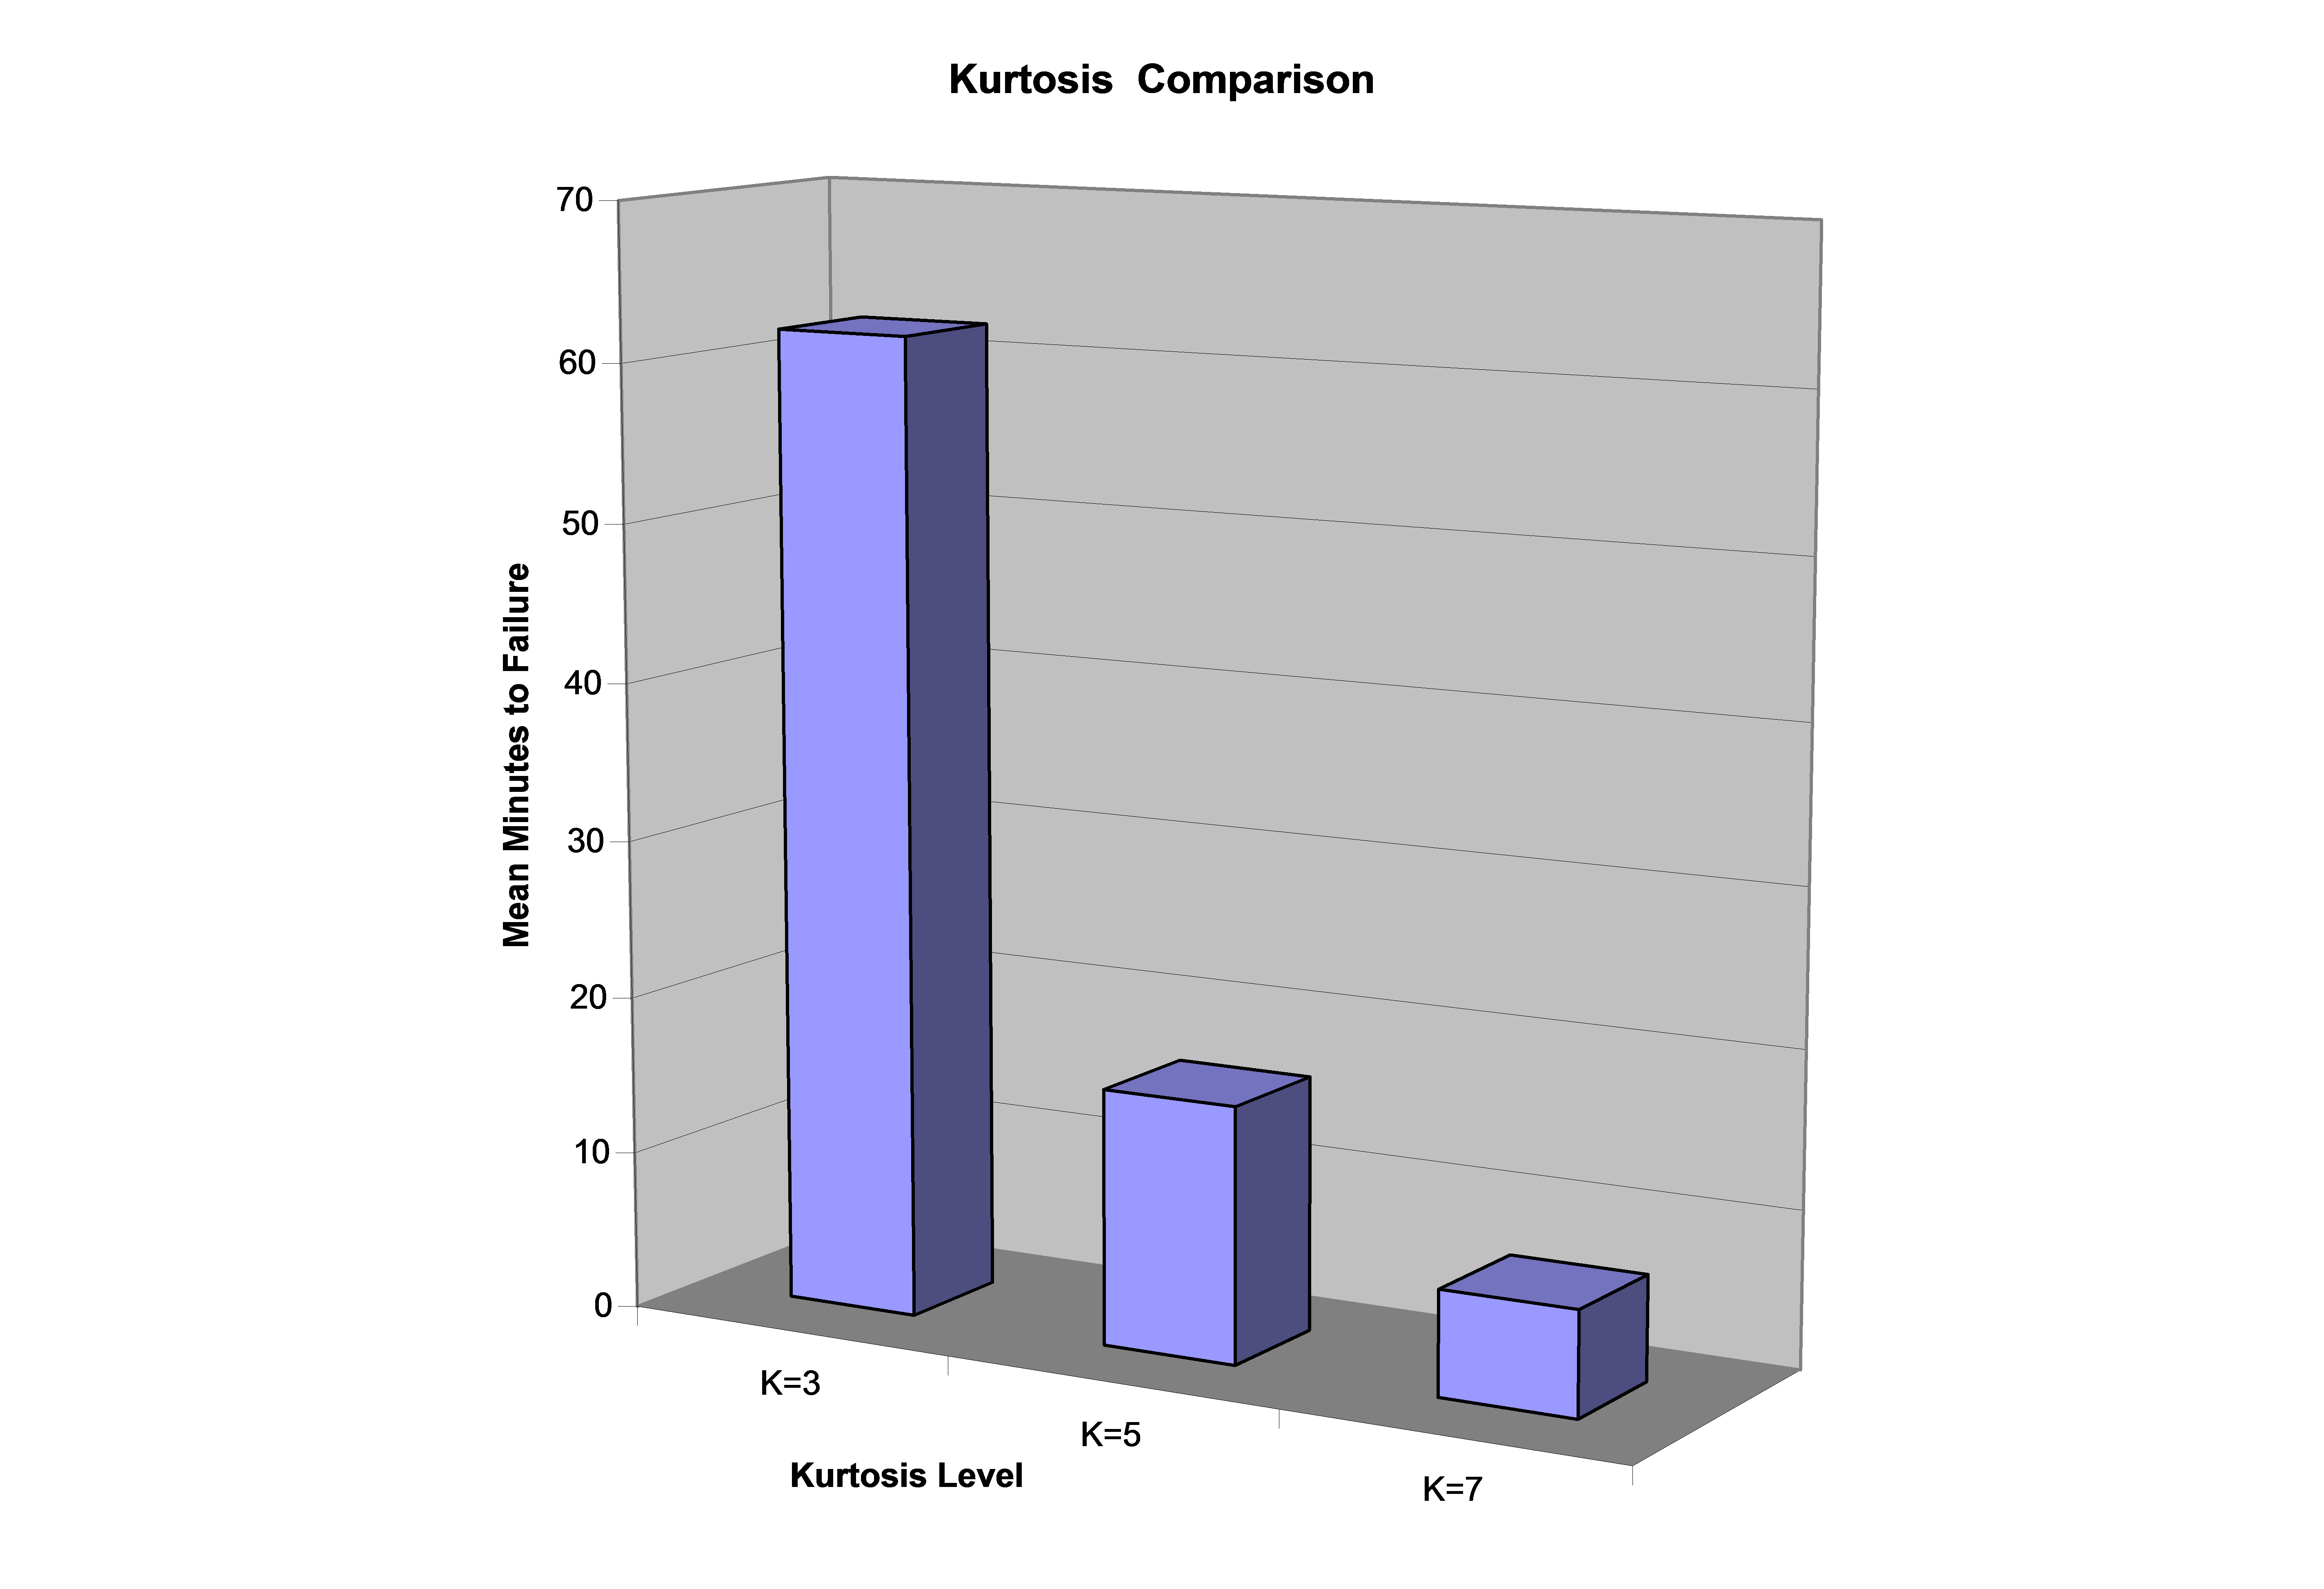
Figure 14. Mean minutes to light bulb failure.
The light bulb test performed here is a simple example, but it clearly illustrates the point. Decreased time to failure means that failure modes are more readily produced in lab testing with higher kurtosis levels. It also means that you are more likely to detect potential field failures if you include the kurtosis parameter when performing vibration testing. Now that kurtosis can be easily included in random vibration tests, manufacturers can perform similar case studies on their components to determine how kurtosis can help them in designing more reliable parts.
Conclusion
Kurtosis control is an exciting new development for random vibration testing. Engineers have sought out this realistic factor for a long time, even if they did not know about kurtosis. Before, there was no way to add this “peakiness” factor to a random test. Vibration Research has demonstrated a method for reproducing the field data’s PSD and RMS levels and kurtosis.
Kurtosion is a patented method that is easy to use. The kurtosis is easily measured from field data, and this measurement is the only additional information required for the method to be implemented. The method preserves all the important characteristics needed for random testing, such as PSD, RMS measurement, dynamic range, and uniform distribution of kurtosis over the spectrum. Testing and design engineers are now free to include the desired kurtosis in their random vibration test specifications to increase the realism of their tests, improve the likelihood of detecting failure mechanisms during testing, and therefore, increase the reliability of their designs. Random vibration testing has never been better.