I. Why Peak Tracking?
During a sine resonance track and dwell (SRTD) test, resonances shift as the material fatigues. The test frequency also needs to shift for the test to be valid. A test engineer needs insight into these shifts. Ideally, they should gather the details of multiple resonances during the initial sine sweep. Then, they can select a resonance for the sine dwell, confident that the frequency will stay on the resonance.
Phase Tracking
The traditional method to adjust SRTD testing for shifting resonance frequencies is phase tracking, implemented by the vibration test controller software. At the end of the sine sweep, the controller measures the phase difference between the control channel and the response channel at the resonance frequency. While the theoretical resonant peak of the response is 90° out of phase from the control, the actual phase difference will usually be close to, but not exactly, 90 degrees due to material imperfections, the mounting locations of accelerometers, and non-linear shaker motion.
After the initial sine sweep, phase tracking generates an output at the selected amplitude and frequency, presumably the frequency where the peak resonance occurred on the response channel. The test holds at the selected frequency until the resonant frequency of the response begins to shift due to material fatigue. The drive output’s frequency then shifts to maintain the original phase difference between the control and response sensors.
Phase tracking for SRTD testing offers an advantage over tests that do not adjust to resonance shifts. However, there are three limitations to the phase tracking methodology:
- Phase relationships measured during an initial sweep are imprecise.
- If a product has a non-linear amplitude response, a change in amplitude between the sine sweep and the sine dwell may result in a different resonant frequency and a different phase relationship.
- Fatigue may behave in a non-linear fashion, causing the phase difference at peak transmissibility to change as the effect of fatigue progresses.
Peak Tracking
Peak tracking is another method of adjusting to a resonance shift during the dwell portion of a sine test. This option allows the controller to adjust the output frequency and the phase difference between the two channels to maintain peak transmissibility.
Peak tracking minimizes the need for precise detection during the sine sweep so that users can sweep faster. More importantly, it ensures that peak transmissibility is maintained throughout the dwell portion of the test, even when phase relationships shift along with the resonance frequency.
To read an experimental comparison of tracking methods, please visit the paper on improving SRTD testing.
II. How Peak Tracking Works
Peak tracking constantly oscillates the phase difference between the control and the response channels, observing if the transmissibility increases or decreases. As more data are collected, the control algorithm learns the shape of the transmissibility graph and seeks the peak response. As the algorithm learns the transmissibility graph’s shape, the amount of phase change becomes narrower in frequency and slower in time, limiting the amount of oscillation while accurately tracking the peak.
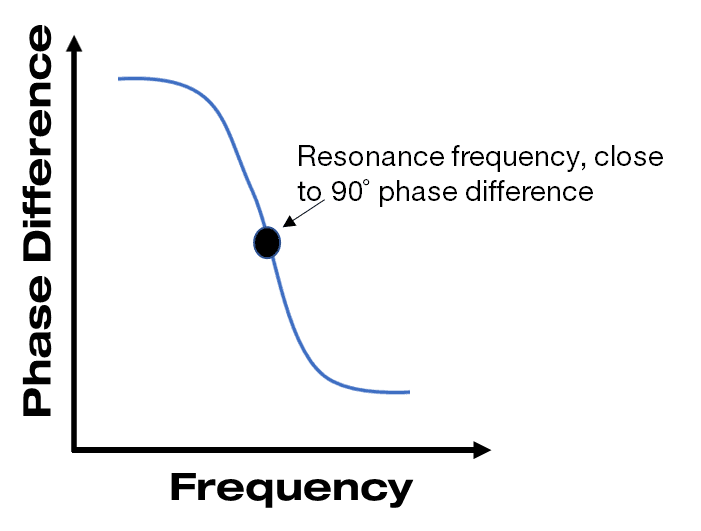
Figure 1. A 1-to-1 relationship at any point in time between the difference in frequency and phase.
There is a 1-to-1 relationship at any point in time between the difference in frequency and phase during a test. “The software is oscillating the phase” means it is using an algorithm that changes the frequency to achieve the desired phase change. For frequencies close to the resonant frequency, a minimal change leads to a significant change in the phase difference (Figure 1).
At the same time, the software tracks an increase or decrease in transmissibility to know if it is approaching the peak or moving away from it.
III. Peak Tracking Parameters in VibrationVIEW
Examining the controlling parameters in VibrationVIEW provides some insights into peak tracking. Figure 2 displays the Resonance tab of the Sine Test Parameters.
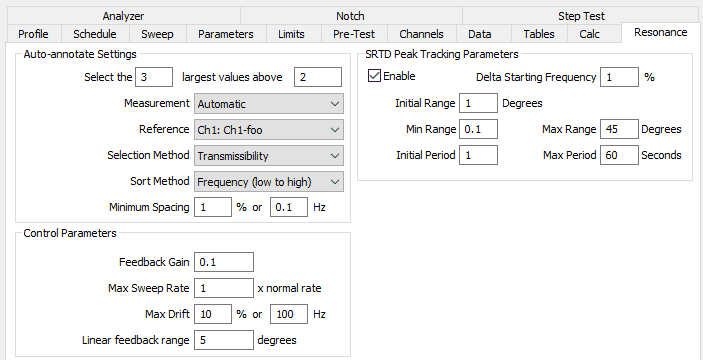
Figure 2. Peak Tracking parameters in VibrationVIEW.
The SRTD Peak Tracking Parameters are available after the user selects the Enable checkbox.
Peak Tracking Parameters
The Delta Starting Frequency parameter sets the frequency where the phase oscillations begin, defined as a percentage of the initially identified resonance frequency. For example, an initial target frequency of 1000 Hz with a 1% Delta Starting Frequency will start the oscillations at 1010 Hz. 0% won’t shift the frequency and a negative percentage will shift down. This shift will only occur when Peak Tracking Mode is enabled.
The Initial Range parameter sets the initial oscillation range in degrees for Peak Tracking mode. The algorithm controlling the test will try to reduce the sweep range from this Initial Range as it oscillates around the peak in transmissibility.
The Min Range parameter sets a lower limit on the phase oscillation range. The controlling algorithm will try to minimize the degree range of oscillation as much as possible until the estimation of the peak is affected too much by the noise in the transmissibility. However, the range in degrees that the Peak Tracking mode searches through will go no lower than the Min Range parameter.
The Max Range parameter sets an upper limit on the phase oscillation range. The range, in degrees that the Peak Tracking mode searches through, will go no higher than this parameter. If this parameter is set lower than the noise level, the phase will drift randomly. This value can normally be left at the default level.
The Initial Period parameter sets the initial time in seconds for a phase oscillation. This variable directly affects the amount of data the test collects between each calculation of the peak of the transmissibility. Longer periods will produce better estimates but will take longer to adjust to the peak. The oscillation will slow down when it begins to oscillate around the peak in transmissibility until it reaches the Max Period value.
The Max Period parameter sets the upper limit on the time for an oscillation. The oscillations will gradually slow down until they reach this value, then stay at this value for the remainder of the test.