Electric vehicles are gaining traction worldwide, and manufacturers are working quickly to respond to the demand. The automotive industry has made many advancements in this growing sector, particularly in battery electric vehicle (BEV) development. However, the internal combustion engine has defined the industry for decades, and there’s still much to learn about the noise and vibration environment of battery electric vehicles.
Noise, vibration, and harshness (NVH) testing of BEV is one of the areas still in the research/development stage. As the noise from the combustion engine is no more, engineers must address noise that was not an issue previously.
Currently, engineers are examining data on the acoustic behavior of the powertrain and other components, which includes new considerations to resonances and sound pressure level measurement in the operational environment. The industry is aware that wind noise has increased significantly and noise from the powertrain and ancillaries is more prominent.
The team at Vibration Research was interested in generating some comparisons of their own. They mounted sensors to an electric vehicle and ICE vehicle and drove them on the same route to gather acoustic and vibration data. The purpose was to gain a better understanding of the differences in NVH of the vehicle types. As the demand for EV increases, VR wants to have the right testing tools for the new scenarios our customers will likely encounter.
Test Setup
The test engineers compared a Tesla Model 3 and a 2016 BMW 340i xDrive. Vibration Research’s ObserVR1000 functioned as the data recorder for both road tests.
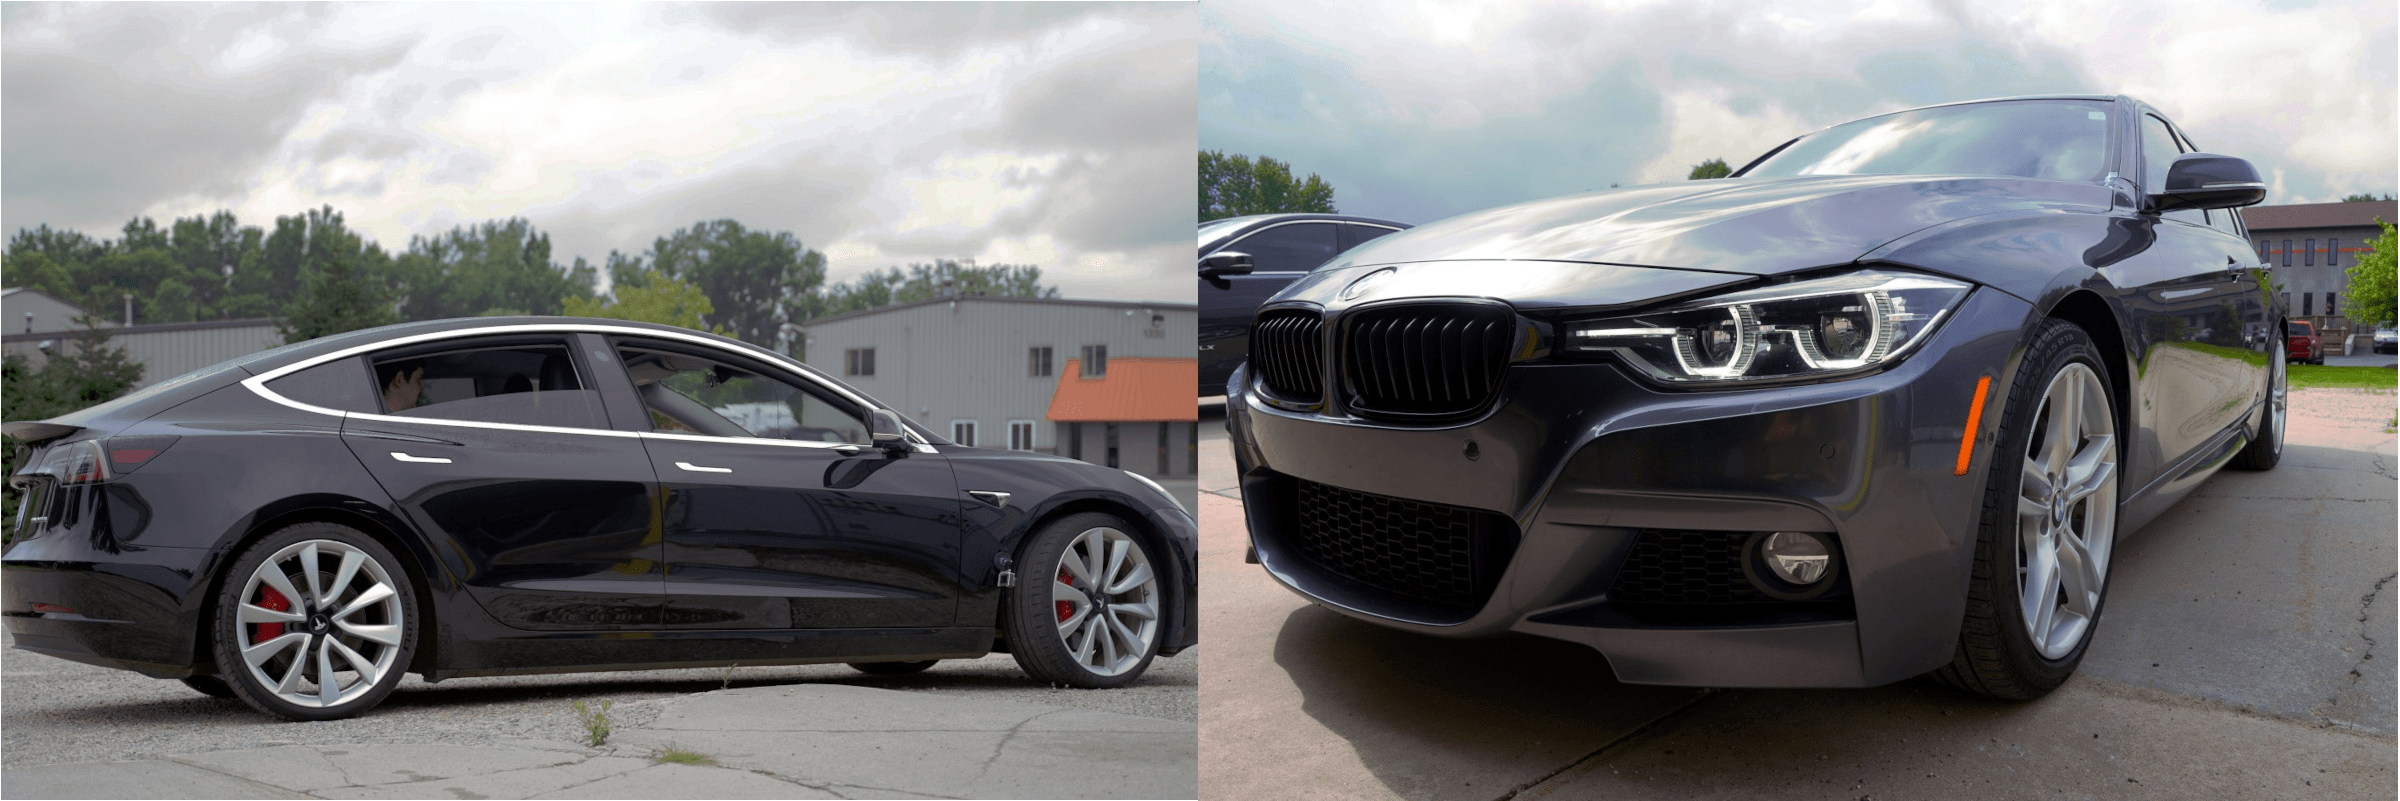
The Tesla (left) and BMW (right) vehicles.
Sensor Mounting Points
Triaxial accelerometers were mounted to the inside rear-view mirror, windshield, and strut tower on the front driver’s side. The engineers selected these locations because they are consistent between the vehicles and experience measurable vibration in the operational environment. The vibration of the rear-view mirror impacts customer experience, and the response of all three locations has implications for safety and product longevity.
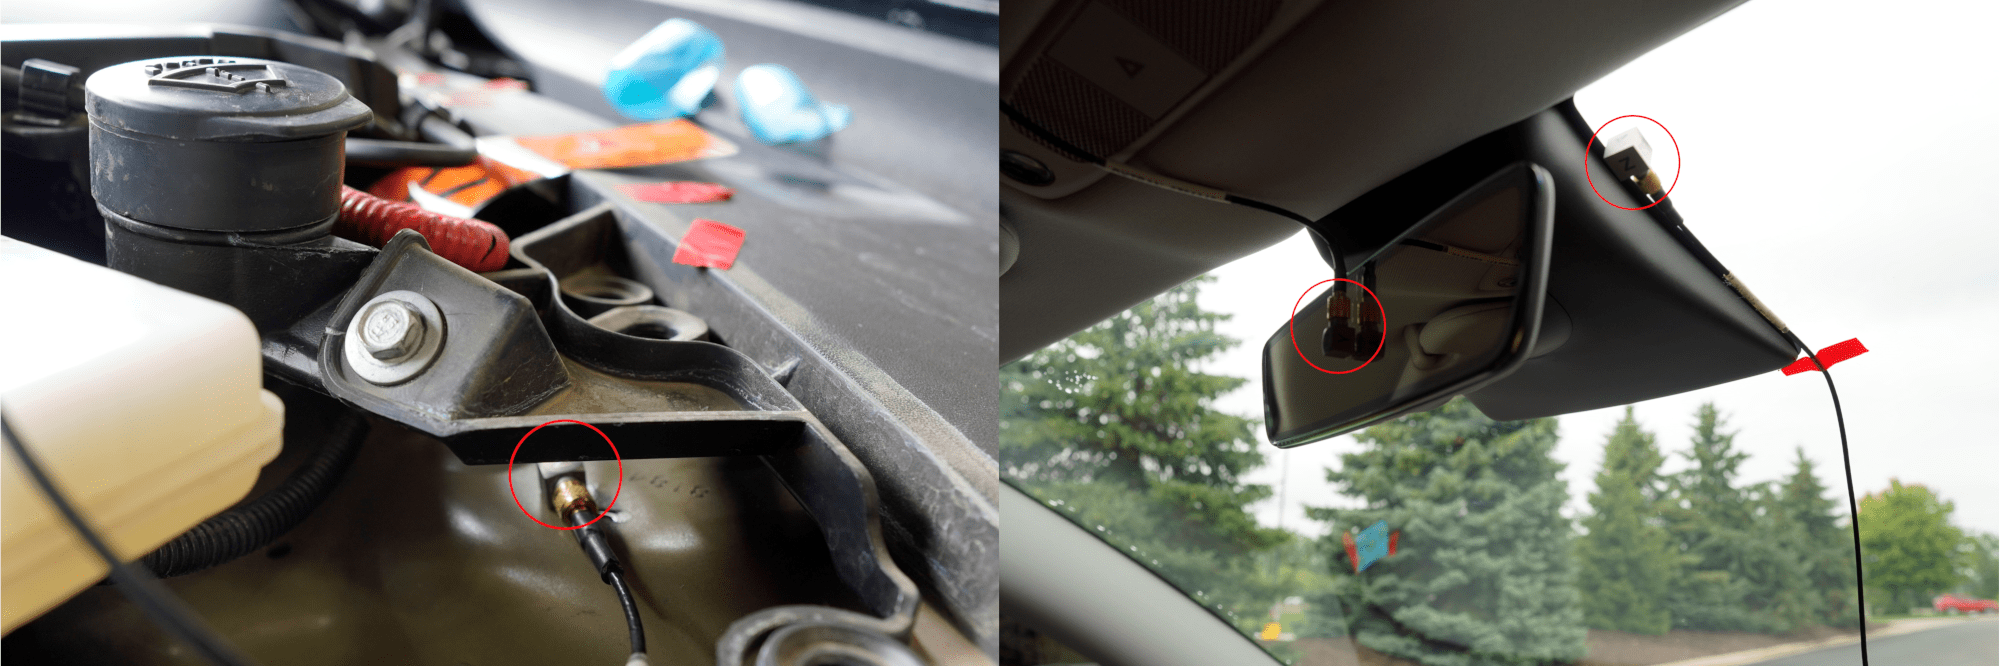
Sensor placement in the Tesla on the strut tower (left), rear-view mirror, and windshield (right).
Sensor Configurations
Prior to the test drives, triaxial sensors were glued to the components’ surfaces, and the sensor configurations, including serial number, sensitivity, and orientation, were recorded. Adjustments were made as necessary. For example, the engineers swapped the Z and Y-axes of the sensor on the rear-view mirror through the VR Mobile App to account for the sensor’s orientation on the mirror.
Additionally, data from the sensors were analyzed to ensure that there was no issue with a sensor or a cable; that is, the engineers confirmed that the data seemed reasonable.
A problem was identified before the Tesla test drive. Initially, the engineers wanted to collect vibration data off the 12V battery at the front of the vehicle. When they mounted an accelerometer to the 12V battery bracket, the engineers noticed a significant amount of noise on the sensor compared to the others. The engineers tried to remedy the situation by systematically replacing the accelerometer, cable, and ObserVR1000. No changes remedied the situation.
The engineers hypothesize that the noise was electrical noise from the battery. When engineers placed the sensor on the strut tower instead, the undesired noise disappeared.
Careful recording of sensor configurations and a pre-test examination of the data is critical to ensure that the data collected will be meaningful.
Media
Additional media was gathered to use with the ObserVIEW software’s Multimedia Sync feature. Two microphones were mounted to the left and right of the driver’s seat headrest, and the driver wore a headset to record events on an audio channel.
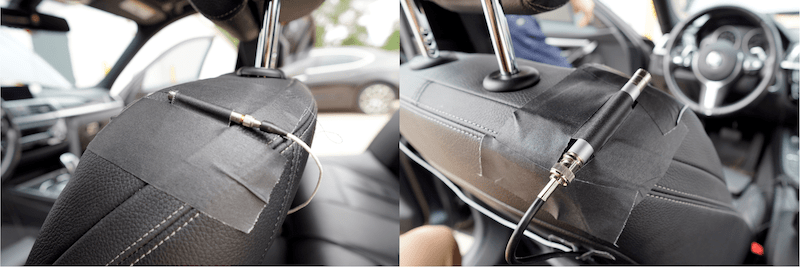
Microphone placement in the BMW.
A GoPro video recorder was mounted behind the front wheel on the passenger’s side. The Tesla model also has built-in cameras on the front, back, and sides, and video was gathered from those recordings. A Garmin GPS was also connected to the data acquisition hardware.
Video, audio, and GPS can help test engineers identify transient events that occur during testing. Media can give more context to events such as an acceleration spike or a repetitive moment.
Running the Tests
Road Types & Conditions
A circuit was pre-planned to ensure that a variety of road surfaces were traversed, and the data were collected at different speeds.
Most of the road surfaces were dry asphalt with sections of concrete. Some of the roads were recently repaved and relatively smooth. Others were rather old and damaged with many cracks and potholes. Some were 45 mph residential roads, and others were 70 mph highway roads.
Results
The team predicted differences in the response of a vehicle with an ICE and an EV to the same excitations, as an internal combustion engine is known to produce higher vibration levels and noise than a lithium-ion battery. While there were measurable differences, similarities between the vehicles were more common than anticipated. Several characteristics of the EV call for additional testing.
Startup Levels
The Tesla appeared to be significantly quieter at startup, a fact that was later reinforced by octave graphs (Figure 1). This finding is not necessarily surprising, as the lithium-ion battery is composed of electrical components and does not require ignition. The difference in the sound pressure levels (SPL) between the vehicles is 5.867 dBA (10.426%) on the left and 17.926 dBA (35.960%) on the right.
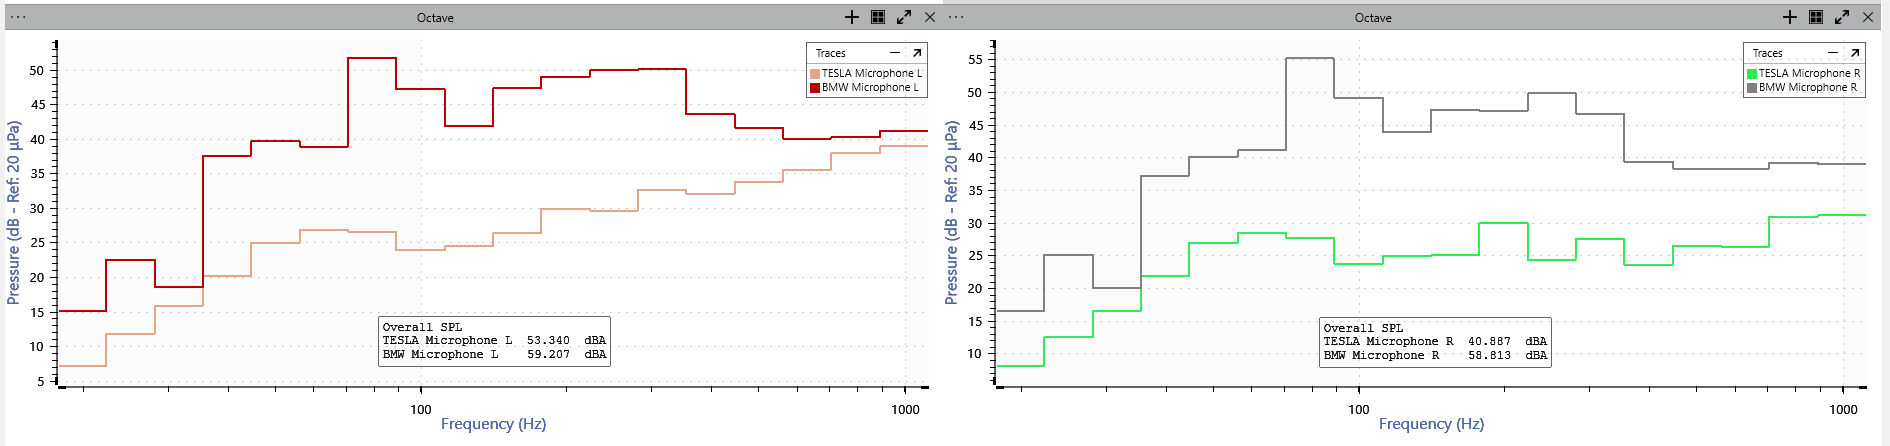
Figure 1. Vehicle recordings at startup.
| Vehicle | Overall SPL Left (dBA) | Overall SPL Right (dBA) |
| BMW | 59.207 | 58.813 |
| Tesla | 53.340 | 40.887 |
Acceleration Peak (Tesla)
The Tesla windshield Z-axis displayed a hashiness in the time waveform (also true for the X and Y-axes). The peak frequency was about 100 to 110Hz, which the engineers calculated by measuring the time difference between the peaks and finding the inverse. The engineers could hear what sounded like the AC fans powering on around this time in the audio. They conjectured that when the AC unit was powered on, its frequency may have resonated with the windshield.
Other Notes
- The dB levels of both audio recordings began to converge around 800Hz and greater.
- The large dB level in the 80Hz octave bin (BMW) corresponded with a windshield Z-axis resonance at 80Hz.
- The Tesla strut had greater acceleration levels in the PSD than the BMW, although the interior noise was louder in the BMW (Figure 2). The engineers had anticipated that the engine noise would generate more vibration on the BMW strut.
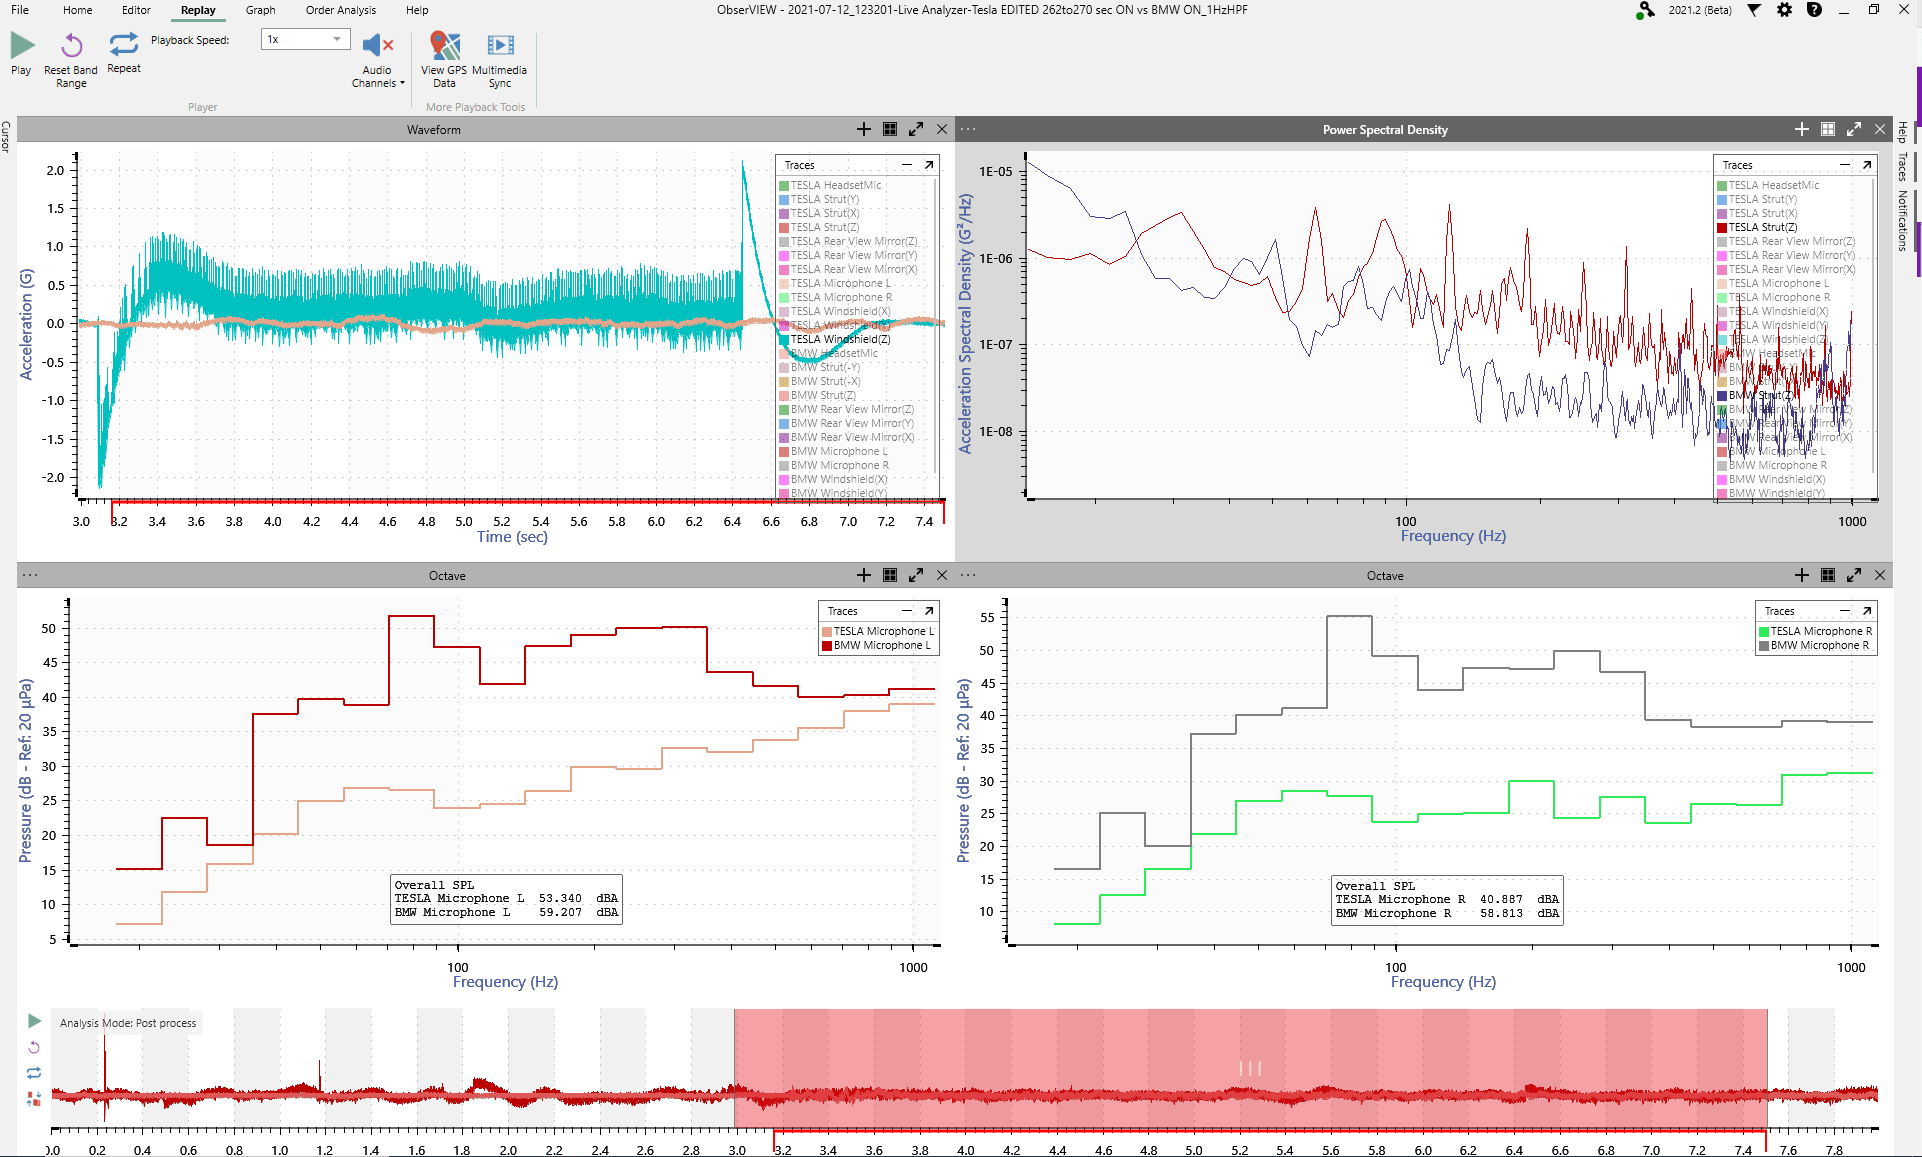
Figure 2. Vehicle recordings: vehicle ON and stationary.
- The BMW rear-view mirror displayed a steady resonance at 60-70Hz (Figure 3). Vibration diagnostics of rear-view mirrors often detect resonance around this frequency.
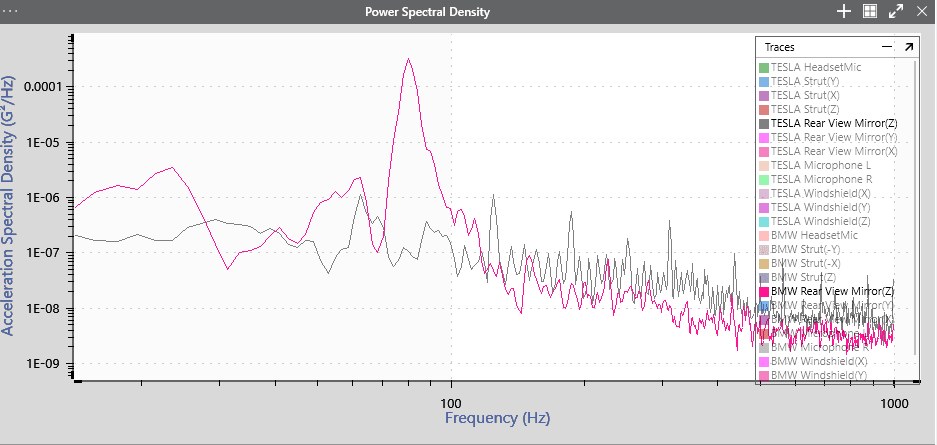
Figure 3. PSD of the rear-view mirror (Z-axis): vehicle ON and stationary.
Background Noise
The test engineers compared the background noise of each vehicle powered on and off.
Tesla
The Tesla powered on produced more noise than when powered off. The difference in dB was slight in the left microphone but about 5dB in the right (Figure 4). However, the dB profiles were nearly identical when the vehicle was on versus when it was off. The levels ramped up from a low frequency to 100Hz and greater.
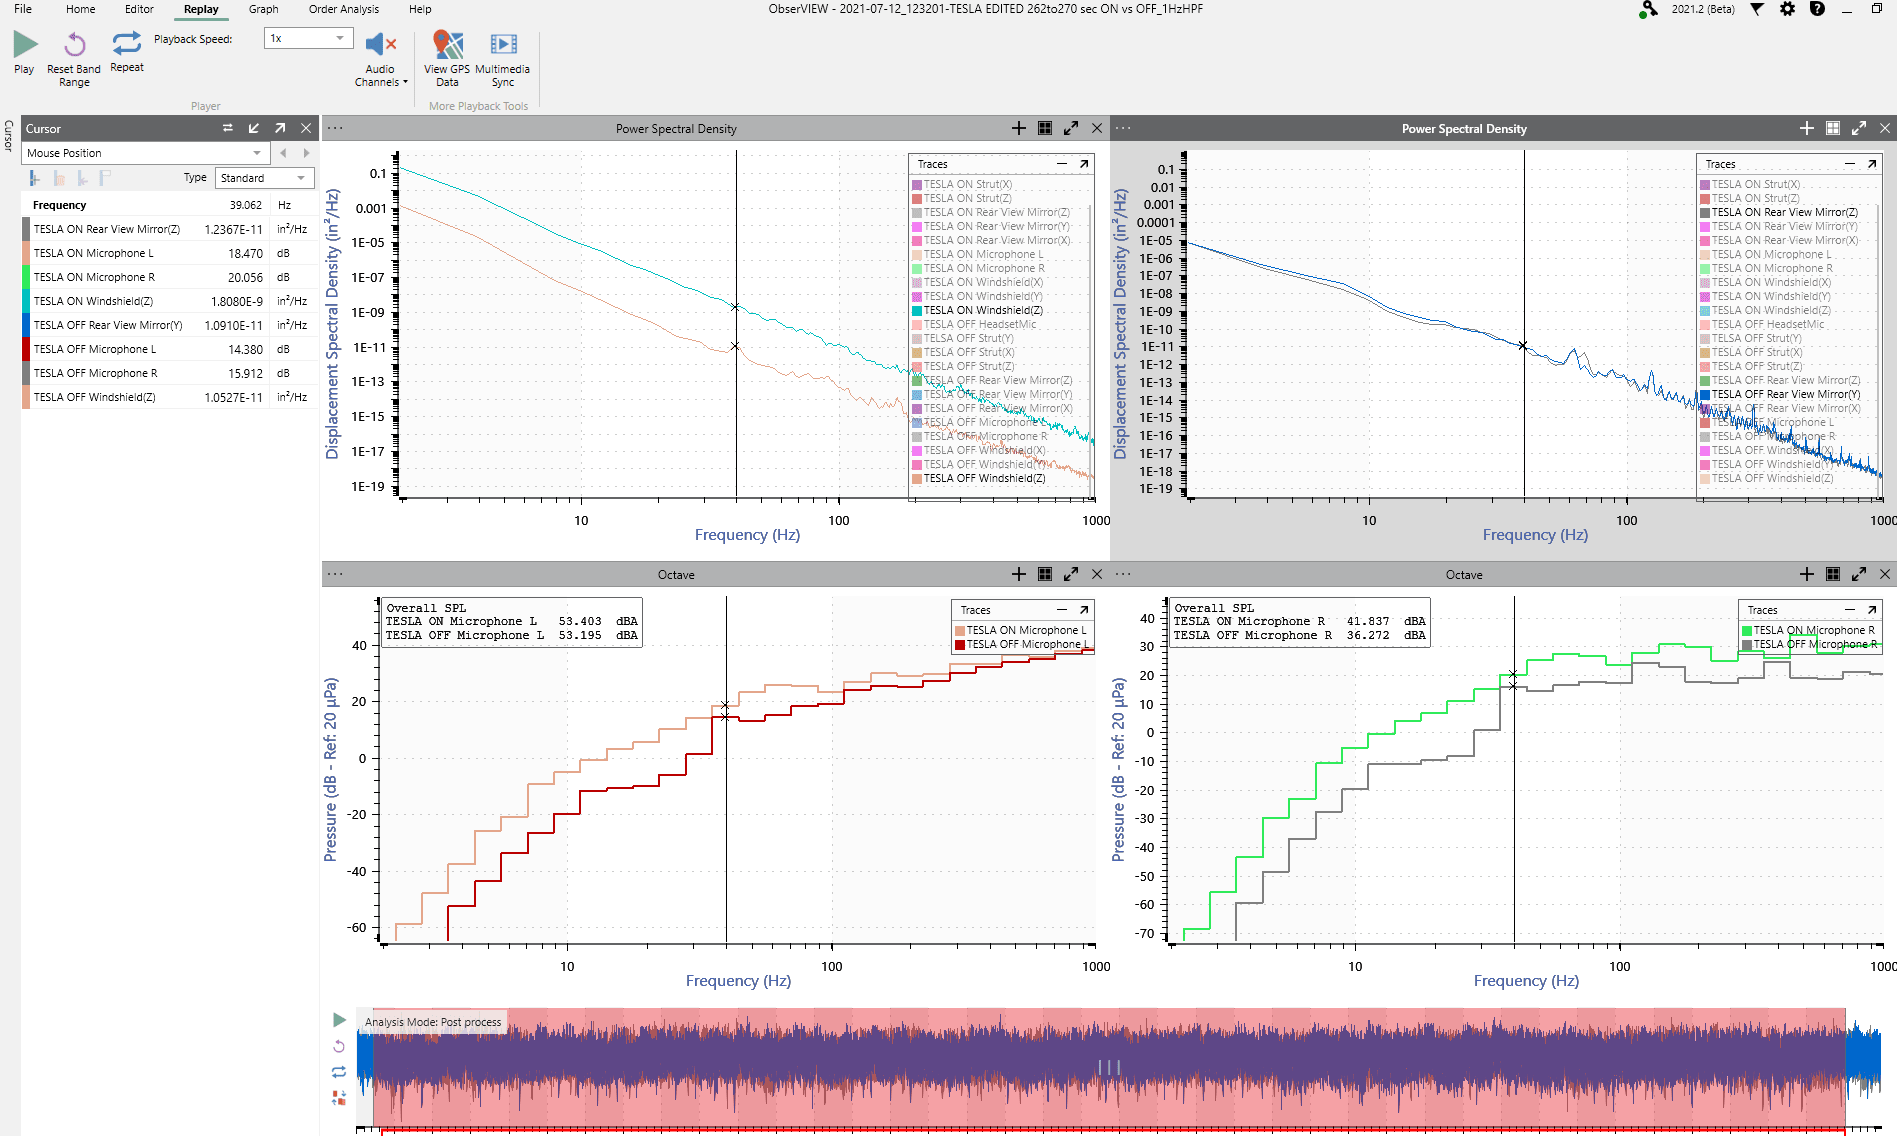
Figure 4. Vehicle recording: Tesla ON and Tesla OFF.
The rear-view mirrors and strut did not show any significant difference in displacement/acceleration across the frequency spectrum. However, the windshield showed a significant increase when the Tesla was on versus off. At about 39Hz, the PSD of the windshield vehicle off was 1.0527E-11 in^2/Hz and the PSD of the windshield vehicle on was 1.8080E-9 in^2/Hz.
This data also supported the hypothesis that the AC unit was resonating with the windshield. However, more testing is needed to determine if the vibration is due to fan motor vibration or some other ancillary part.
BMW
Compared to the Tesla, the difference in dB when the BMW was on versus off was significant. The difference was 3dB in the left microphone and 15dB in the right (Figure 5).
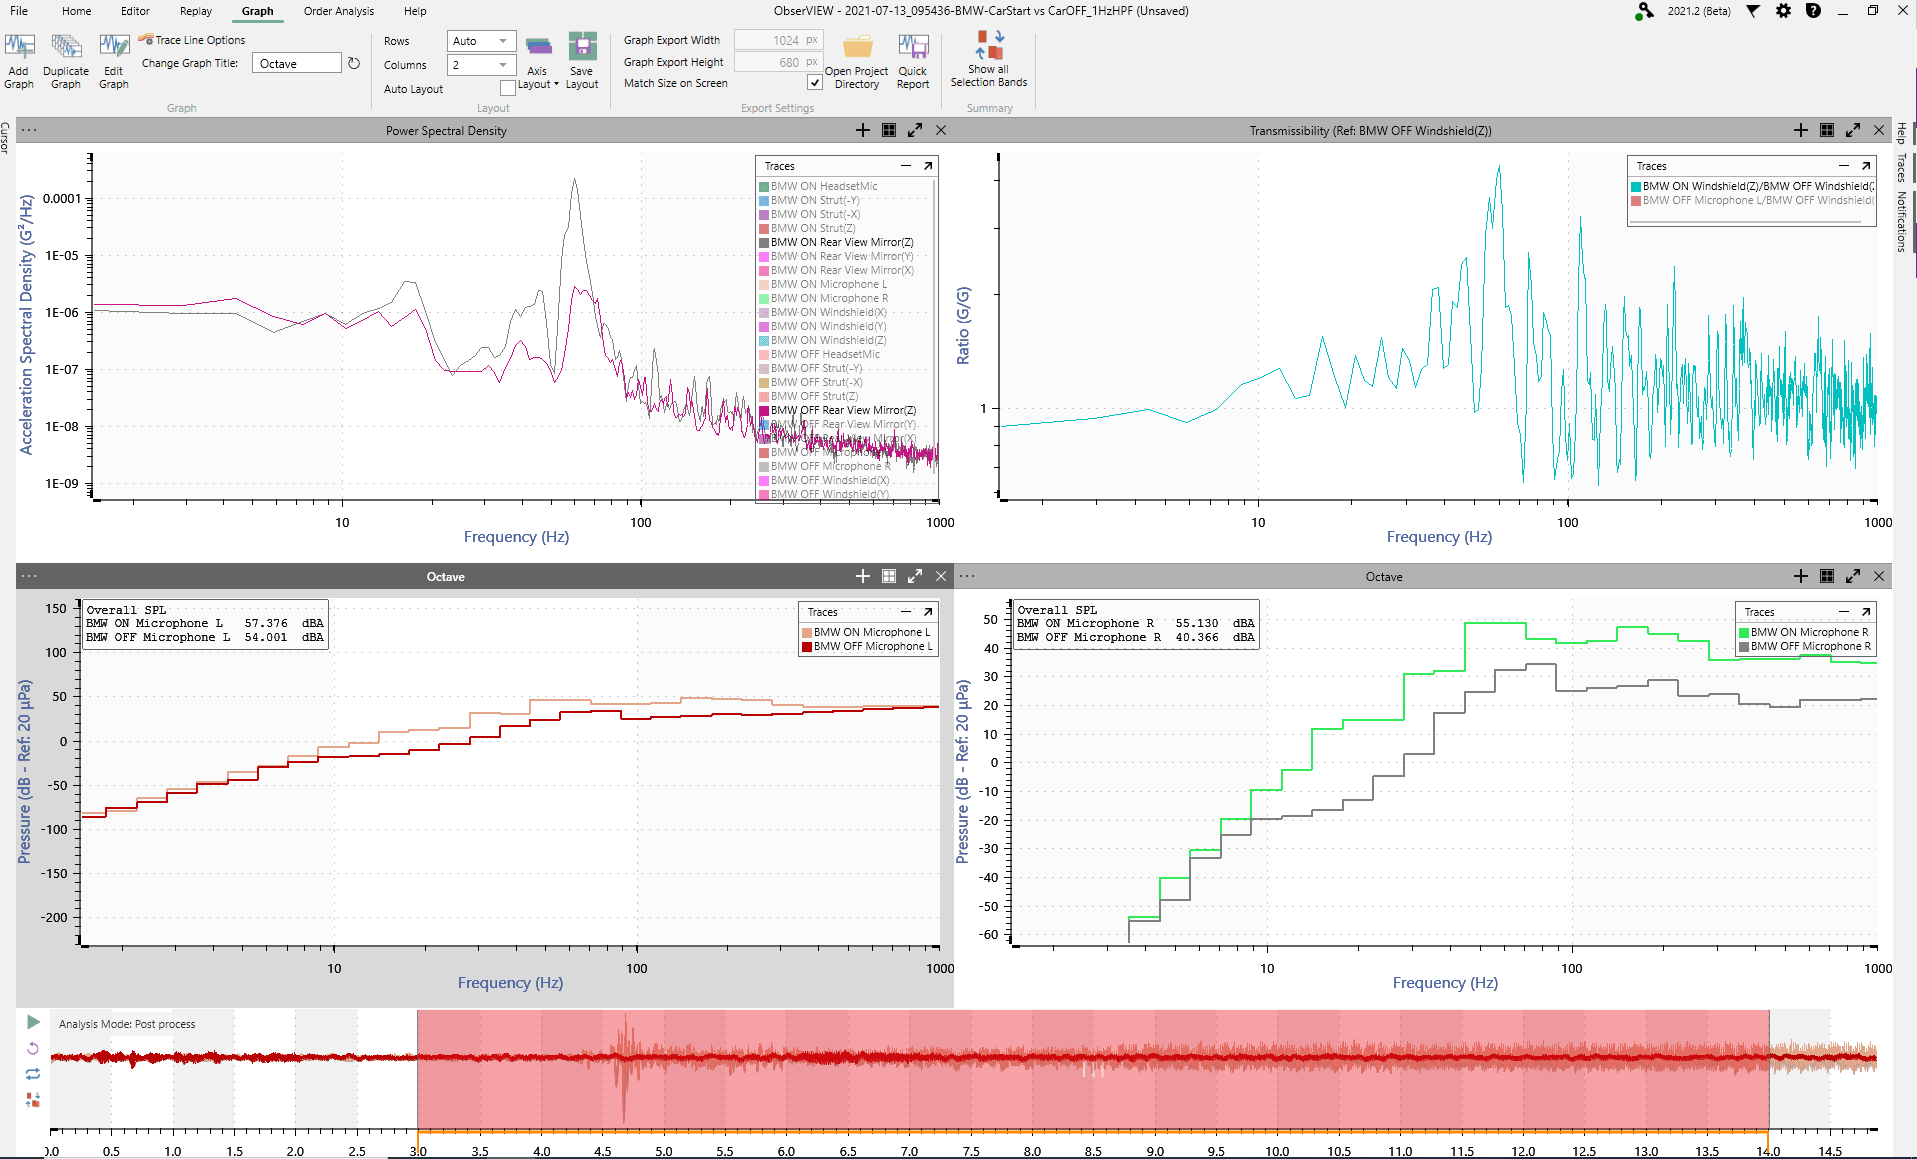
Figure 5. Vehicle recording: BMW ON and BMW OFF.
Other Notes
- The 60Hz rear-view mirror resonance was apparent on the PSD.
- Across the frequency spectrum, the transmissibility graph displayed significant vibration when comparing the signals for vehicle ON versus vehicle OFF.
Road Surface
On a smooth road surface, the Tesla displayed louder interior noise by 3.5dBA, but the frequency content of the audio in both vehicles was similar (Figure 6). The Tesla’s rear-view mirror (Z-axis) had a higher acceleration (and displacement) and greater fatigue damage across the frequency range starting at 30Hz.
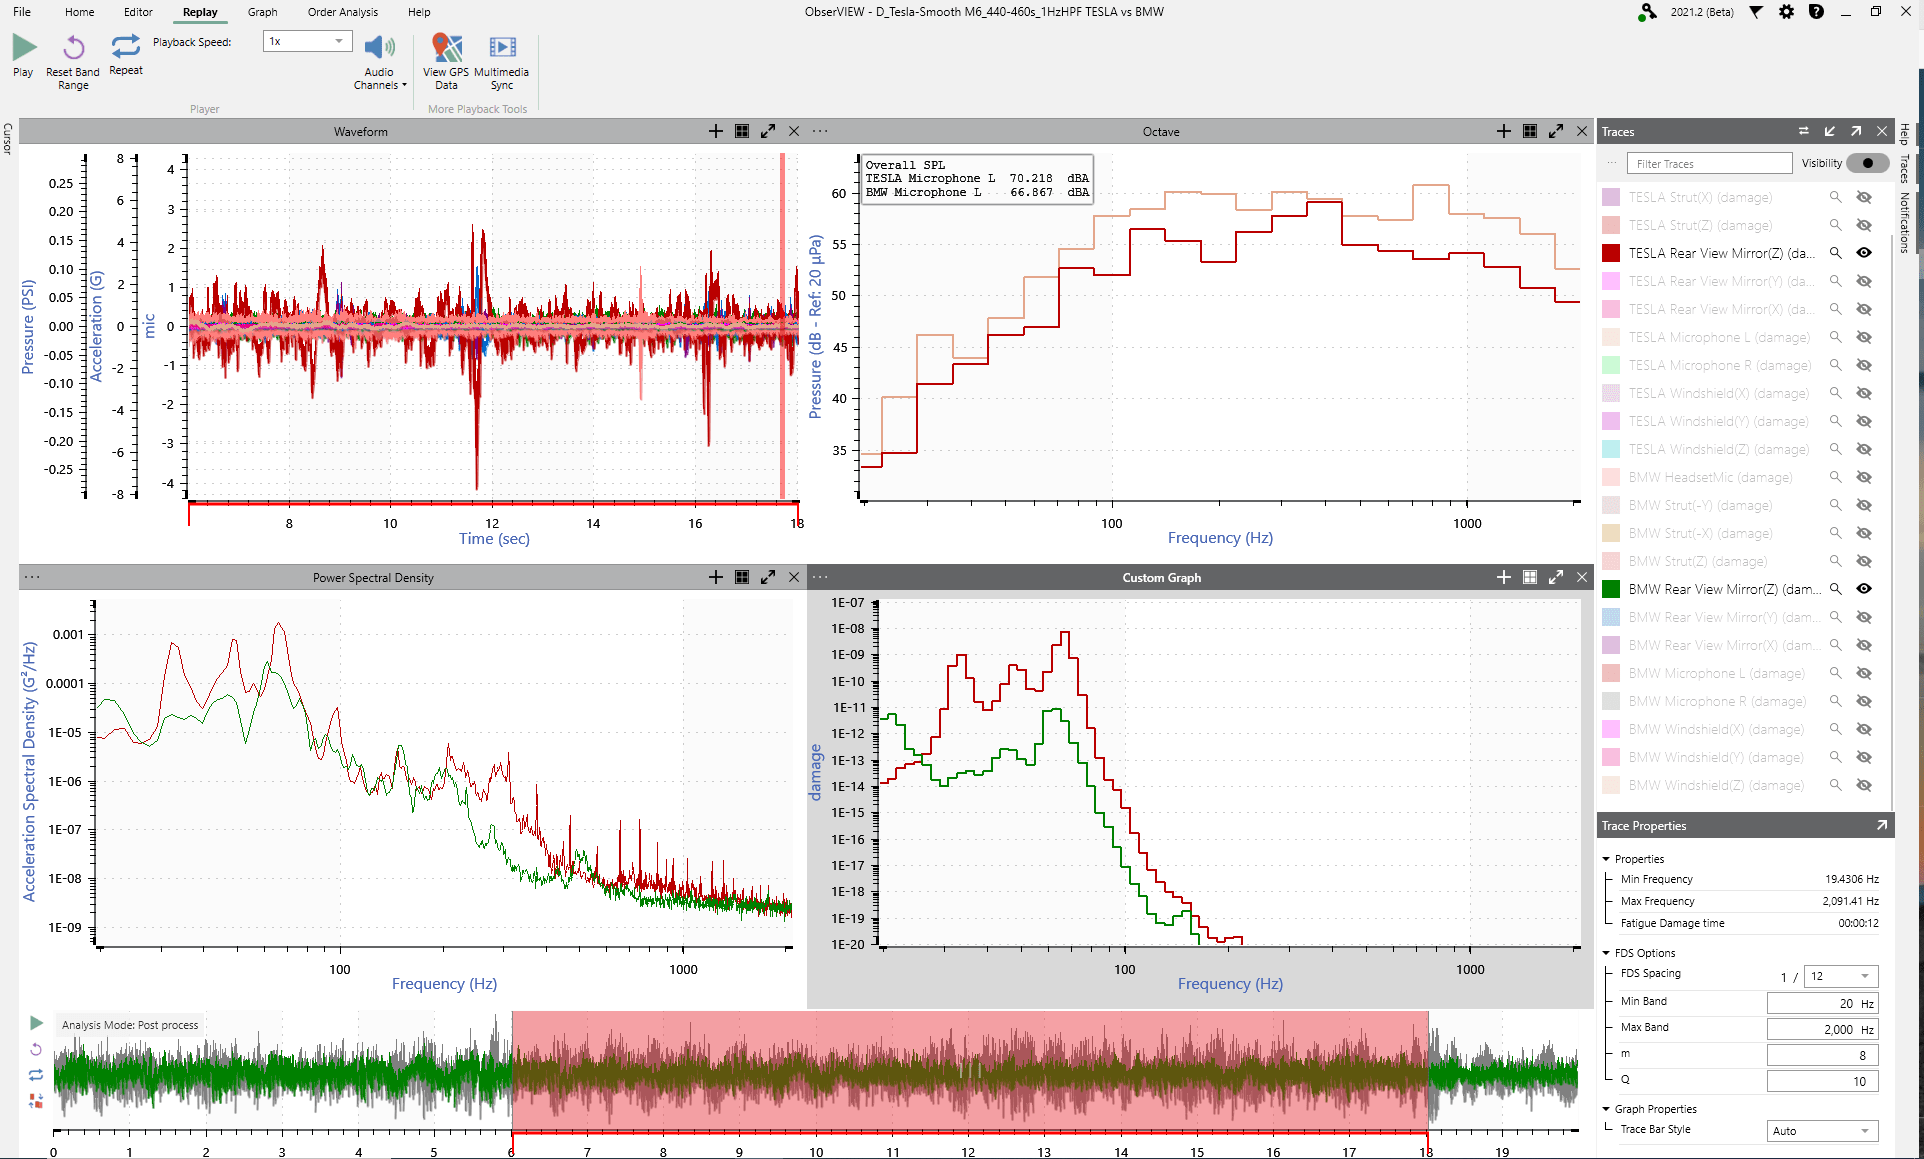
Figure 6. Signal comparison on a smooth road surface.
On a rough road surface at around 70mph:
- The Tesla strut (Z-axis) had more displacement than the BMW strut (Z-axis) (Figure 7). The Tesla strut also had significantly higher accumulated fatigue damage.
- The interior noise of the Tesla was 2dBA greater than the BMW.
- The Tesla’s rear-view mirror displayed a resonance at 67Hz compared to the windshield vibration.
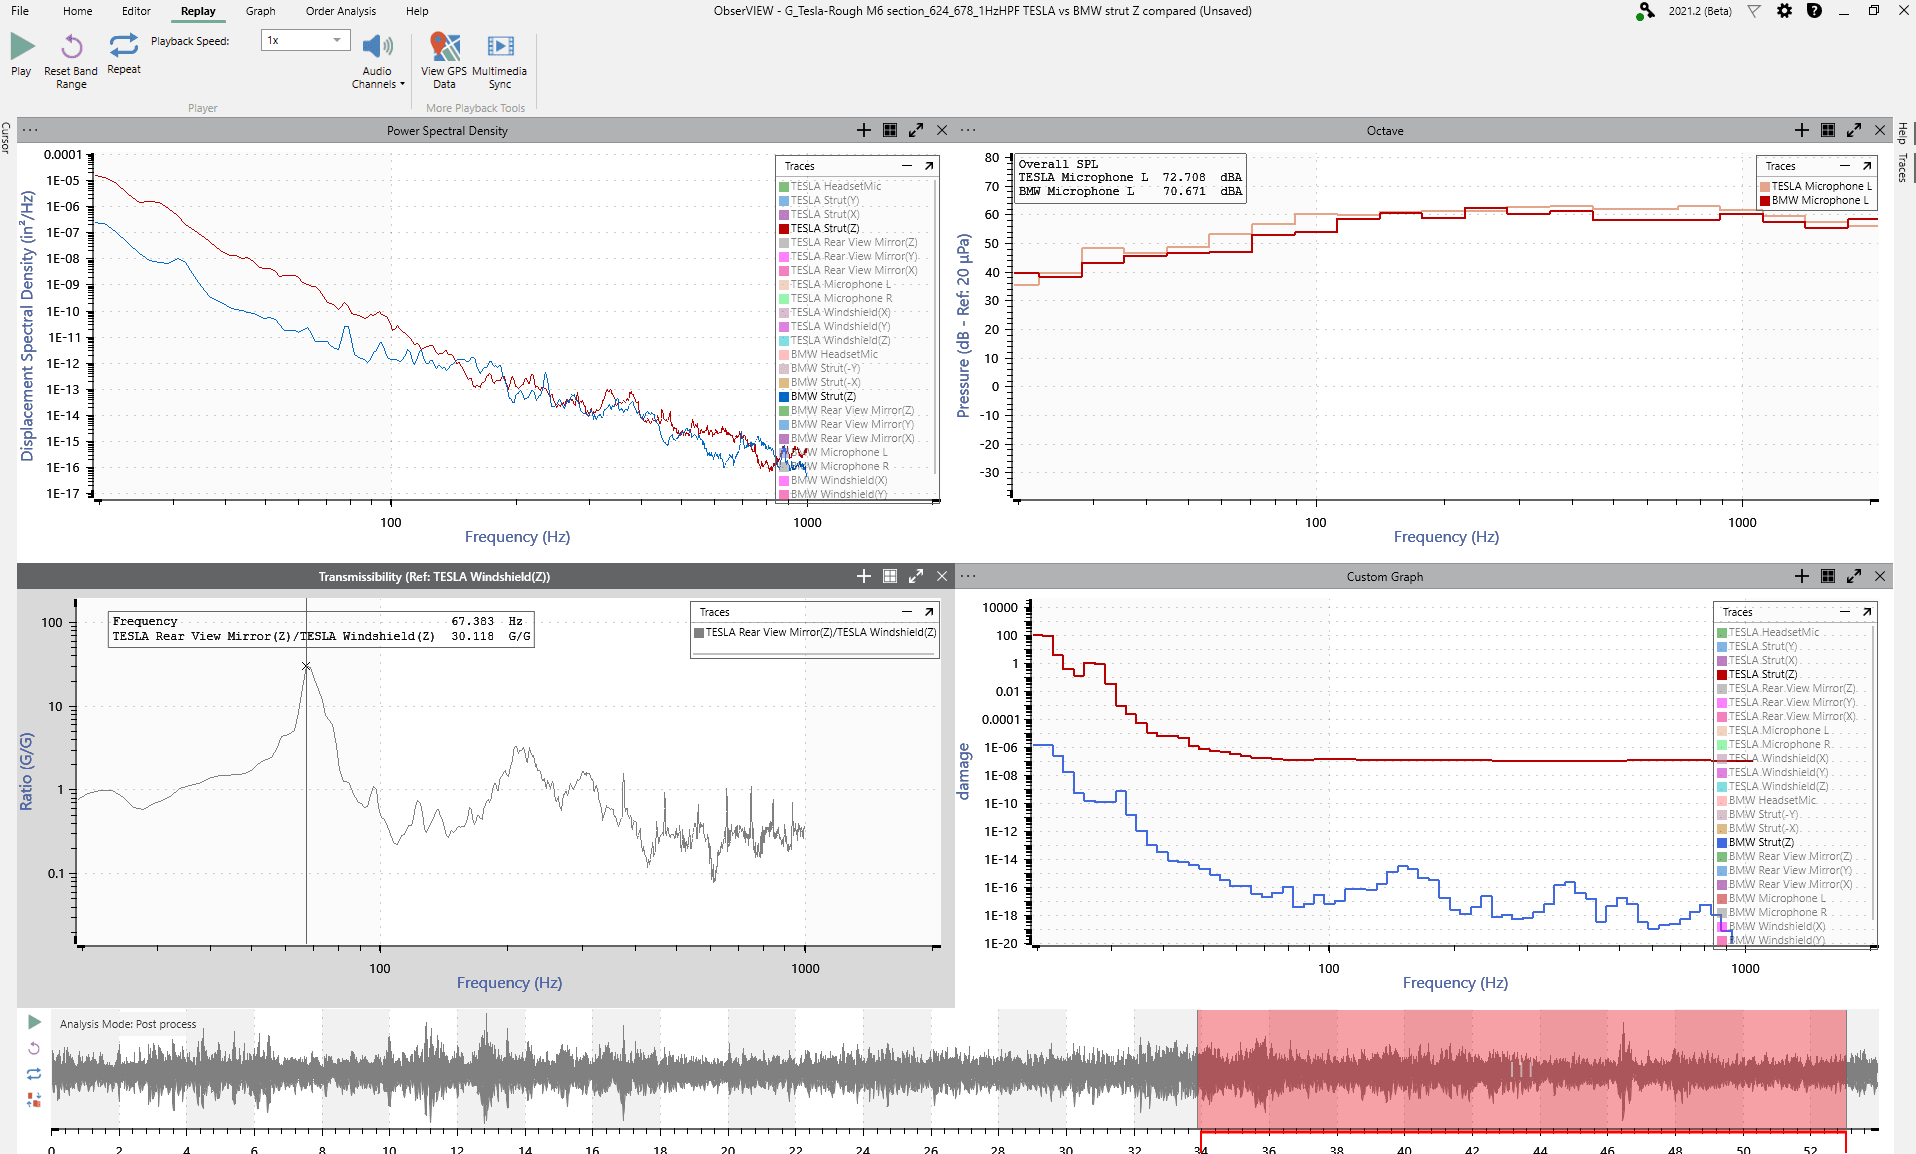
Figure 7. Signal comparison on a rough road surface at around 70mph.
On a rough road surface around 45mph (Figure 8):
- There was no difference in interior noise.
- The Tesla strut (Z-axis) displayed a greater displacement than the BMW strut (Z-axis).
- The windshields (Z-axis) for both vehicles had the same displacement (acceleration).
- Both vehicles displayed a similar fatigue damage spectrum with a slight shift in resonance.
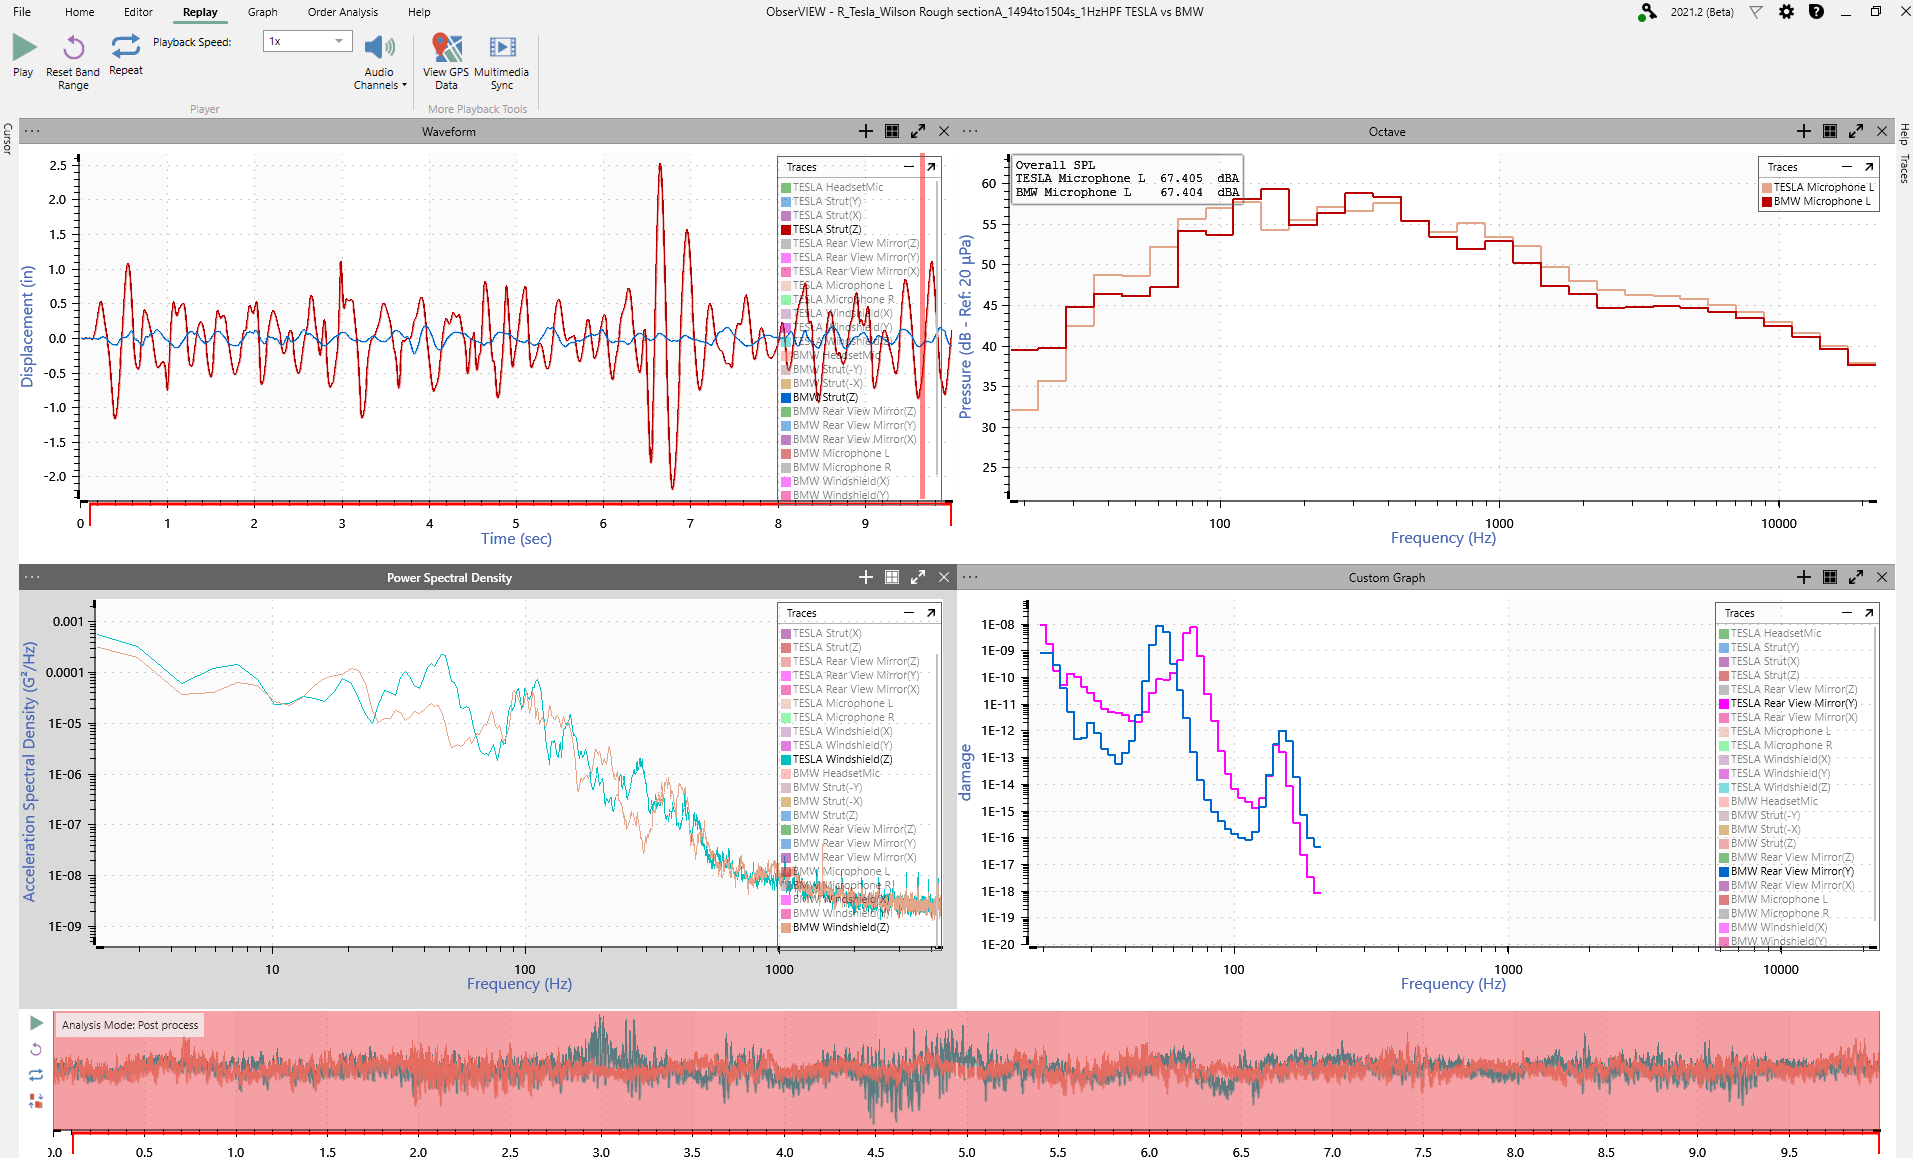
Figure 8. Signal comparison on a rough road surface at around 45mph.
Both sections of the rough road surface showed that the Tesla strut did not absorb vibration as well as the BMW, but the other components had comparable vibrations.
Mirror Resonance
The test engineers compared the mirror resonance of each vehicle during the test drive using a transmissibility graph. The Tesla had a 65.9Hz resonance and 11.1 G/G transmissibility, and the BMW had a 61.5Hz resonance and 7.7 G/G transmissibility (Figure 9).

Figure 9. Transmissibility graphs for rear-view mirror/windshield comparison.
| Vehicle | Resonance (Hz) | Transmissibility (G/G) |
| BMW | 61.5 | 7.7 |
| Tesla | 65.9 | 11.1 |
The vehicles’ mirrors are not the same and may have been mounted differently. Although it appears the vibration from the road impacts the mirrors of the TESLA more than the BMW, there is not enough evidence to conclude such.
Conclusion
These data recordings offer our team a preliminary insight into the noise and vibration testing of electric vehicles. The engineers found the following items of note:
Windshield Vibration – Tesla
At startup, the Tesla windshield Z-axis displayed a hashiness in the time waveform with a peak frequency around 100 to 110Hz. Additionally, the acceleration of the windshield’s vibration was much greater when the vehicle was stationary with the battery running compared to when it was off. More testing is needed to determine the repeatability of this occurrence and its potential causes.
Strut Vibration – Tesla
At startup, the Tesla strut had a higher acceleration in the PSD than the BMW. On a rough road surface at both 45mph and 70mph, the displacement of the Tesla strut was also higher than the BMW strut, and the Tesla strut had significantly higher accumulated fatigue damage at 70mph. More testing would determine if this discrepancy was limited to this specific vehicle, consistent for all Tesla Model 3 vehicles, or an issue for all EV.
The Future of EV Vibration Testing
In automotive testing, manufacturers must account for many factors, including:
- Road noise and vibration
- Wind noise and vibration
- Windshield resonance
- Radio/interior vehicle noise
- Varying motor speeds
- Infrastructure conditions
- Powertrain noise
The increased presence of battery electric vehicles will alter the way engineers approach vibration testing. We anticipate that new testing standards and methods will emerge in the next decade following innovations in manufacturing. The expanding market will offer many opportunities for research and development in the field of vibration testing.