Abstract
Industry-standard vibration tests are used by hundreds of labs to test thousands of products every year. But how closely do the standard tests duplicate the real-world operational environment of those products?
This paper will outline a process for establishing a valid, meaningful comparison between real-world data and an industry-standard test specification. Recorded time history files of vibration within a commercially shipped package were used to develop a fatigue damage spectrum (FDS). Then, using the FDS, a test profile was created replicating a product’s lifetime of damage. Finally, this FDS and test profile were compared with similar files generated from the ISTA 3 industry standard test specification.
This is not a comprehensive study of packaging behavior, nor is it an evaluation of the ISTA 3 standard. It is a demonstration, using real, measured data, that FDS-based analysis offers an effective way to evaluate vibration standards and compare them with specific real-world environments.
Validity of Industry Standard Tests
The paper addresses a question facing virtually every industry that uses vibration testing to ensure durability and reliability; are the commonly used testing standards still valid? Many facilities are testing products with older standards, developed for environments typical at the time they were generated.
| Standard | First defined | Most recent update |
| ISTA 3A | 2008 | March 2018 |
| RTCA DO-160 | 1975 | December 2010 |
| SMC-S-016 | 2008 | September 2014 |
| MIL-STD-810 | 1962 | January 2019 |
| NASA-STD-7001 | 1996 | December 2017 |
| ISO 16750 | 2006 | November 2018 |
Table 1. Examples of industry standards.
The world continues to change. Everything moves faster, is expected to last longer, and is built using new materials and advanced engineering techniques. To match those changes, test standards should be reviewed and validated with real-world data. It may very well be that the specifications are still applicable, but confidence in a test standard can only be achieved through an evaluation of the end-use environment and careful comparisons with the standard test.
Comparisons
The simplest comparison is done using the power spectral density (PSD), which shows the base levels of vibration experienced by a product over a period of time. However, if the goal is Lifetime testing, it is better to use a random test that creates the equivalent to a product’s total life damage.
This type of lifetime test and comparison can be done with damage analysis using a fatigue damage spectrum (FDS). The process begins with multiple real-world recordings, which are combined with weighting based on their contribution to the full life, end-use environment. Using this input, an FDS is then generated, showing the relative damage experienced by the product for each environment, some combinations of environments, and, in the end, for a cumulative spectrum encompassing all the combined and weighted environments.
FDS creation is repeated using an industry-standard test specification. The standard test FDS is then compared with the recorded data FDS to determine if the entire spectrum is valid or invalid or if a few key areas are under or over-testing. It is important to realize that a valid comparison is very dependent on the product and the end-use environments used for the data recordings.
A further analysis starts by using the recordings-based FDS to create a vibration test profile that replicates a lifetime of product damage within the same time frame as the industry standard test. Differences — or similarities — between the new test profile and the standard test profile are easy to identify.
Calculating an FDS
FDS computation is based on Miner’s Rule of Damage, which states that fatigue damage will accumulate over time until it reaches a level that causes a crack or other deformation of a product.
An FDS is produced by plotting the individually calculated fatigue damage values for narrow frequency bands. For each frequency band, a Rain flow counting algorithm counts the stress peak-valley cycles; the stress cycle amplitudes are weighted non-linearly because of the power-law function in Miner’s rule. These cycles are accumulated to get the accumulated fatigue at that specific frequency, according to Henderson-Piersol’s fatigue calculation method.
Using a resonance ‘Q’ factor and material ‘b’ factor (the slope of the S-N curve for the material composing the device under test (DUT), the fatigue damage value for each frequency band is calculated. The collective plot of all of these fatigue damage values is the fatigue damage spectrum.
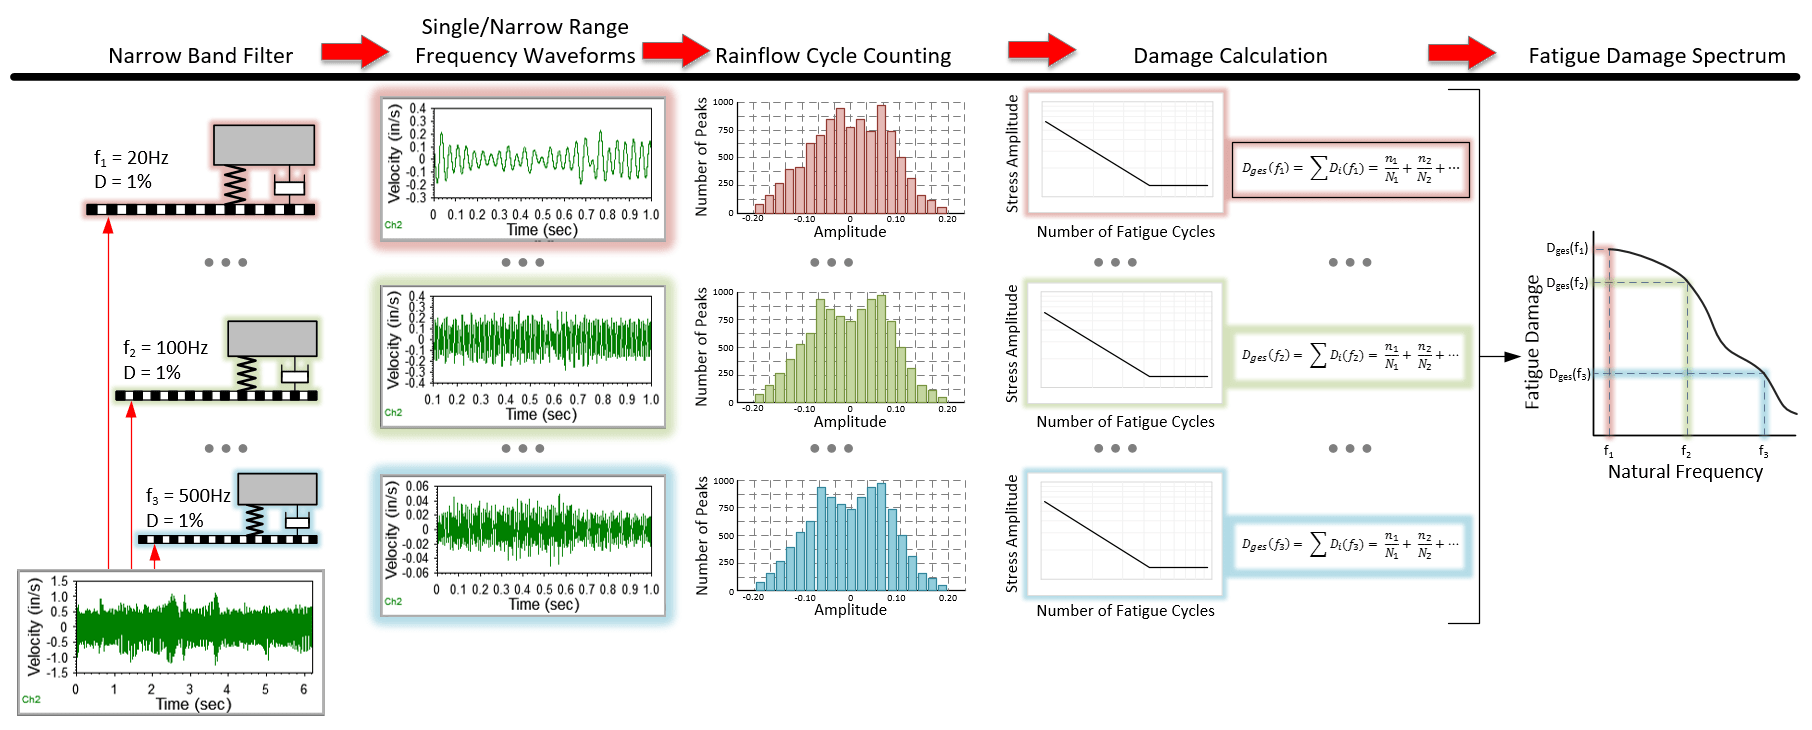
Figure 1. Calculating the FDS.
VibrationVIEW software, from Vibration Research, executes these calculations using an imported recording data file or a test profile. A user sets the Q and b factors and enters both the product’s target life and the desired test duration; the software then computes an FDS. Using the FDS, VibrationVIEW will also create a test profile.
FedEx Package Shipping Case Study
A team from Vibration Research placed an ObserVR1000 [1] and multiple external batteries, surrounded by a cushion of packing material, into a common cardboard shipping box. One tri-axial accelerometer was attached to ObserVR1000’s top surface and another was attached to an inside wall of the box. The ObserVR1000 was turned on, the box was closed, and the package was shipped out via FedEx, recording vibrations during its travel.
The team did this twice. The first shipment was from Grand Rapids International Airport (GRR) to Vibration Research headquarters in Jenison, Michigan. The second shipment was from Vibration Research to the nearest FedEx facility and back again. Each time, after the box was received, it was opened, and the recording was ended.
Data Recordings
The acceleration data from both recordings were imported into VibrationVIEW. Upon reviewing the recordings, it was clear that, as expected, the accelerometer attached directly to the shipping box offered the best data for assessing package vibrations [2], with the z-axis channel offering the most consistent data recordings.
The recordings showed all the vibration activity experienced by the package, including pick-up, placement in the delivery truck, road travel, unloading, movement within the FedEx distribution facility, and long periods of no vibration when the package was temporarily stored in the distribution facility. For both recordings, a road travel segment was identified; the recorded data from these segments were used for the study’s calculations, comparisons, and analysis. See Figures 2 and 3.
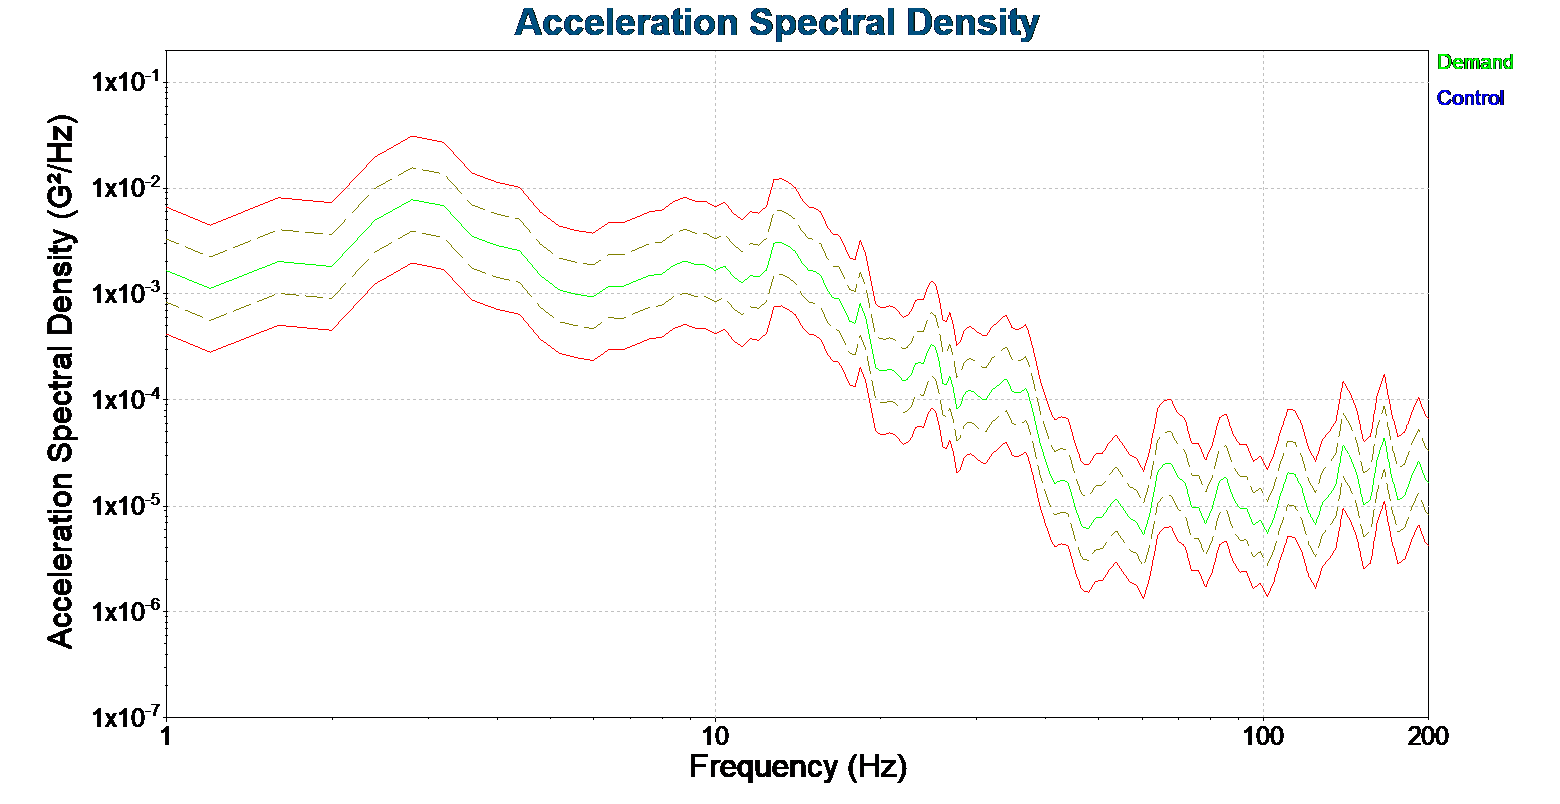
Figure 2. Combined data recording test profile.
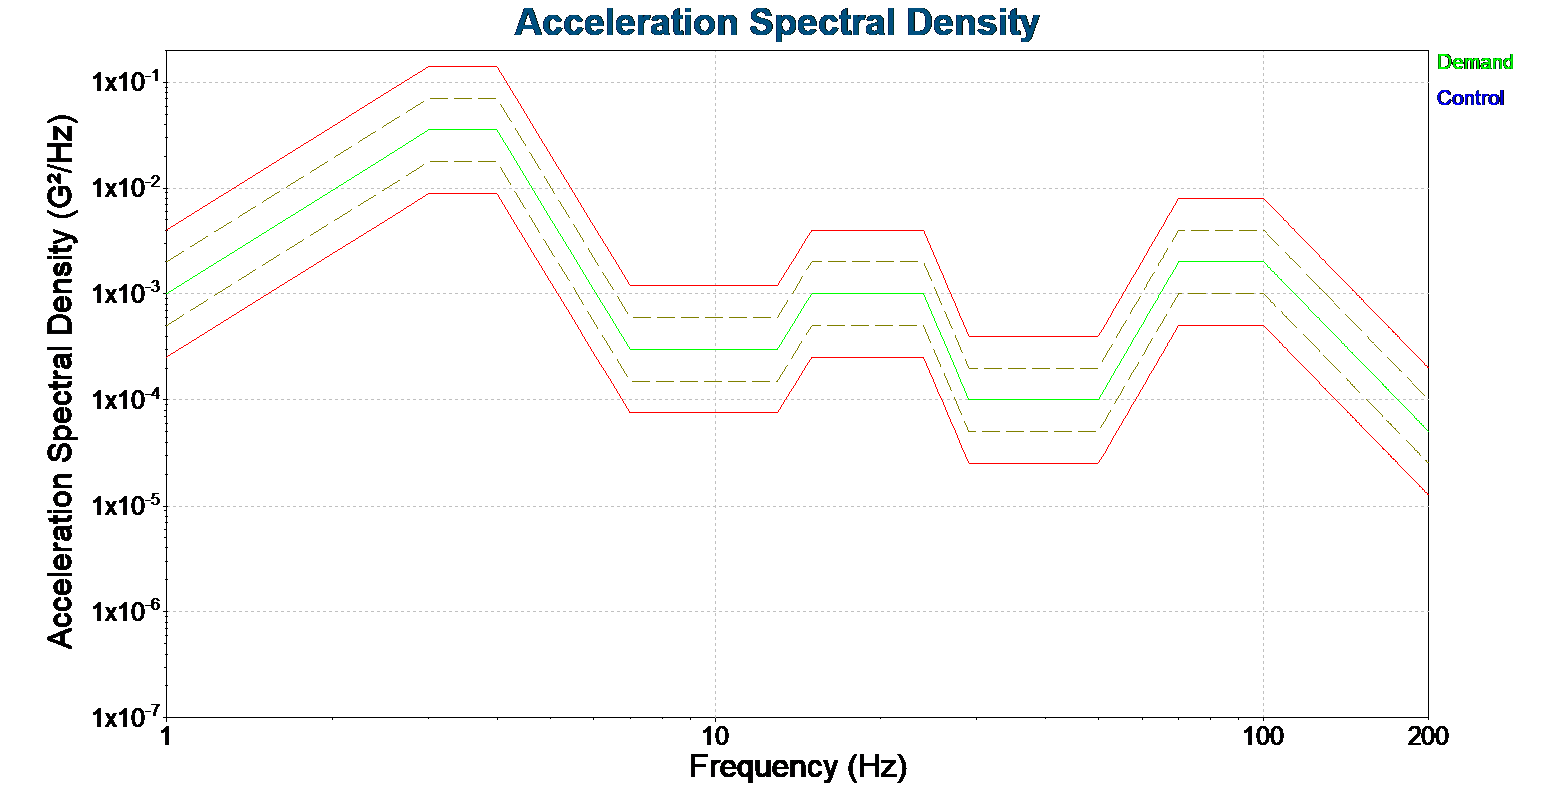
Figure 3. The ISTA 3A Pick-up & Delivery Vehicle Spectrum test profile.
FDS Comparison
The study team used VibrationVIEW to create and graph an FDS for both of the selected data segments and also for the ISTA 3A Pick-up & Delivery Vehicle Spectrum test profile (see Figure 5). These graphs are overlaid in Figure 4.
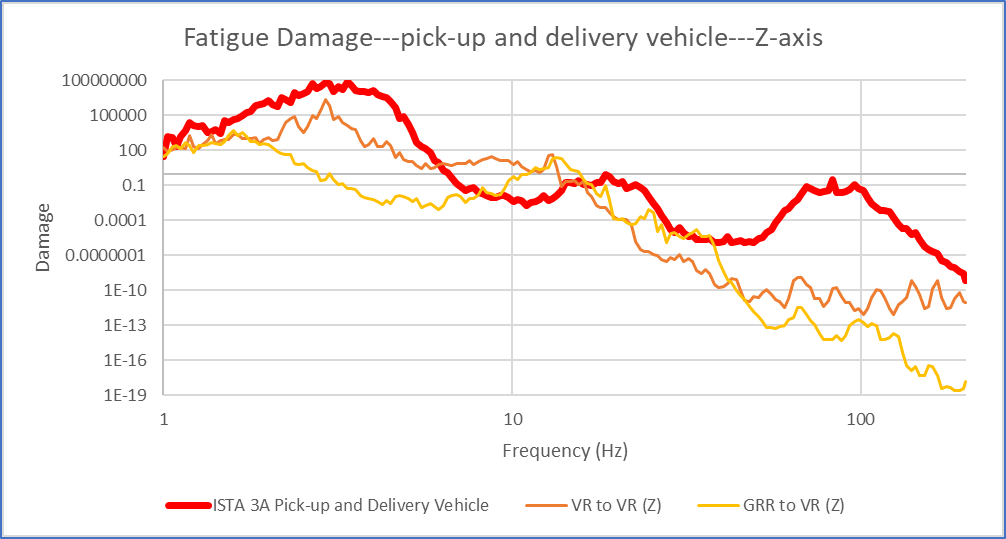
Figure 4. Fatigue damage comparison
The FDS graphs for the data recording generally resemble the FDS graph for the ISTA 3A standard test, with some relative under-testing in the 10Hz to 20Hz range and over-testing in the 80Hz to 100Hz range.
Test Profile Comparison
VibrationVIEW was also used to create a combined FDS for the two recording segments and then to create a test profile from that FDS. Figure 5 shows the ISTA 3A test profile and Figure 6 is the recorded data test profile. In these graphs, the solid green line is the control signal, the dashed tan lines indicate the test tolerances and the red lines are the abort limits.
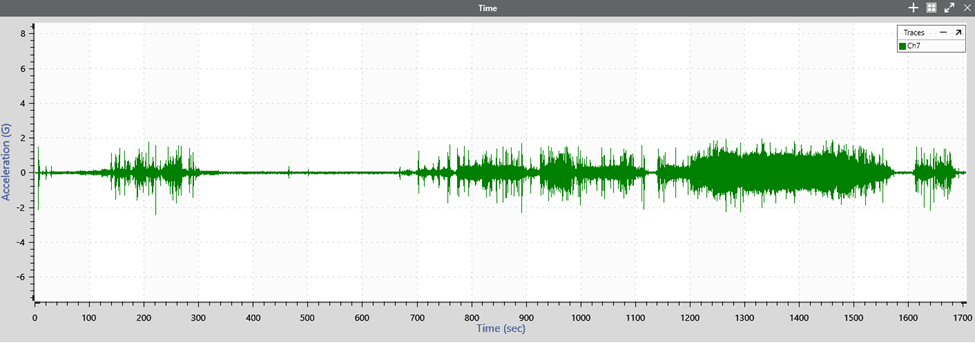
Figure 5. Z-axis vibration, during travel in pick-up & delivery vehicle for approximately 30 minutes, VR-to-VR recording
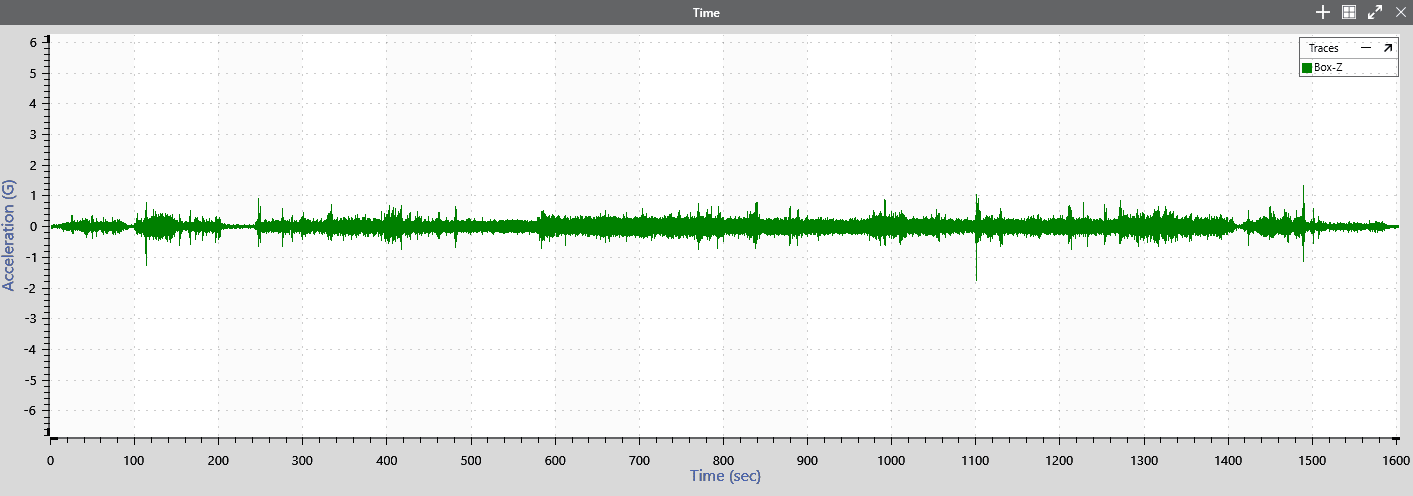
Figure 6. Z-axis vibration, during travel in pick-up & delivery vehicle for approximately 30 minutes, GRR-to-VR recording
The recorded data test profile has some broad similarities to the standard test profile, with much more variation, reflecting the random nature of real-world events. It is also possible to see the same general areas of relative under- and over-testing, as found in the FDS comparison.
Conclusions
As stated earlier, this is not a comprehensive study of packaging behavior, nor is it an evaluation of the ISTA 3 standard. A much larger set of sample data, collected under more controlled conditions, would be needed to accomplish either of those purposes.
However, this case study does demonstrate that important insights can be gained by an FDS comparison between real-world data recordings and a test standard. With more data, rigorously collected, the comparisons would be clearer, providing either confidence in the standard or impetus to move on from using the standard.
- The ObserVR1000 is a portable data recording and dynamic signal analysis device. It has an internal battery with a 6+ hour life and can be configured with an external battery, or batteries, as were used in this case study.
- The accelerometer attached to the top of the ObserVR1000, cushioned by packaging material, recorded significantly less vibration. While this type of data could be used for packaging analysis, it was not useful for this case study.