Vibration Test Development Software
Advanced Analysis Software Without Coding
ObserVIEW
Analyze recorded data and develop vibration control test profiles
Data Editing
View data files for free! Crop, copy, cut, and paste sections of a waveform or append compatible files. Supported file types: .csv, .txt, .rpc, .rsp, .uff, .unv, .vfw, and .wav.
Waveform Analysis
Perform advanced vibration analysis without the need for code, ideal for engineers of all levels. Analysis functions include FFT, resampling, filtering, PSD, transfer function, and more.
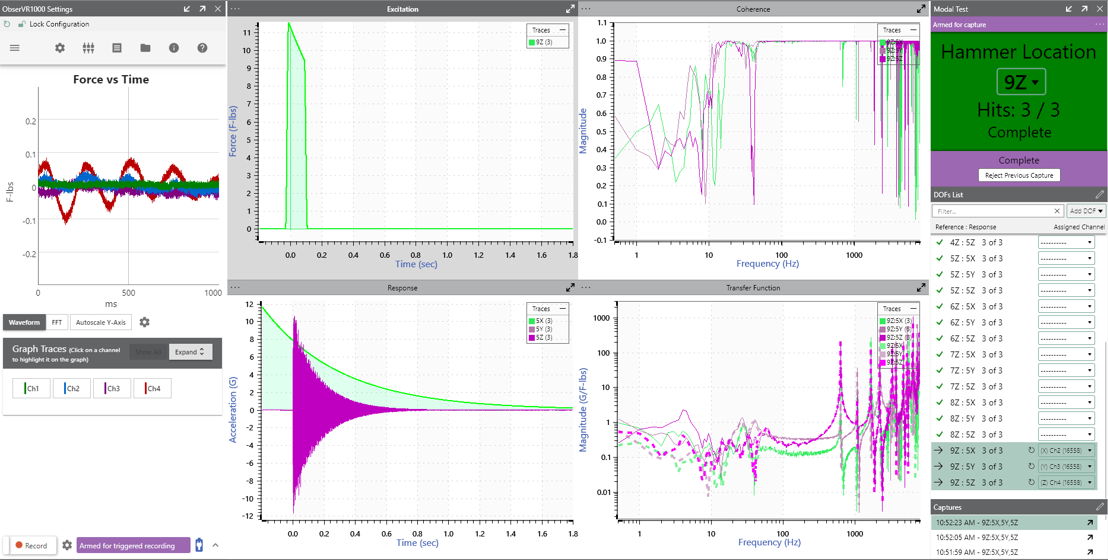
Modal Testing
Use an intuitive project setup dialog that walks you through parameter selection. The automatic location sequencer tells you exactly when and where to strike the DUT.
Test Profile Development
Access test profile development options for field-data replication in the lab, including accelerated random, sine-on-random, and complex shock test profiles.
Do More with Your Data
Analyze noise and vibration data then create a test profile
Data Analysis
raw test data to professional report in minutes
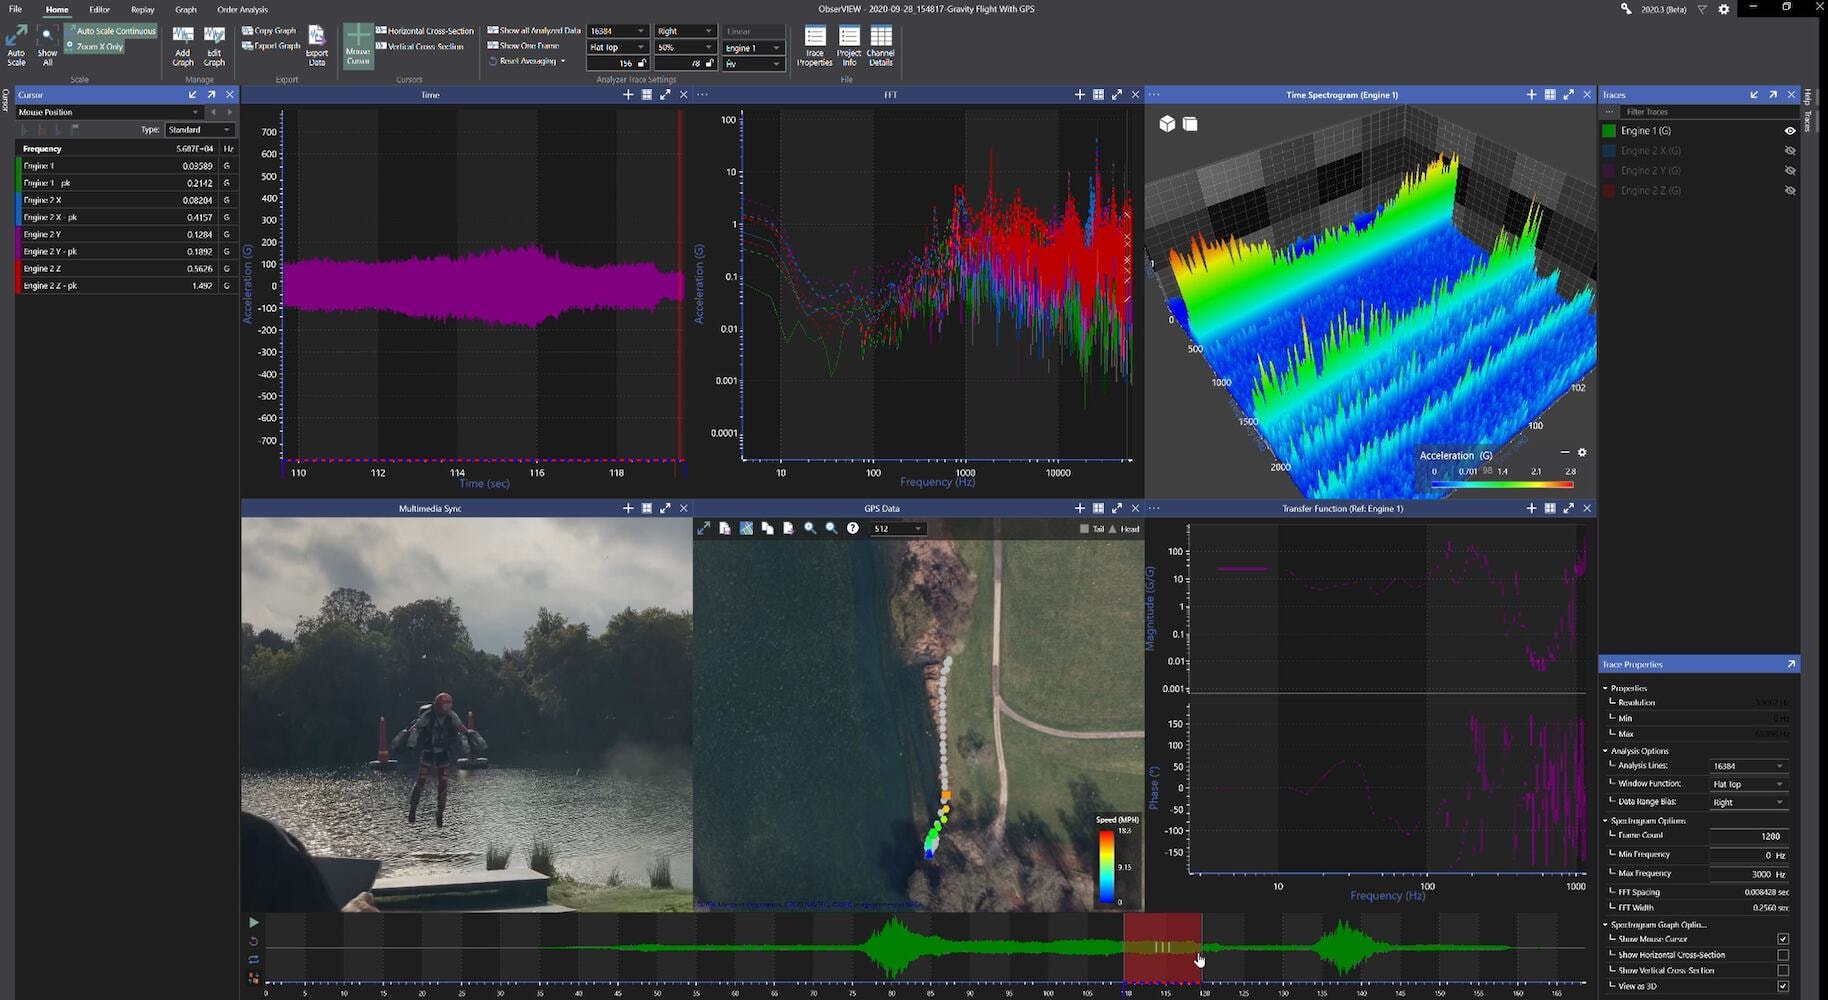
Analyze and report test data with confidence. ObserVIEW supports most text and CSV files from any data acquisition system. It handles large recording files (100+ GB) with ease and can synchronize data from multiple DAQ devices.
ObserVIEW is equipped to process multi-channel analysis for high-channel systems, while its automated workflows are accessible to engineers at every level.

SOFTWARE LICENSES AVAILABLE
- Basic (free)
- Advanced
- Order Analysis
- Modal Testing
- FDS
- SRS
Does this apply to your application?
ObserVIEW can be configured for as many or as few modules as you’d like (à la carte). Our software is activated via an electronic key, making it easy to add new features at any time. A free trial of any software license is also available, or you can rent them for short-term needs.
Show Me How
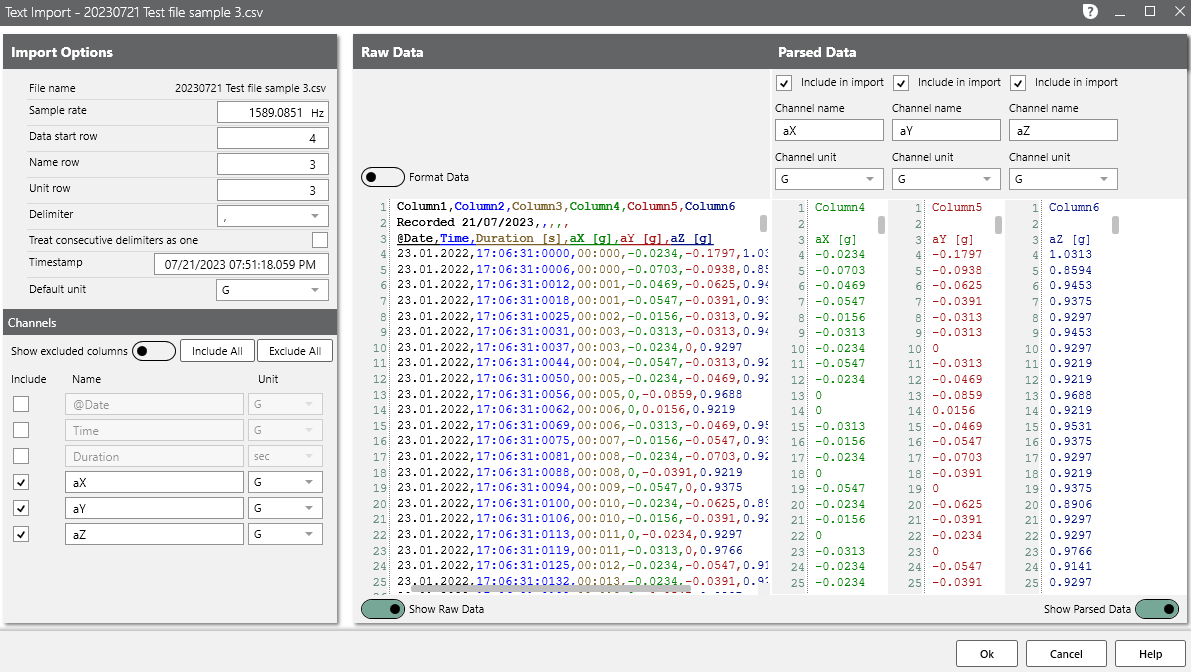
Import Options
Reduce error risk and deliver results faster
Import 100+ GB of data from any data recording device to analyze in ObserVIEW. For large/multiple files, use the Text Import dialog to define import options or the Batch File Processor to overlay, filter, and resample files. ObserVIEW supports the following file types:
- CSV
- TXT
- MTS RPC
- UFF
- VFW
- WAV
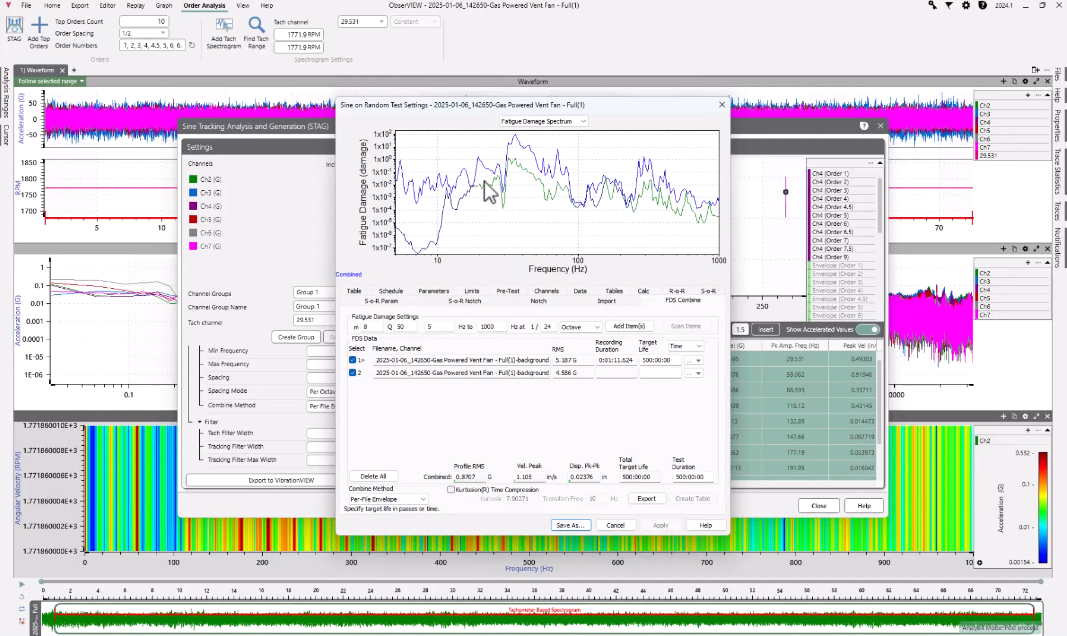
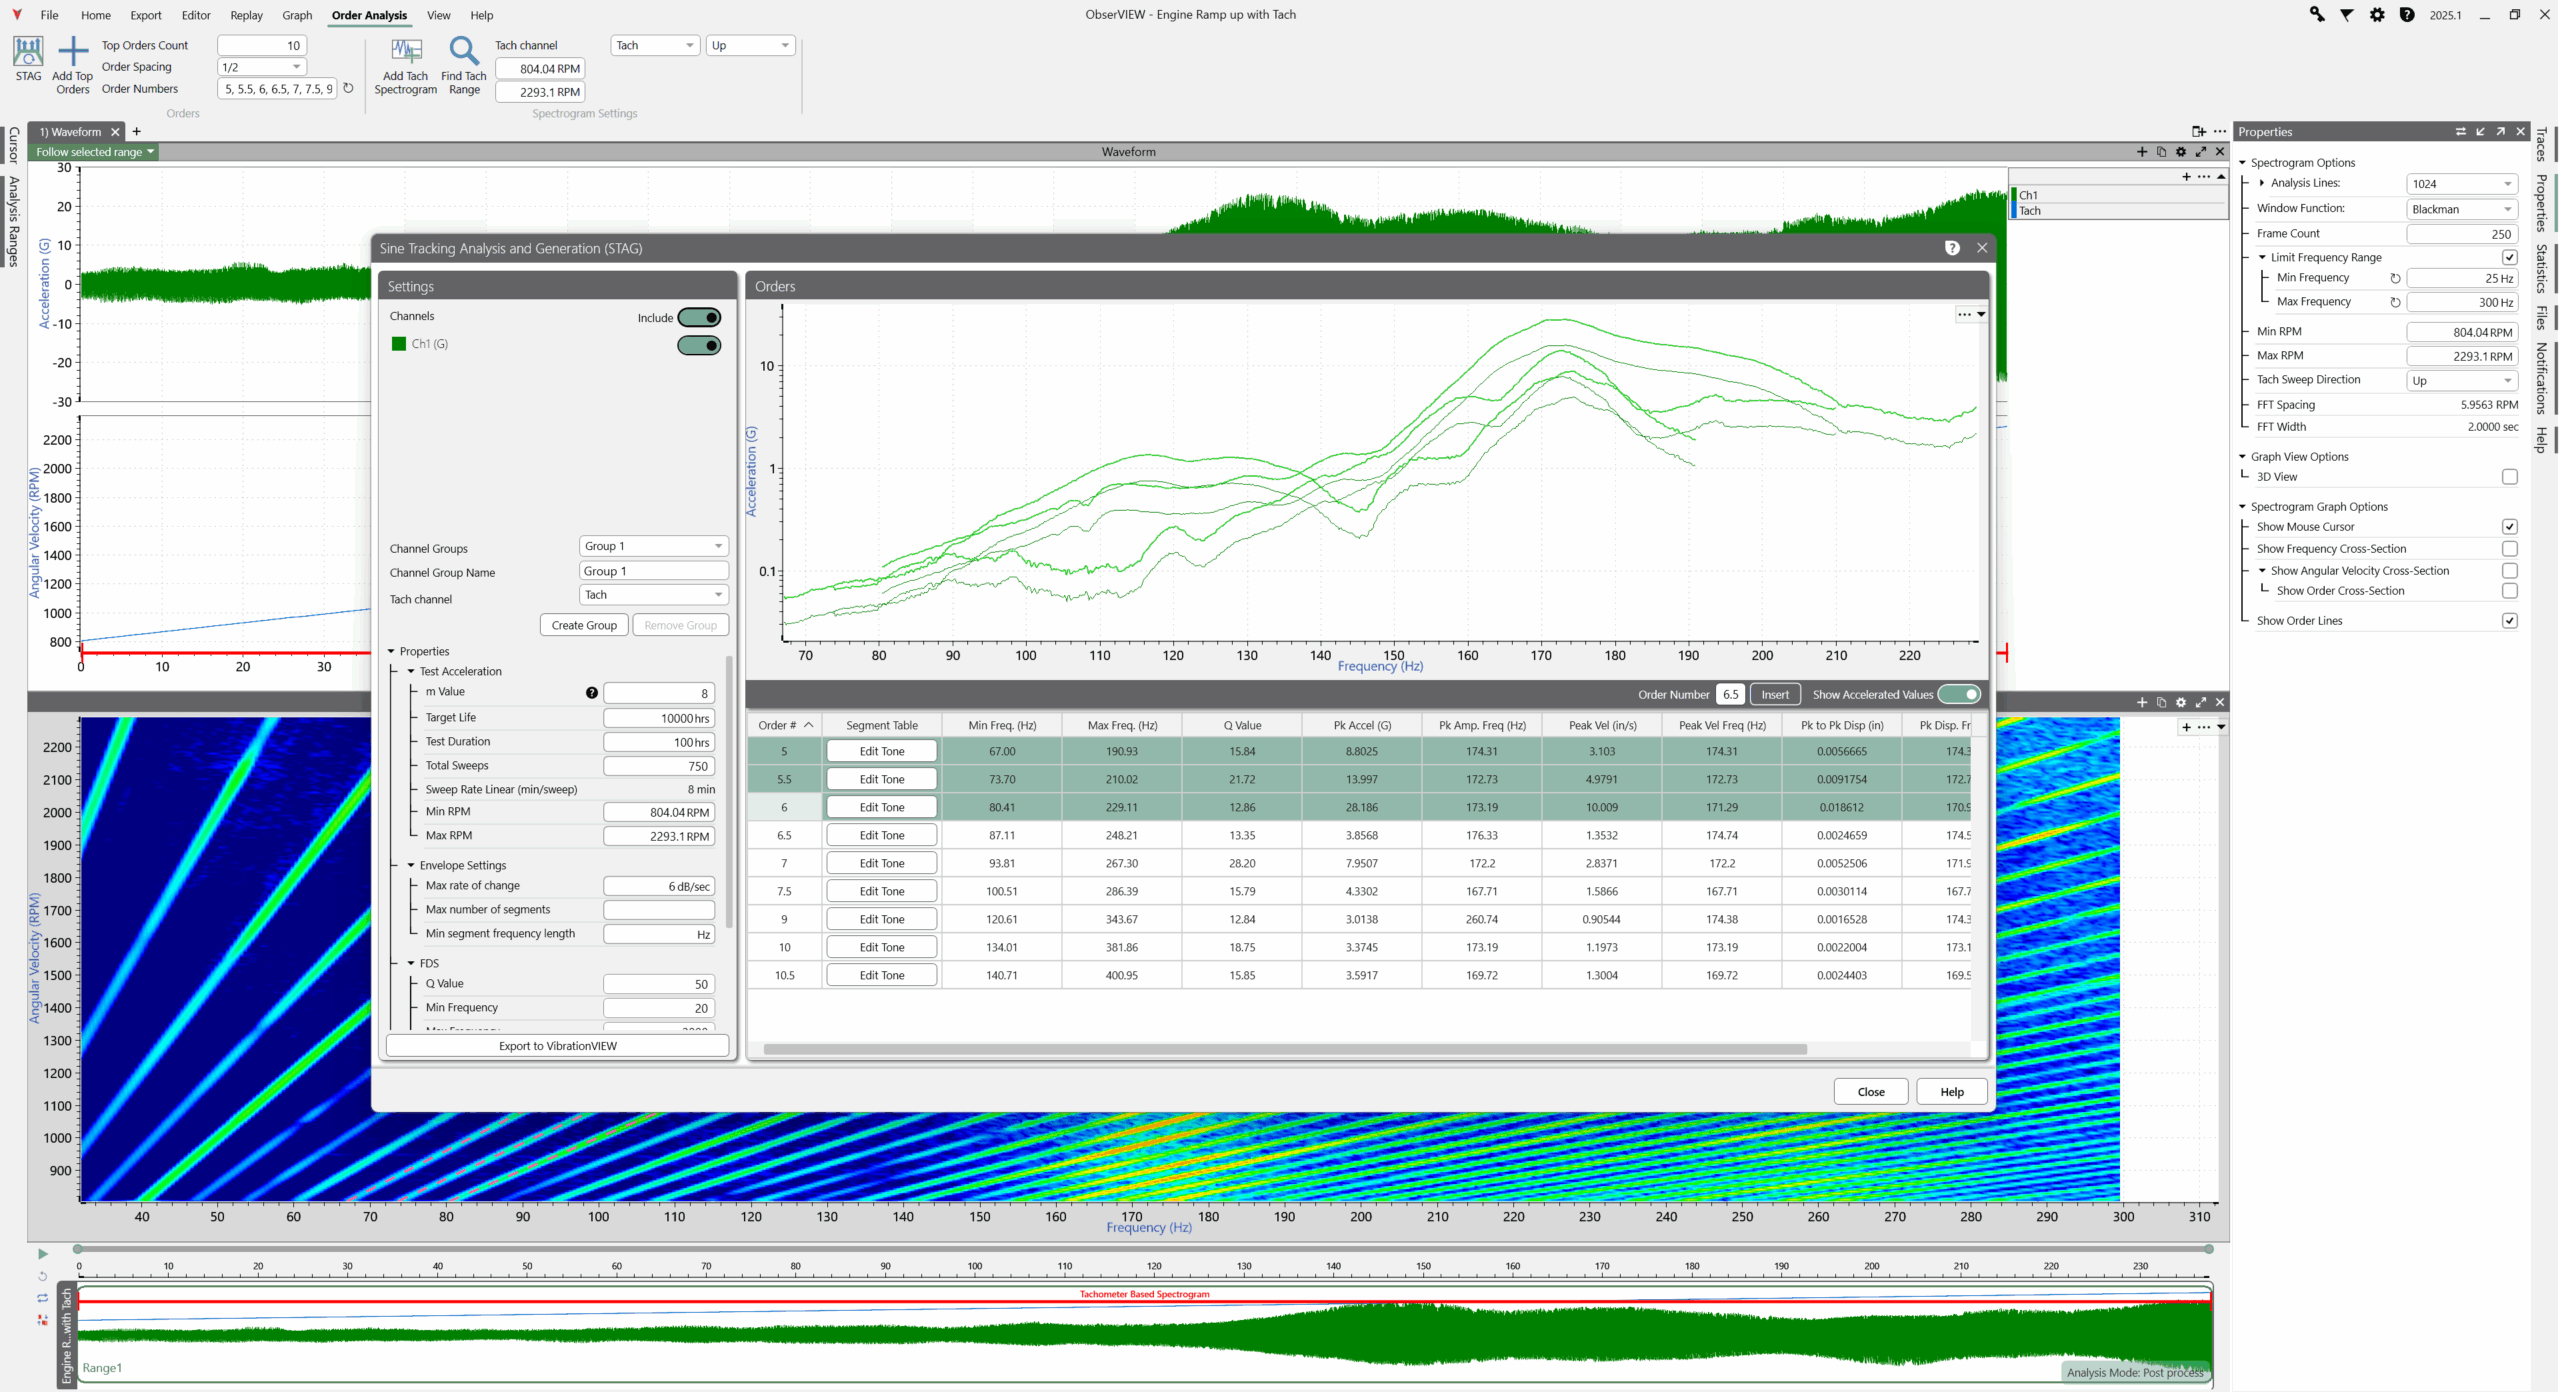
![]() SINE TRACKING, ANALYSIS AND GENERATION (STAG)
SINE TRACKING, ANALYSIS AND GENERATION (STAG)
STAG allows engineers to analyze, generate, and accelerate a realistic sine-on-random vibration test. It uses order analysis and the fatigue damage spectrum to ensure all of a test profile’s vibration components are an accurate representation of the operational environment.
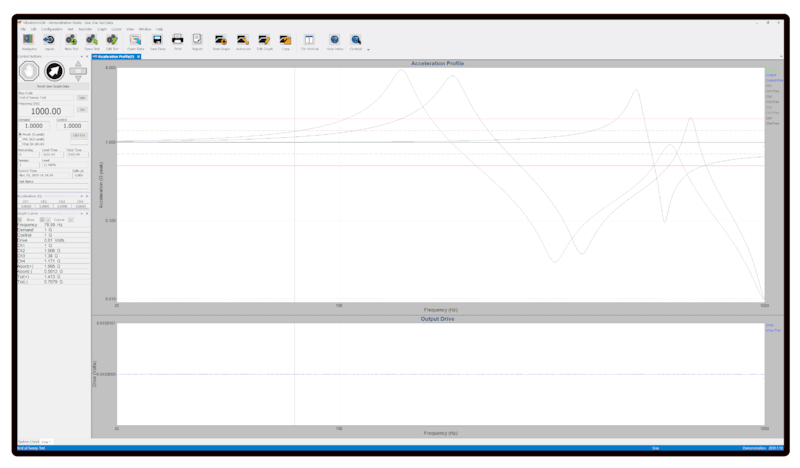
Test Development
One platform from field data to certified report
Develop custom test profiles reflective of your component’s end-use environment with ObserVIEW’s test development software options. Test standards can omit potentially damaging peaks or over-test the component, leading to over-design. Engineers can improve their test profiles with field-recorded data.
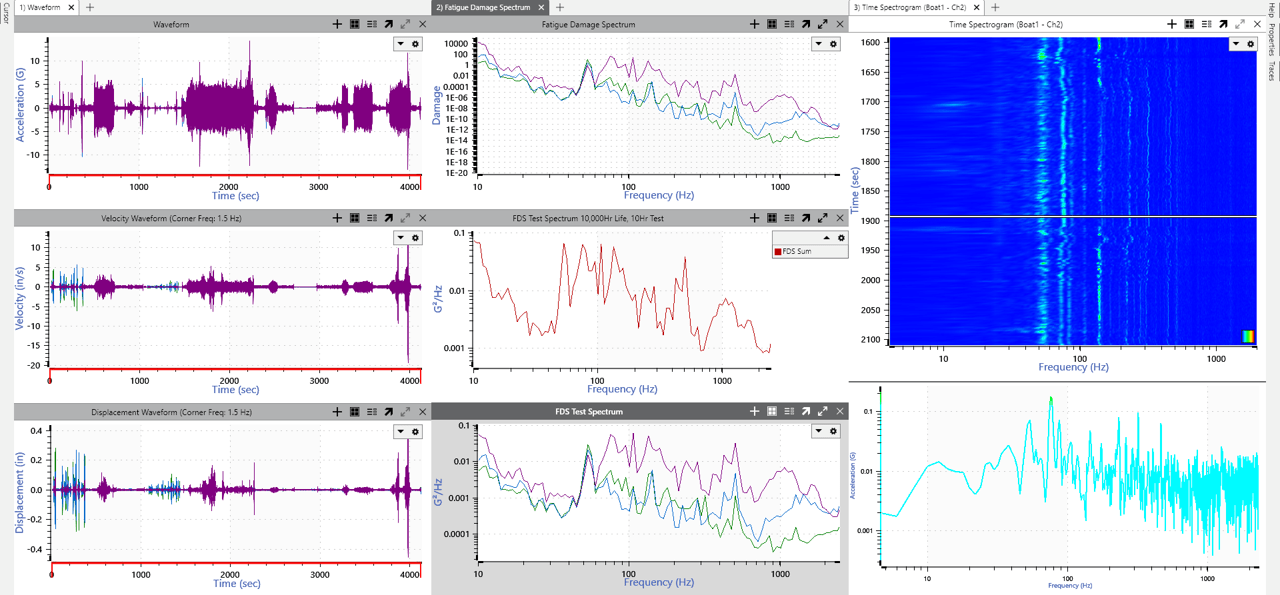
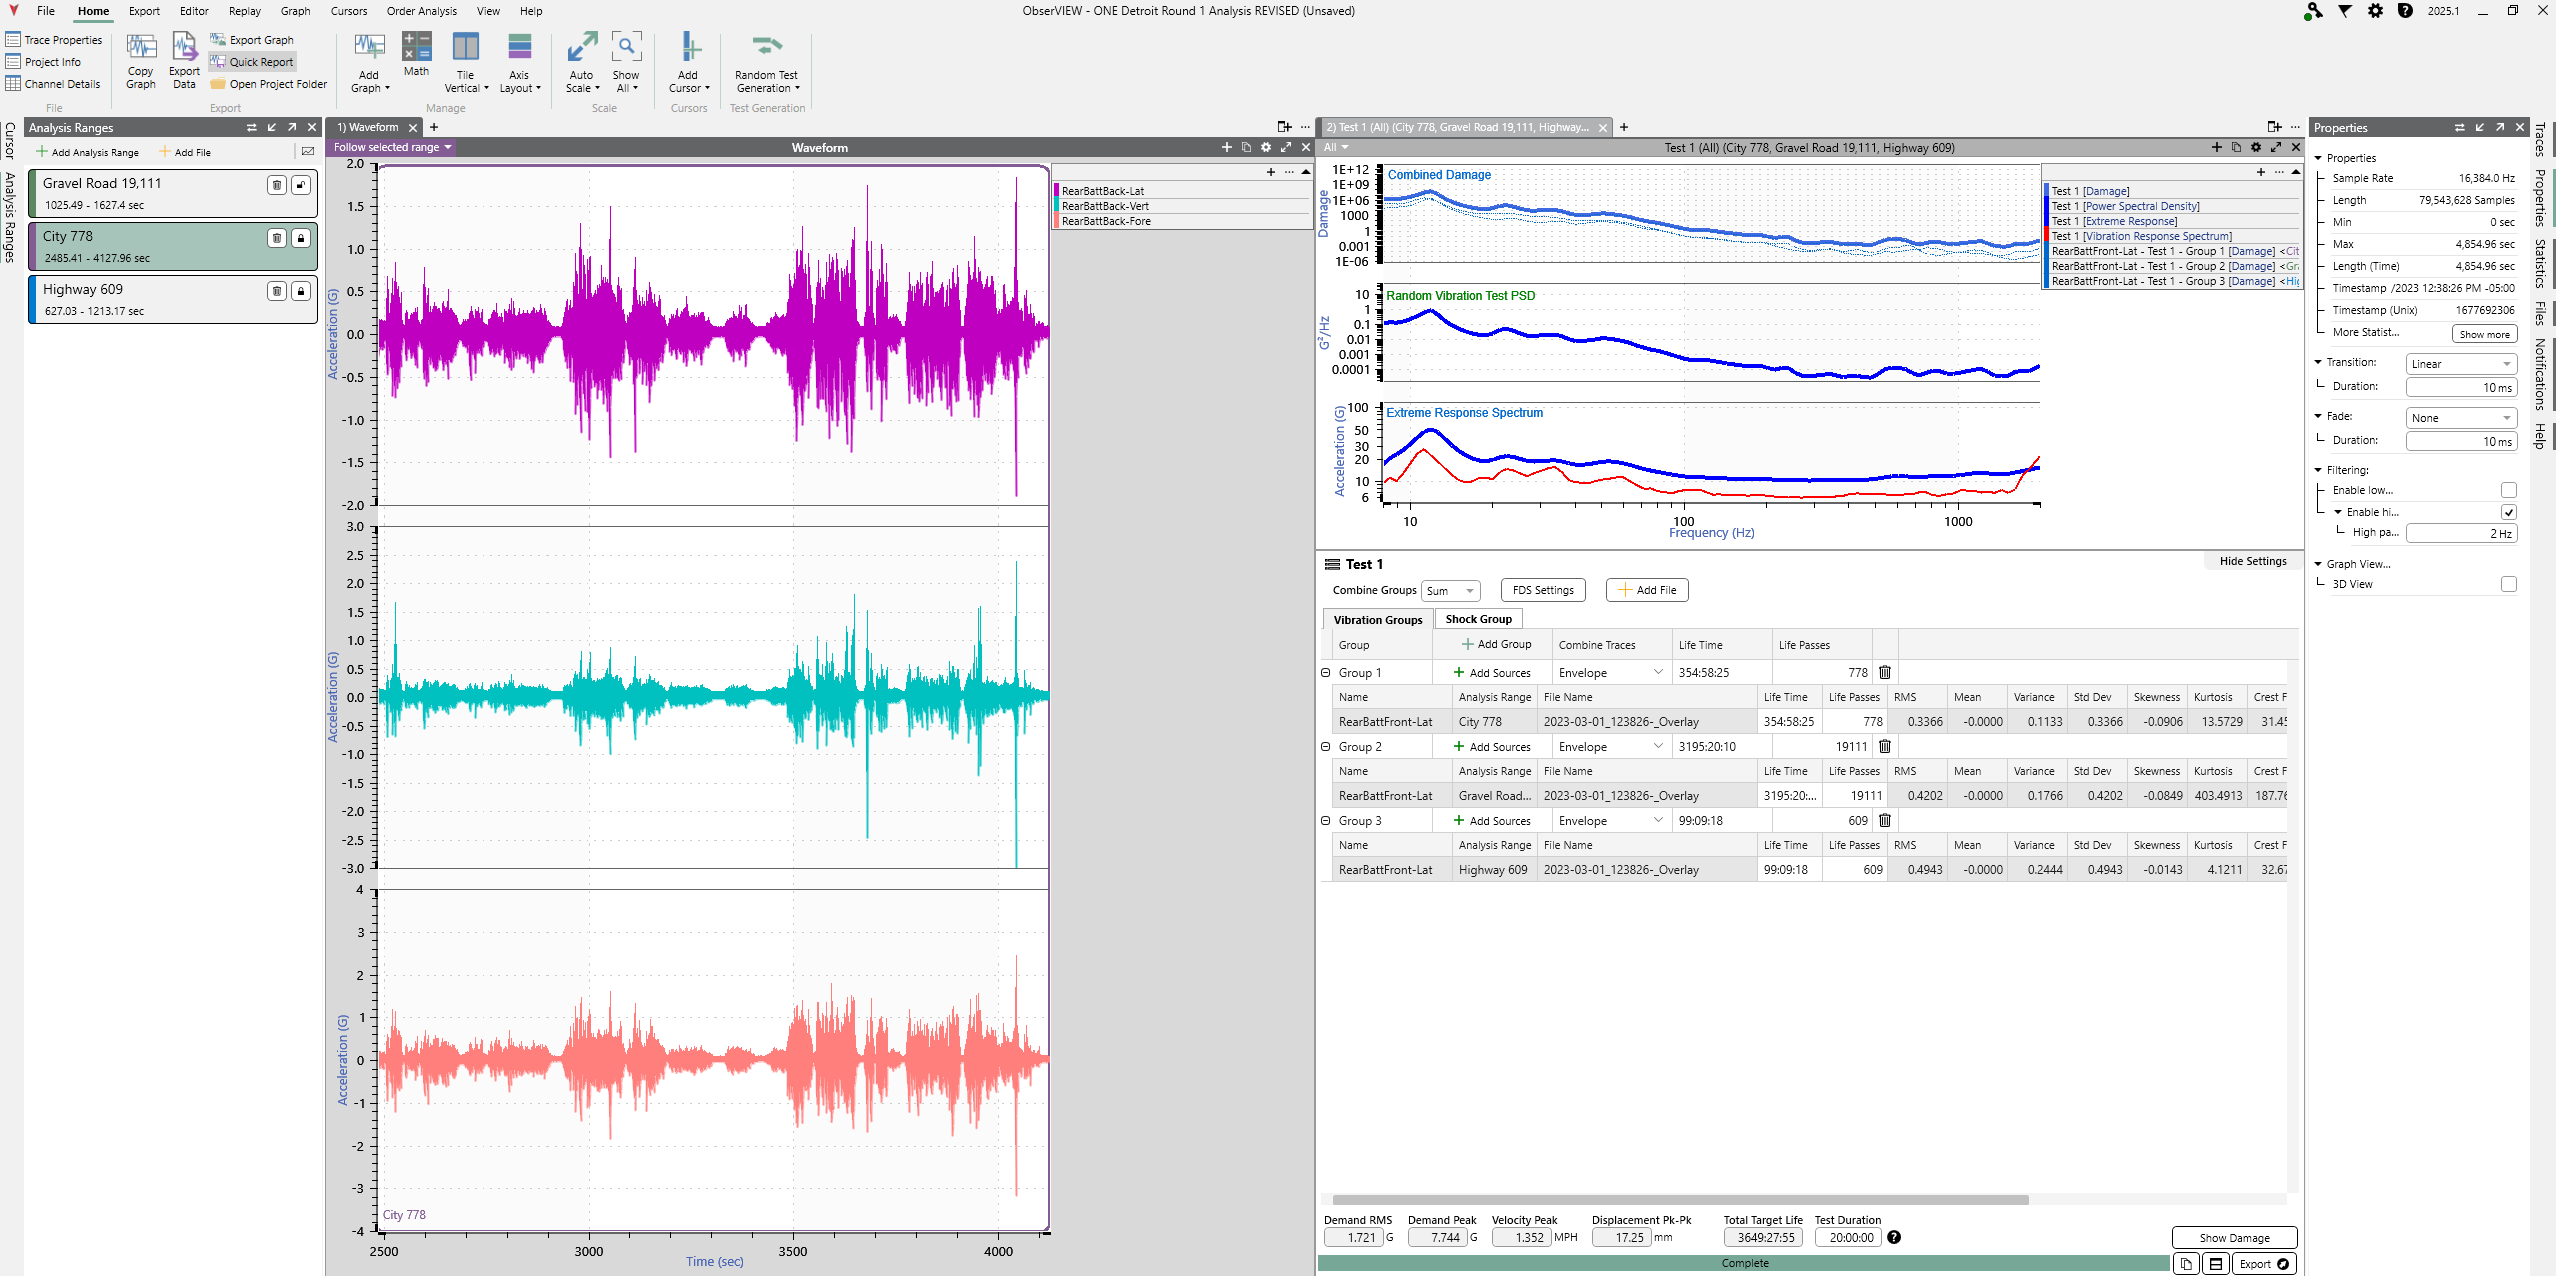
 FATIGUE DAMAGE SPECTRUM (FDS)
Engineers can use the FDS to create an accelerated random test profile that is the damage equivalent to the recorded environment. With the Random Test Generation option, create a PSD test from multiple channels or files. The result is a profile encompassing some or all forms of potential fatigue.
 SHOCK RESPONSE SPECTRUM (SRS)
The SRS creates a complex shock test profile from one or multiple recorded shock events.
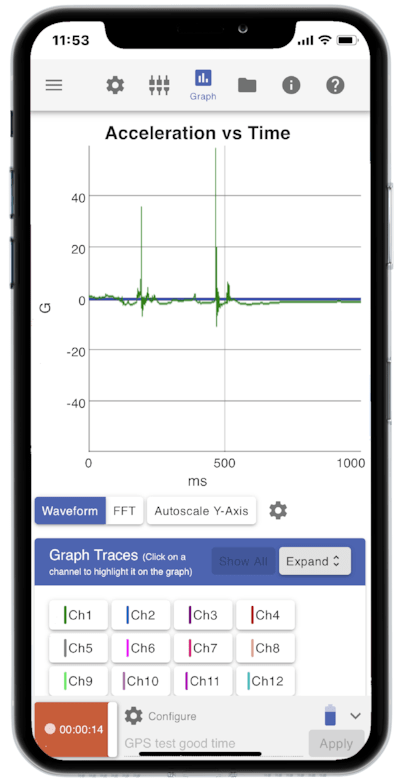
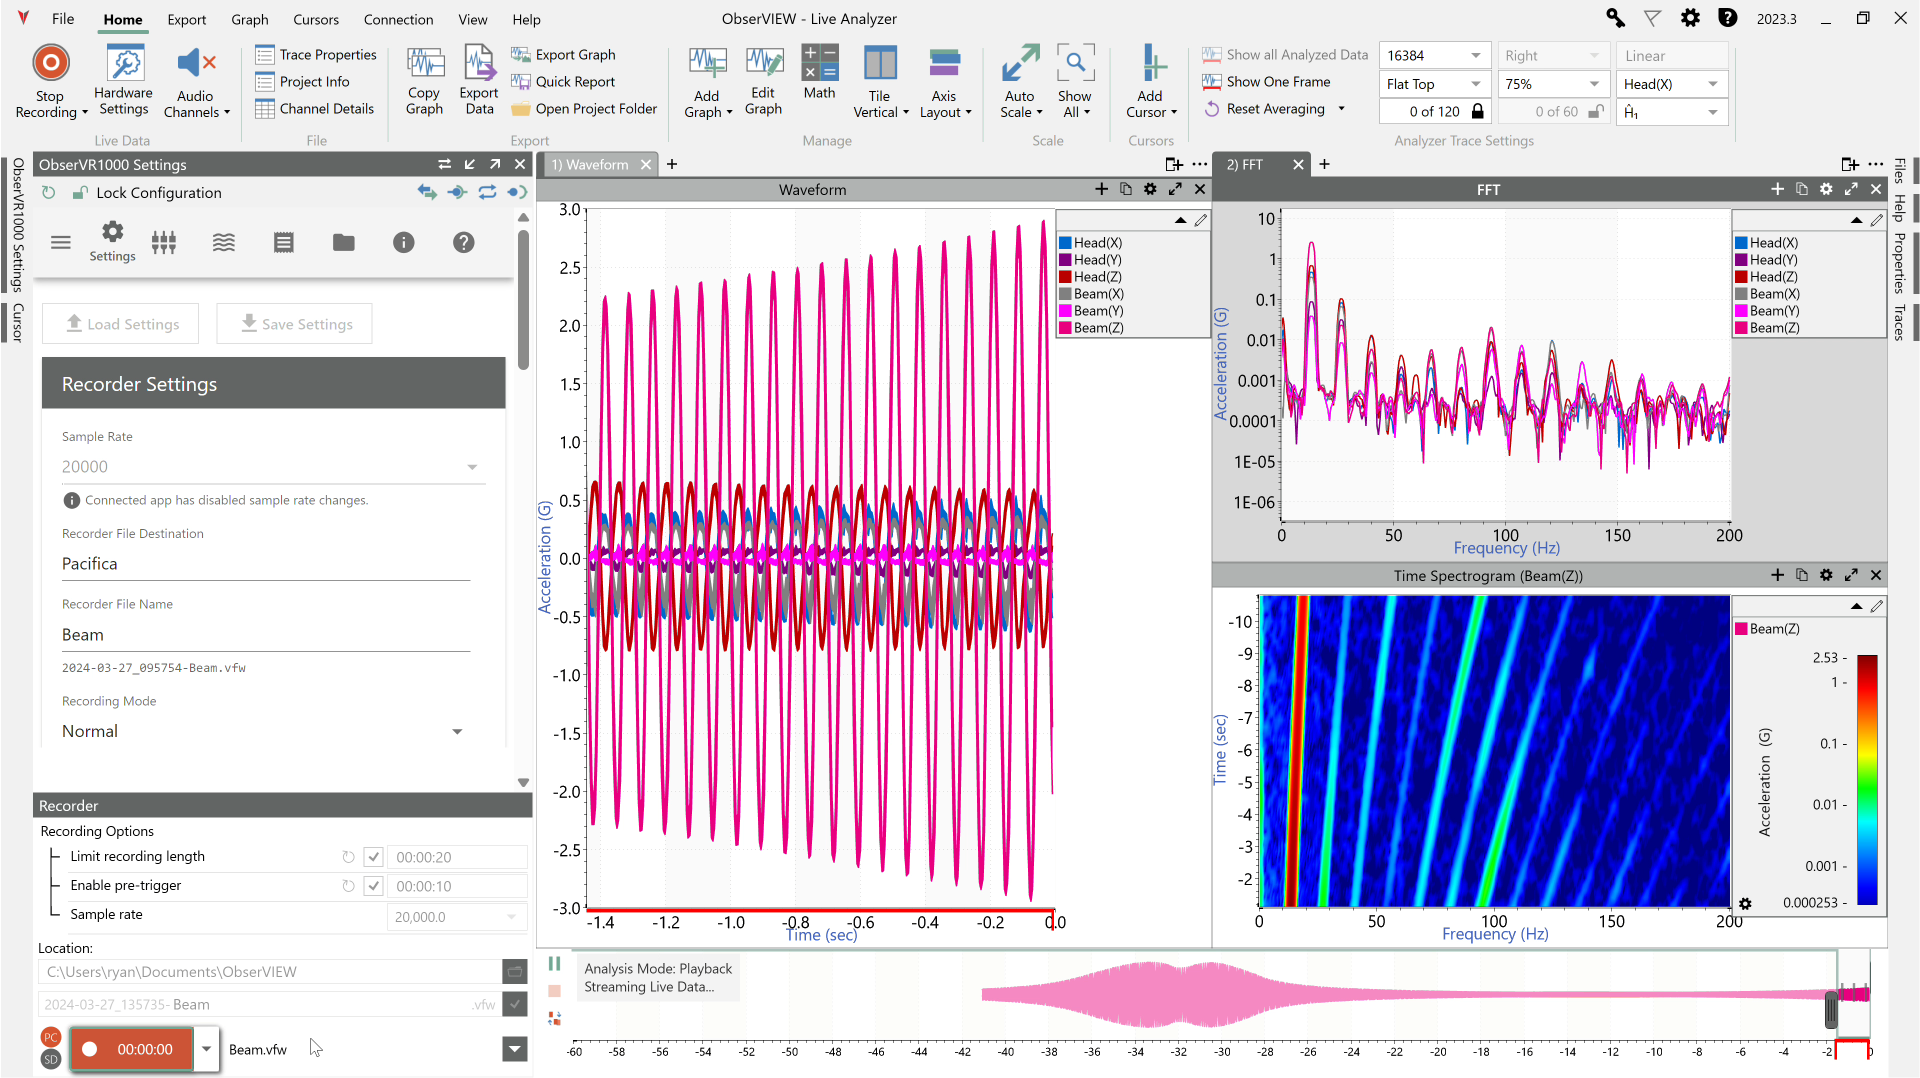
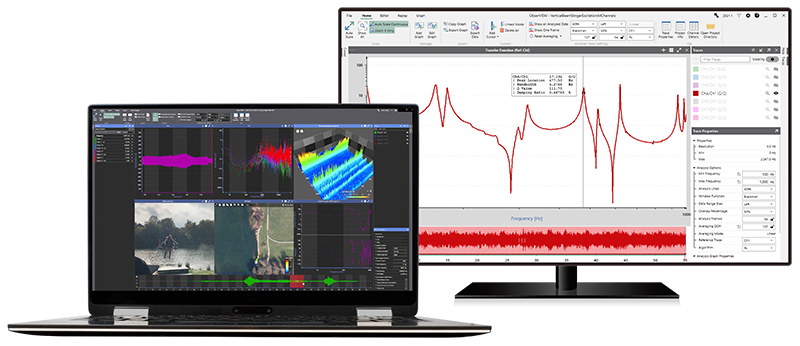
 Monitor a live data stream
Observe real-time vibration levels to monitor system integrity, detect anomalies, or confirm test conditions.
 Edit, append, and export files
Clean or combine datasets, add metadata, and export to formats compatible with analysis or reporting tools.
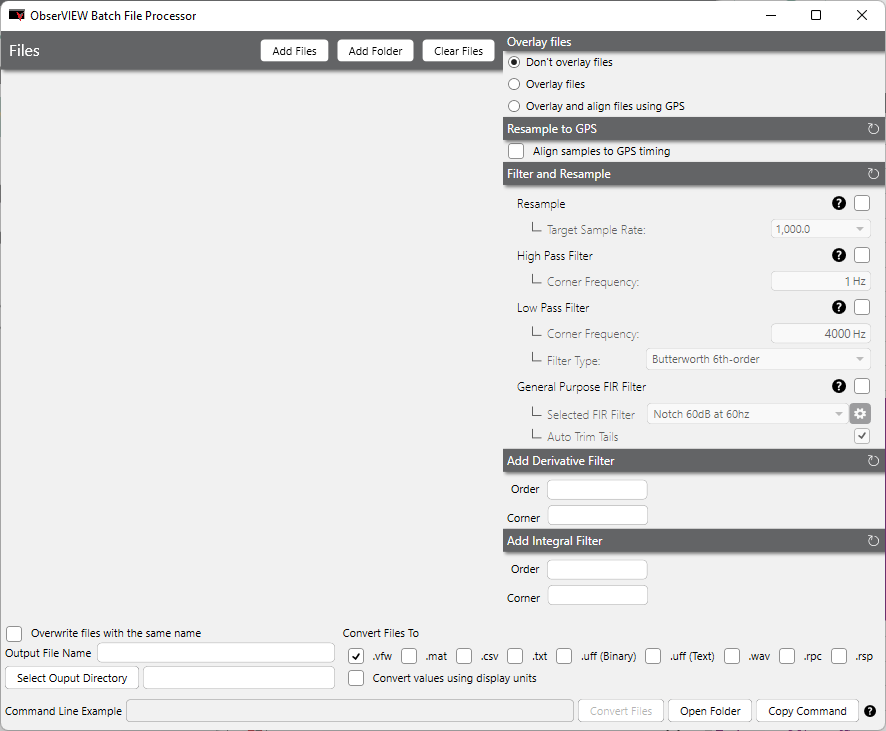
 Resample and filter data
Remove noise or aliasing, focus on relevant frequency bands, and prepare signals for analysis.
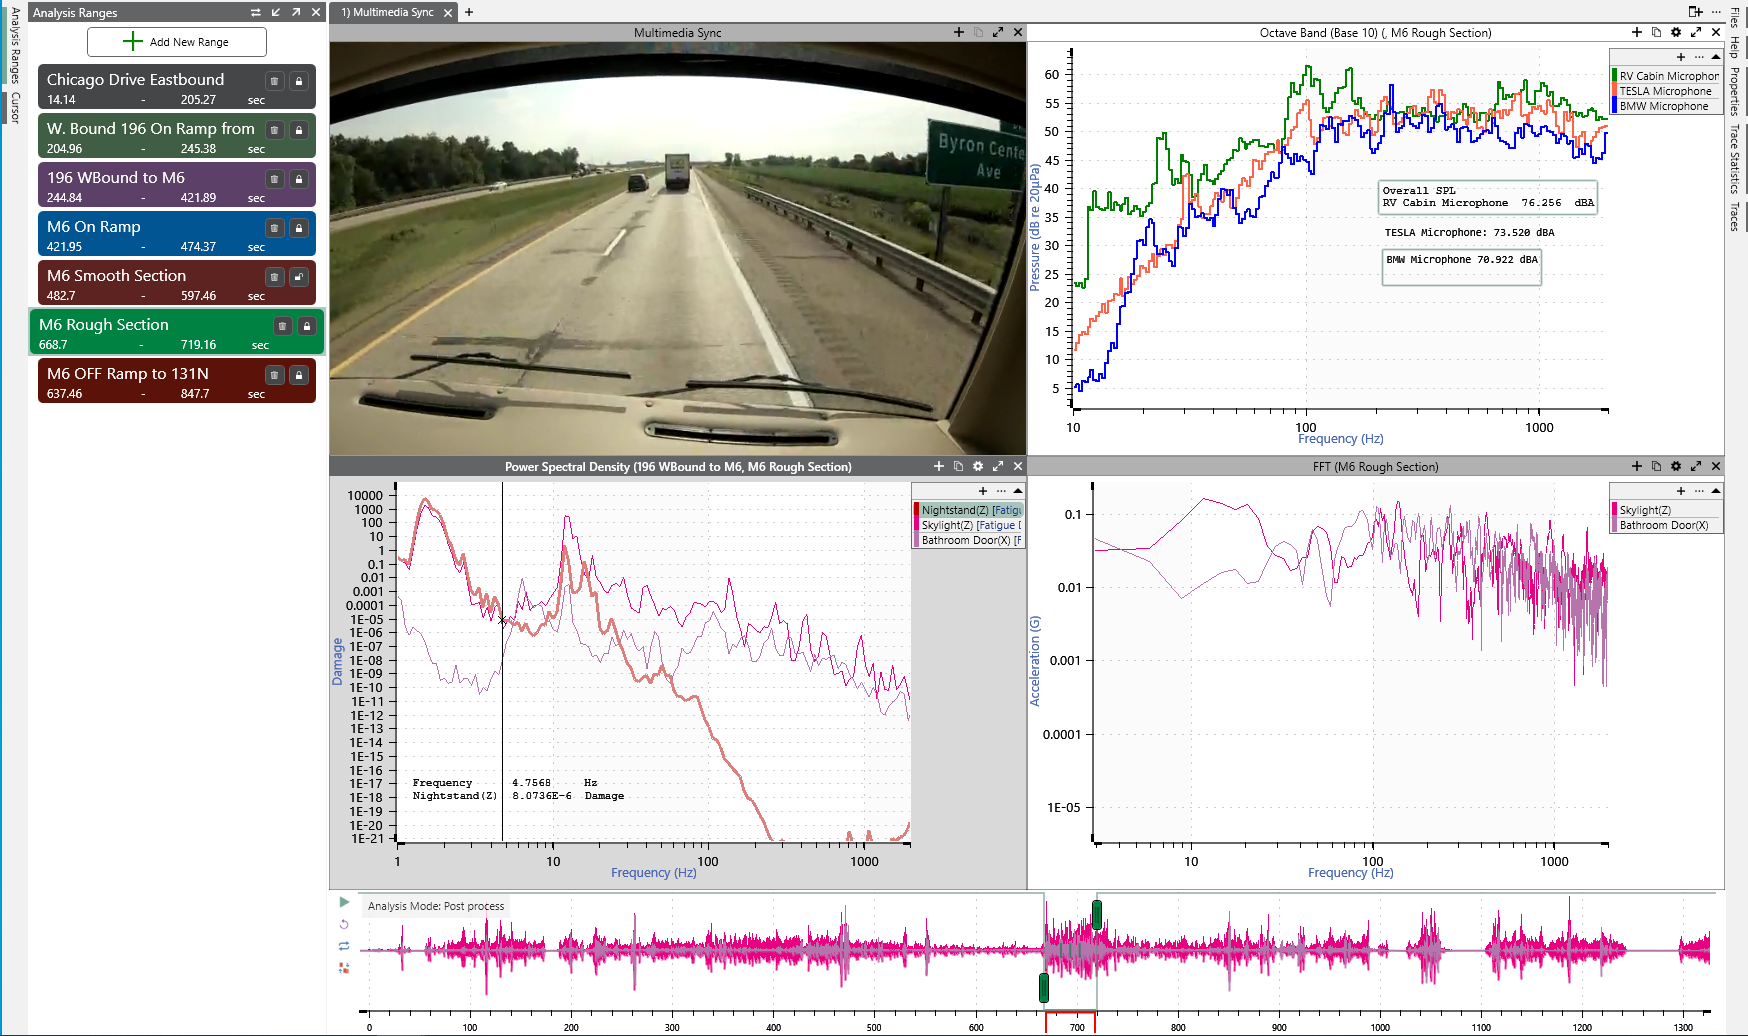
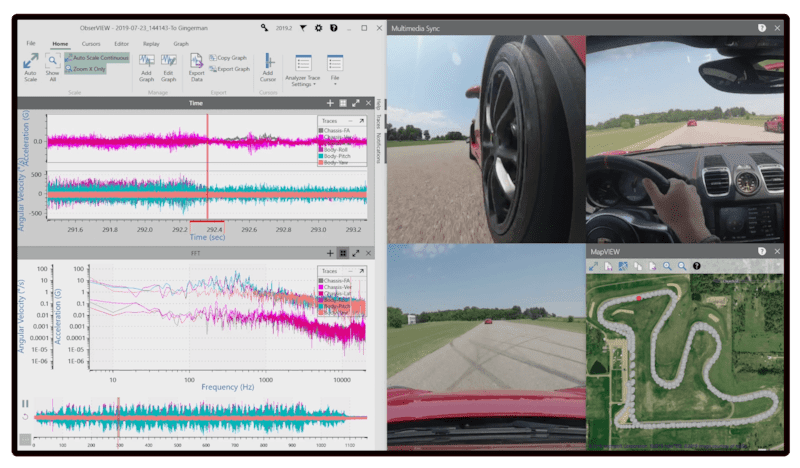
 Sync media files with data recordings
Correlate visual events with vibration spikes or failures for root cause analysis.
 Apply frequency-domain graphs for power or statistical analysis
Identify dominant frequencies, assess spectral content, and evaluate energy distribution to validate results or diagnose issues.
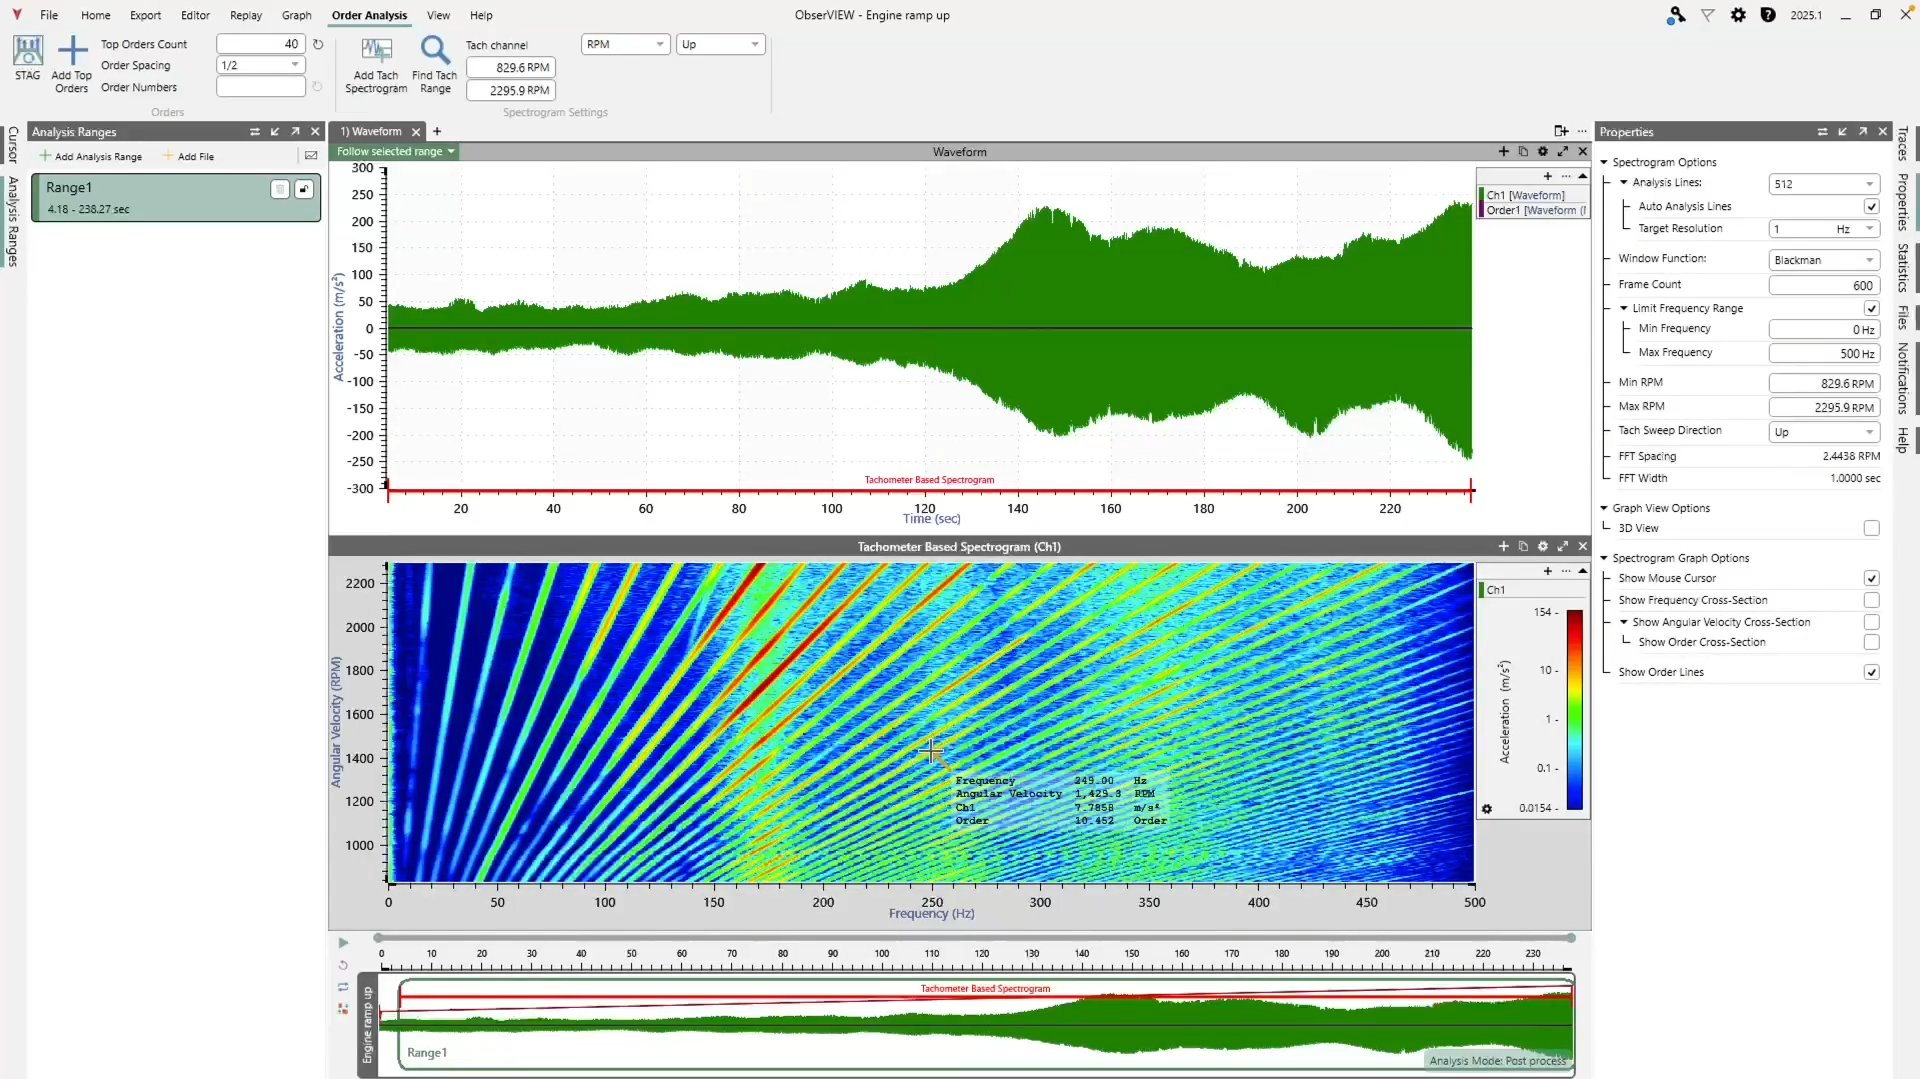
![]() Extract orders to analyze rotational or reciprocating components
Extract orders to analyze rotational or reciprocating components
Isolate and track vibration harmonics tied to RPM to assess performance or detect imbalances.
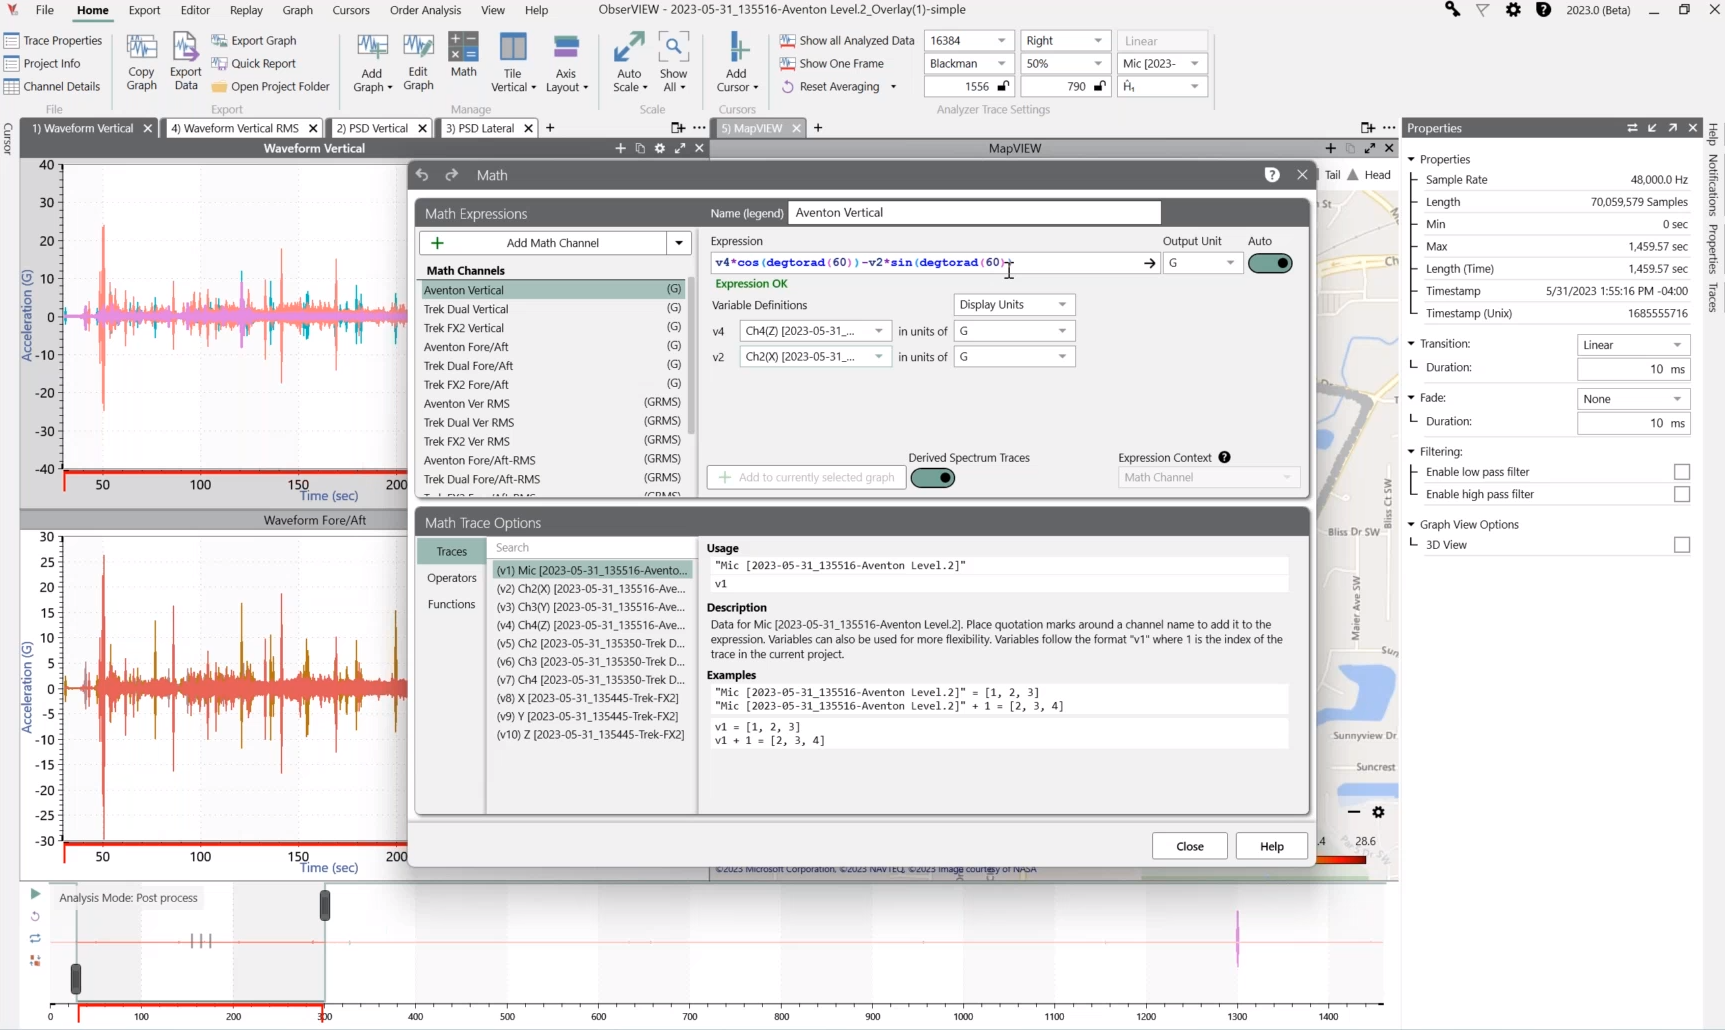
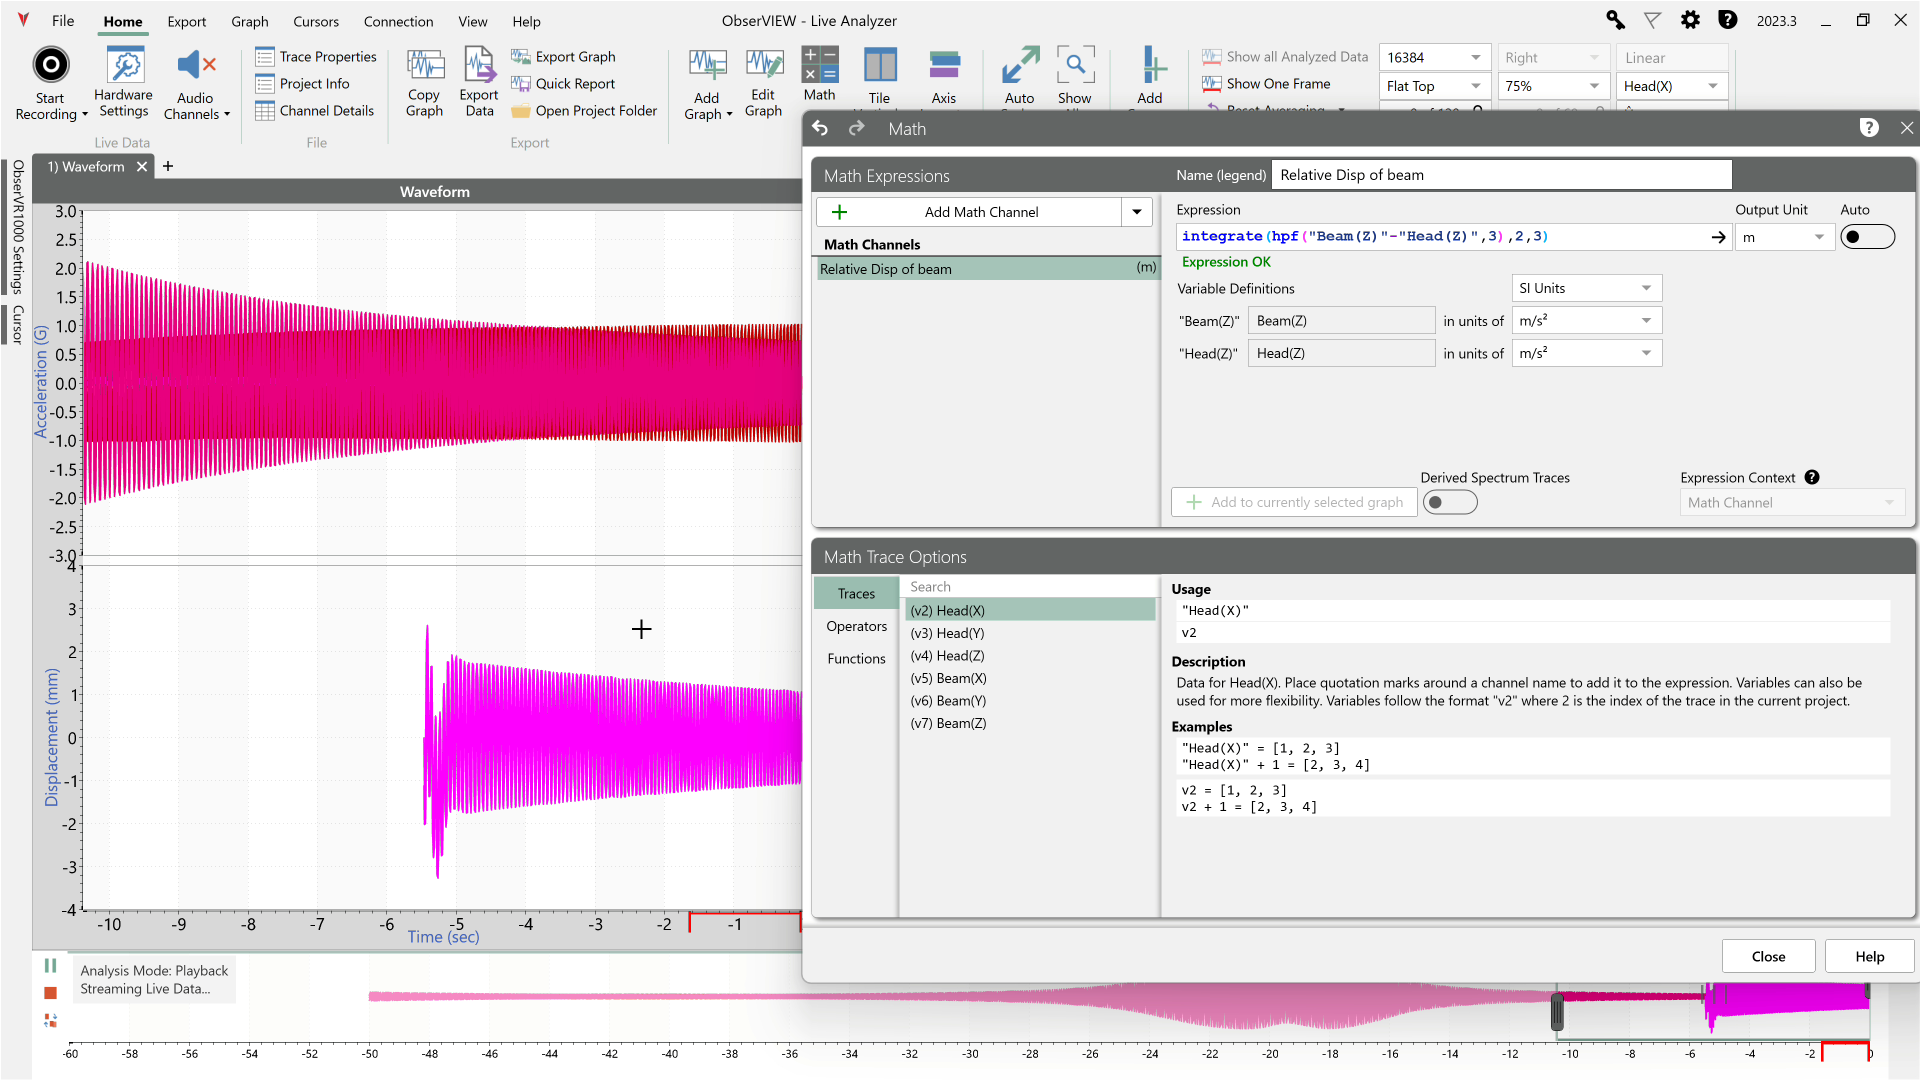
Math Traces
Your data, calculated your way
The math and statistics capabilities of ObserVIEW allow engineers to calculate custom values for their analysis. Math traces provide the flexibility of determining values for a data range and comparing them to the test data.
40 Uses for Math Traces
-
- Envelope multiple PSD traces
- Create an average PSD trace
- Scale a trace by a constant factor
- Find the ratio of two FFTs
- See All