All Software Features

Shock Response Spectrum (SRS)

Analyze, Replicate, & Validate Complex Shock

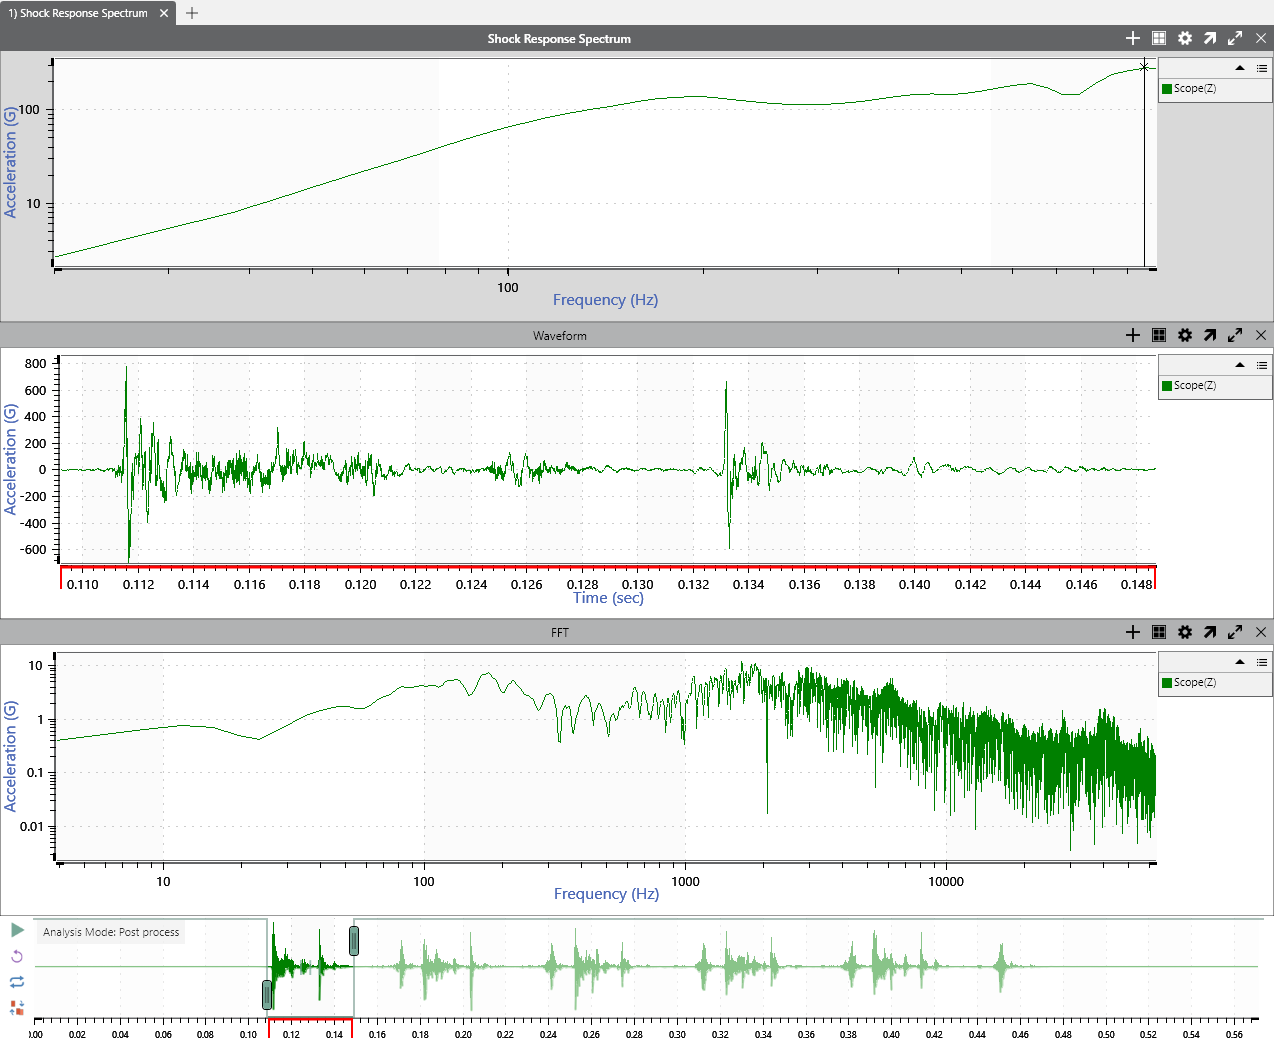
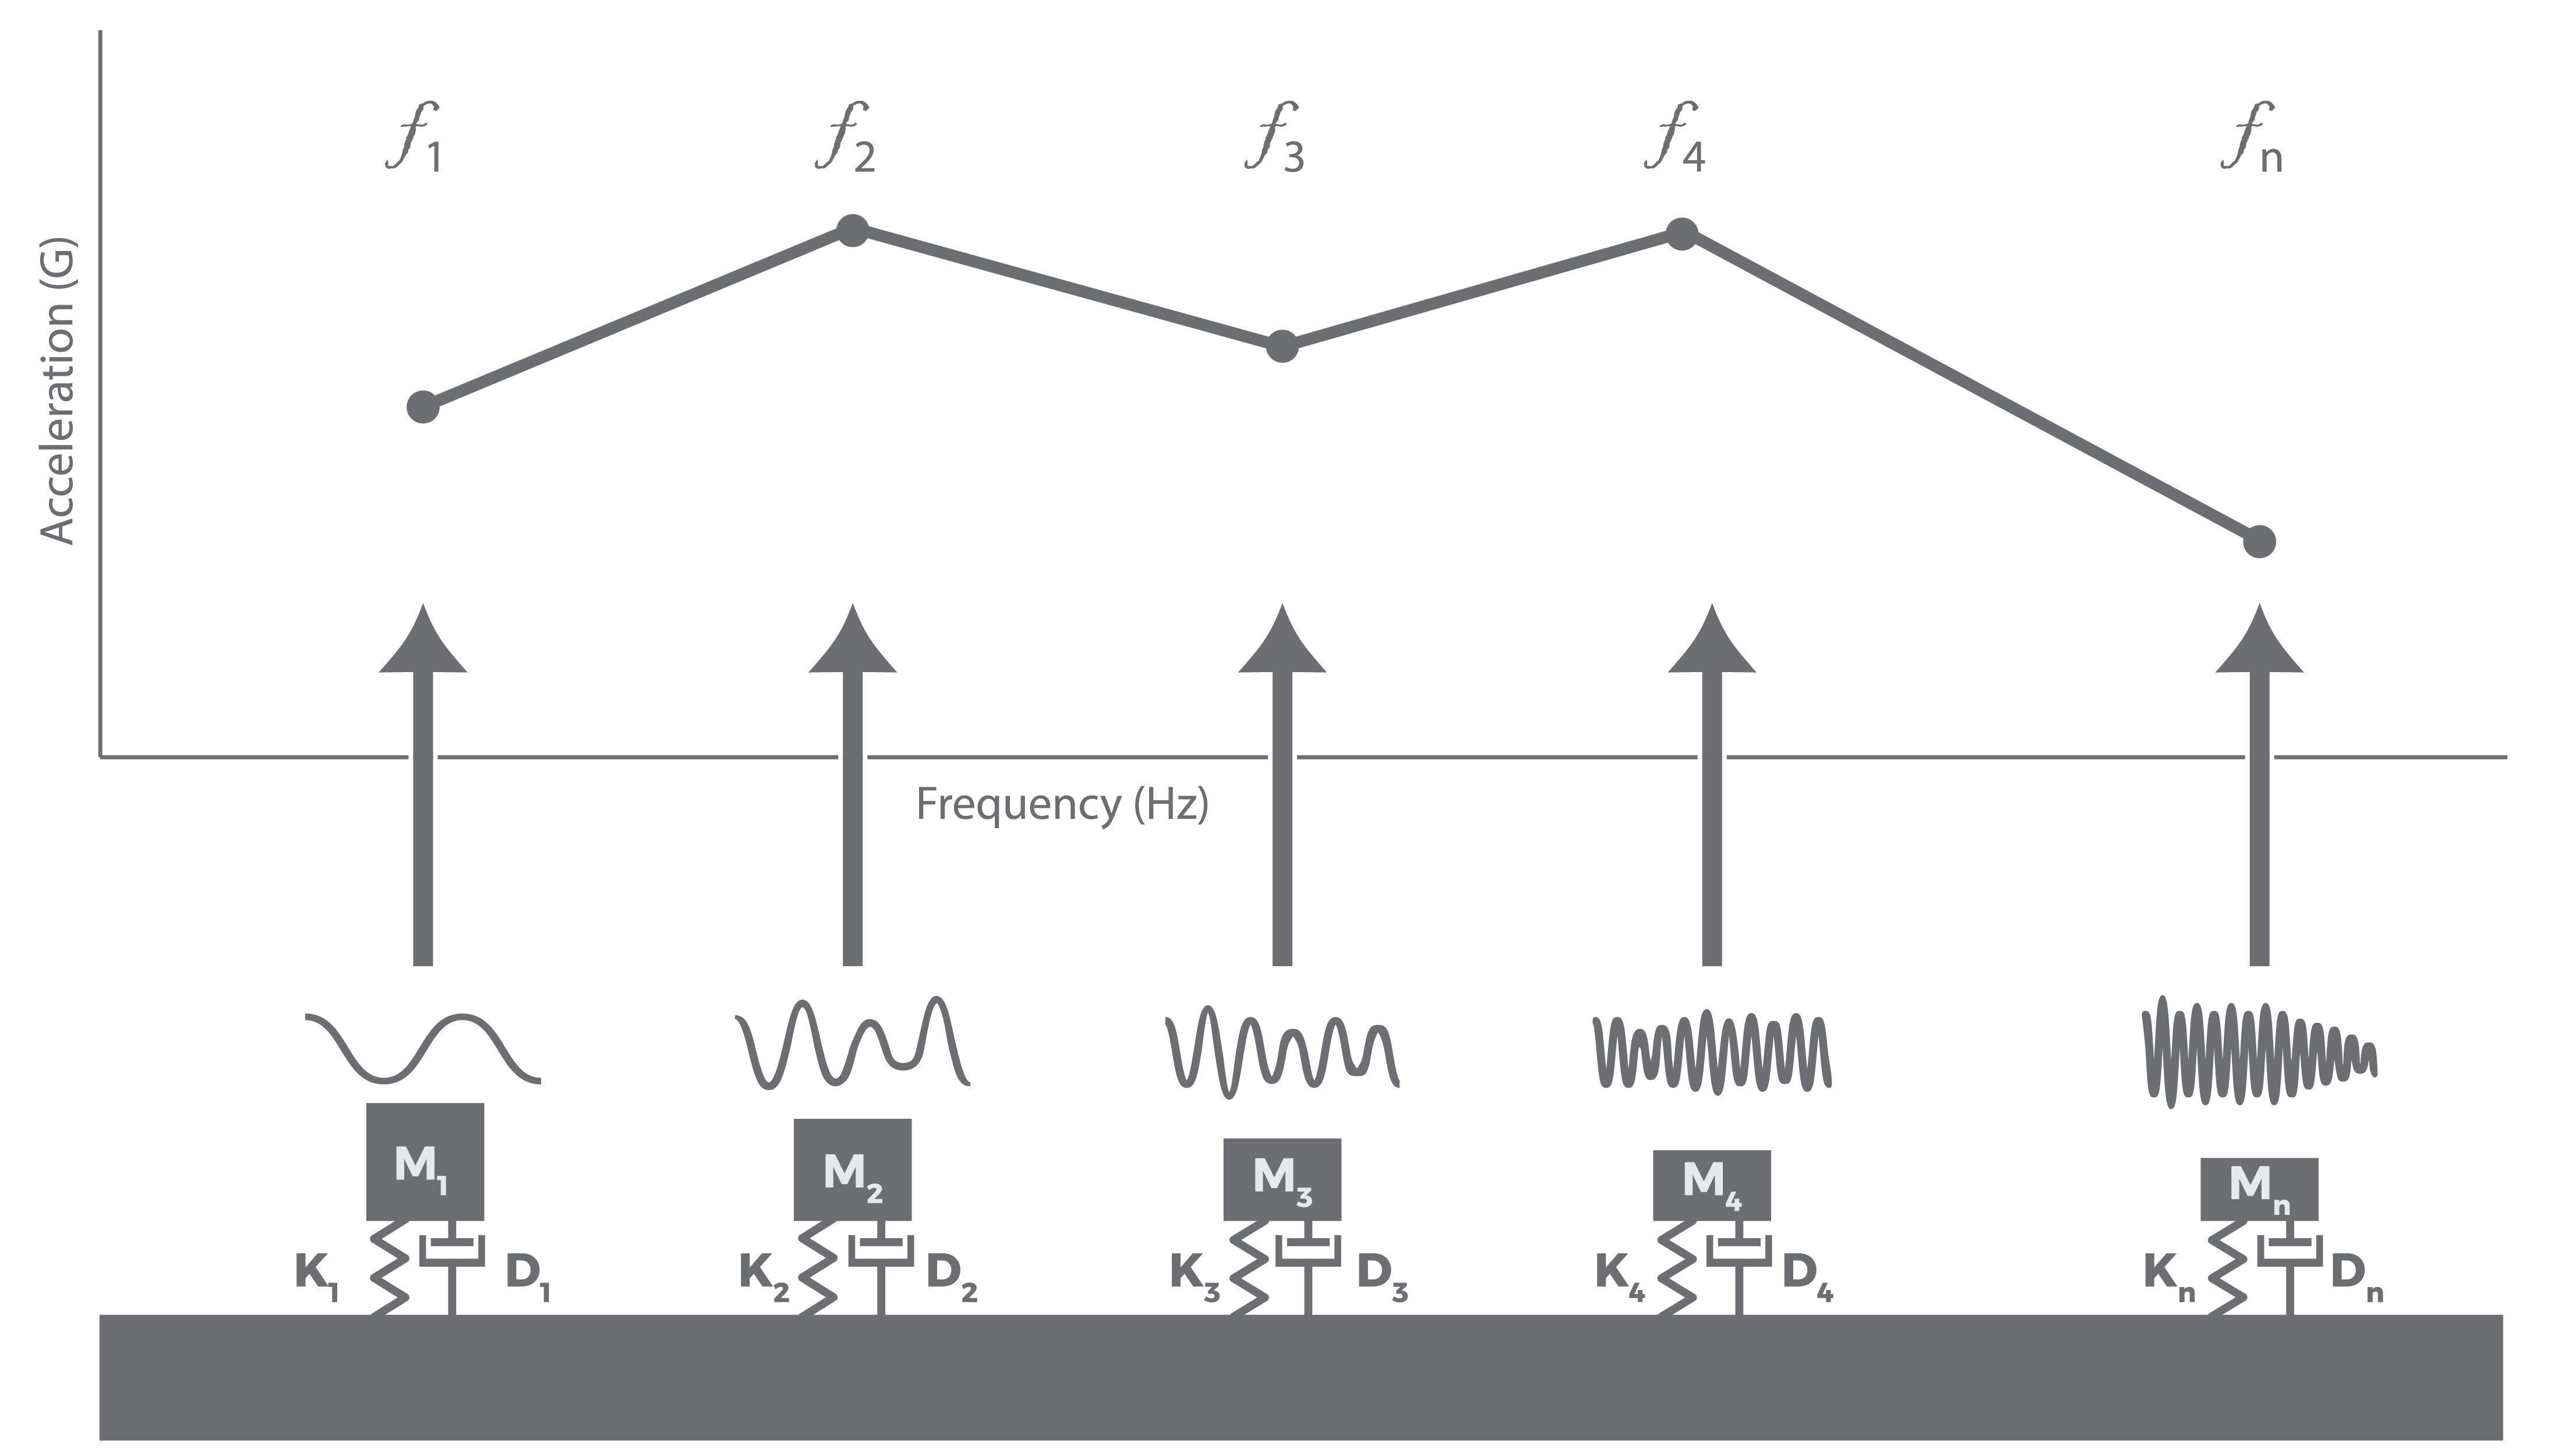
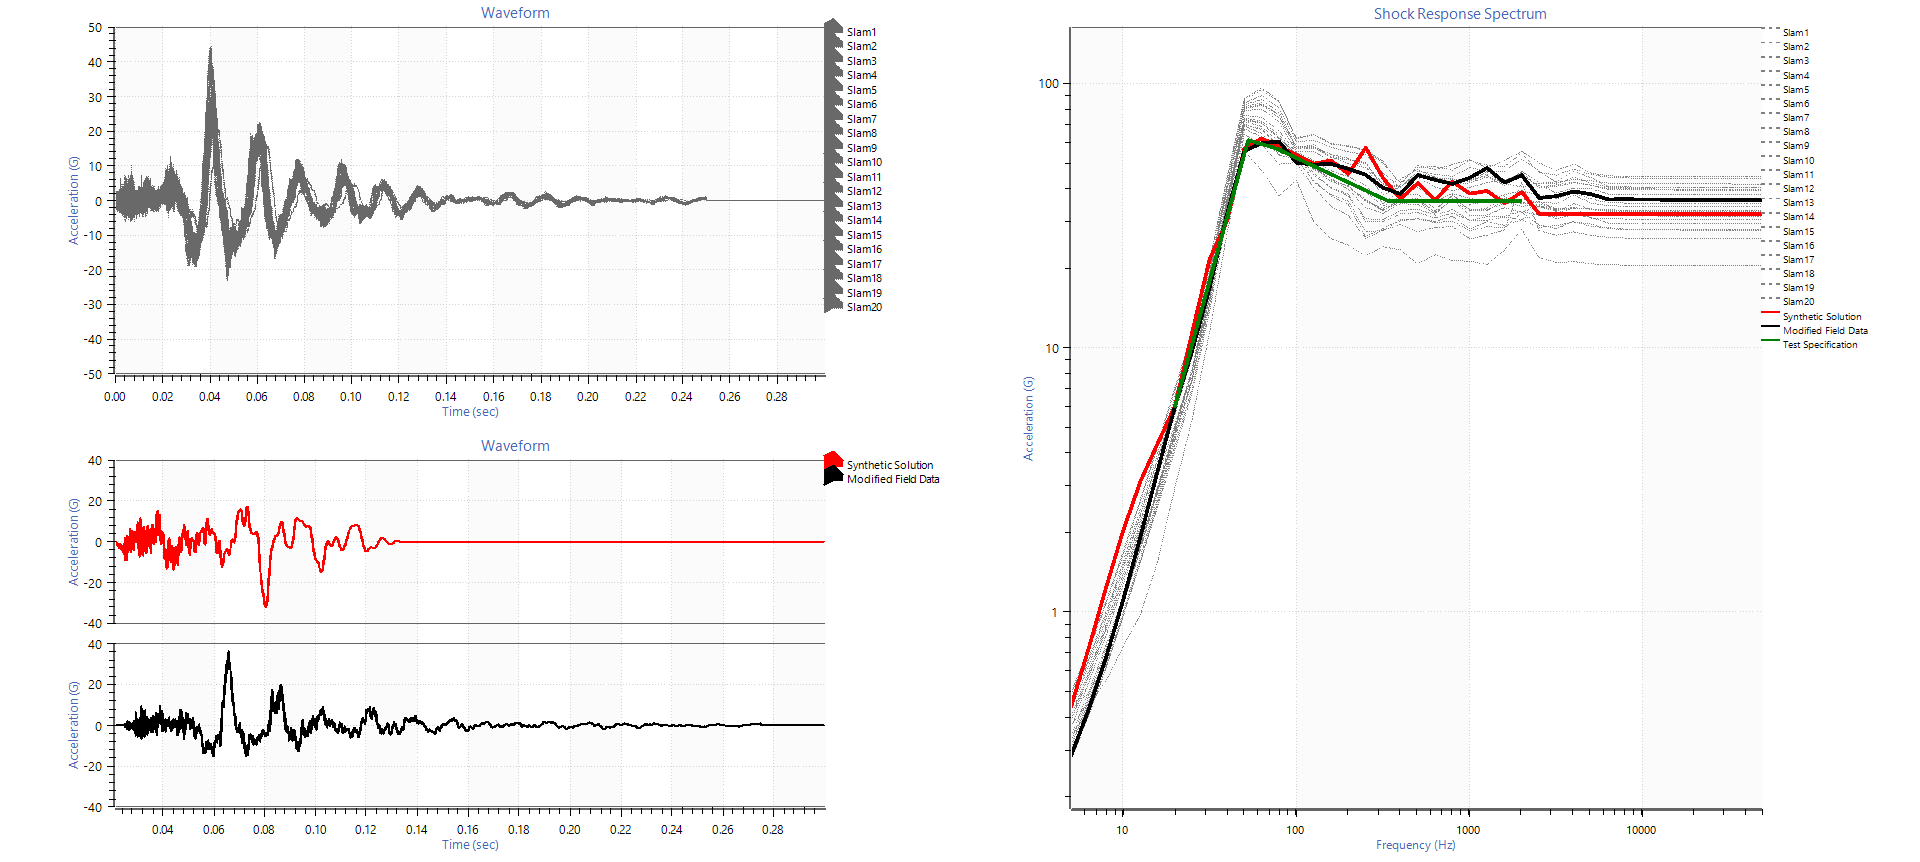
Generate a shock response spectrum (SRS) to analyze environments with complex transient shocks. Use the software to create an SRS test equivalent to the operational environment or validate an SRS test profile before running it on a shaker.

All Software Features

Analyze Complex Shock

The shock response spectrum (SRS) identifies the maximum theoretical response of a complex shock. This peak acceleration value gives insight into the potential damage of the shock pulse.

Engineers use the SRS to develop a test profile reflective of complex transient events. This innovative analysis tool allows them to look closer at a recorded shock waveform or an SRS test profile.

Example Uses of the SRS

  • Gunfire testing
  • Pyroshock and explosion testing
  • Seismic testing

Test Profile Development

With SRS in ObserVIEW, you can generate an SRS test profile from recorded data that can run on a shaker in the lab. The process takes seconds: simply copy the SRS trace and paste it to the test profile SRS breakpoint in the VibrationVIEW software.

For a more comprehensive test profile, envelope the SRS traces from multiple recorded waveforms using the software’s Math Traces feature.

Test Profile Validation

You can also use the software to validate an SRS test profile before you run it on a shaker. Use the tolerance lines feature to confirm that each pulse reaches the SRS demand and is in tolerance.

Perform the validation live by connecting the output of the vibration controller to the ObserVR1000. A live SRS with pasted traces will display the tolerance and demand lines from the test, allowing you to watch and validate the SRS test in the software.

What is the SRS?

The SRS models a time waveform using filters that are designed to mimic single-degree-of-freedom (SDOF) mass-damper-spring oscillators. It represents time data in the frequency domain.

SRS theoretical diagram

Each point of an SRS trace represents the natural frequency for each SDOF and its corresponding theoretical response. The filters the SRS applies to the time data show the magnitude of the peak response for each filter over the data’s frequency range.

The ObserVIEW software can generate three representations of the SRS:

  • Maximax trace: the absolute maximum amplitude of the SDOF filter. It is the maximum value of all the Max Positive and Max Negative SRS traces.
  • Max Positive trace: the maximum positive amplitude of the SDOF filter. It only considers response values greater than 0.
  • Max Negative trace: the maximum negative amplitude of the SDOF filter. It only considers response values below 0 and is an absolute value.

Example Uses in ObserVIEW

Measure and compare the damage of a single shock pulse versus the potential damage of multiple occurrences: READ MORE.

Analyze the output/split input of a live SRS test on the ObserVR1000 and verify that the SRS demand is reached: READ MORE.

SRS Enveloped Curve

How Can We Help You?

Contact Us