Fatigue Damage Analysis
According to Miner’s rule of damage, all structures experience fatigue when repeatedly exposed to significant stress levels, and fatigue accumulates over time.
Engineers can calculate the relative damage their product experiences in a defined period with the FDS computation. The FDS plot in ObserVIEW displays a product’s fatigue for a defined frequency range. It is a visualization and analysis tool that shows the amount of fatigue damage a product will see, whether in the lab or the field.
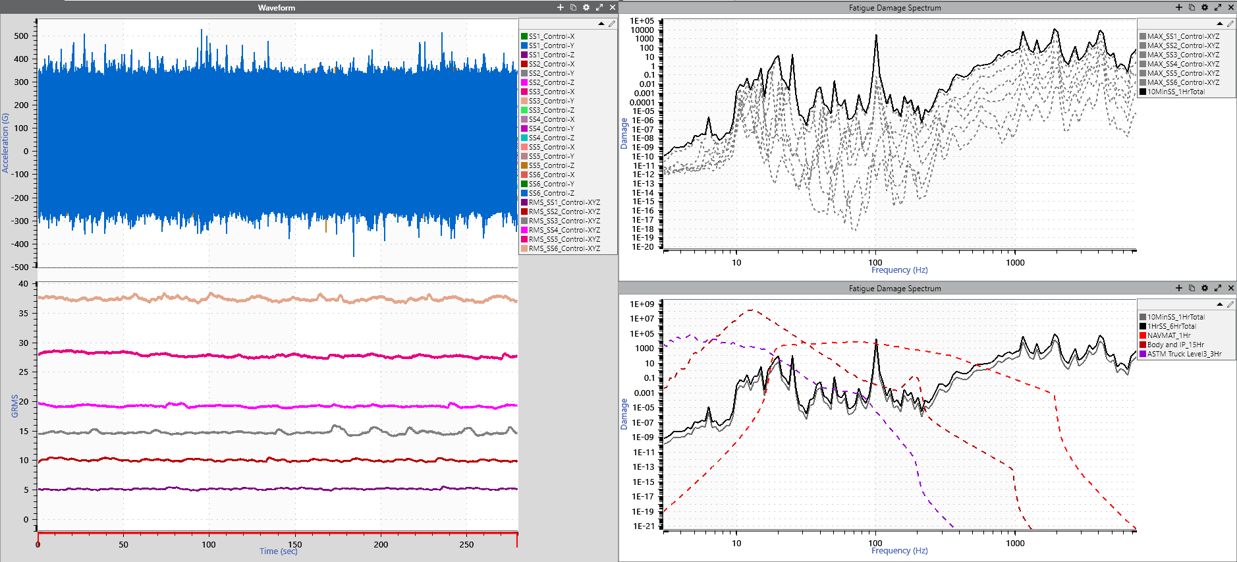
Comparison of test data to test specifications.
The FDS helps engineers design a random vibration test with confidence, ensuring that it will not inflict fatigue damage or reach the breaking threshold unless desired.
Use the FDS Plot to
- Compare multiple failure runs of a product
- Compare recorded data to specifications
- Determine if your current testing is valid or if a product is under or over-tested
- Identify potential vulnerabilities in a system
Generate a Random Test Profile
Engineers can use the FDS to create an accelerated random test profile that is the damage equivalent to the recorded environment.
With the Random Test Generation option, create a PSD test from multiple channels or files. The result is a profile encompassing some or all forms of potential fatigue. Optionally, apply the Kurtosion® Time Compression to reduce testing time without increasing energy.
The VibrationVIEW control software supports these profiles, making it easy to navigate from analysis to testing.
Kurtosis Control
Peak acceleration levels pose the highest risk for product damage. ObserVIEW’s fatigue damage settings include Kurtosion® Time Compression, which raises a vibration signal’s kurtosis above the Gaussian value of 3, increasing time spent at peak levels.
Kurtosion distributes damage across the fatigue spectrum rather than concentrating it at high frequencies. Engineers can adjust the kurtosis parameter to spend more time at potentially damaging levels and select the transition frequency for precise control.
The result is a test profile with faster, more representative damage compared to Gaussian tests.
Validate Test Acceleration
An accelerated random test must reproduce the desired levels to be accurate. The extreme response spectrum (ERS) represents the maximum amplitude response to random excitation. Engineers can use it as a tool to evaluate vibration severity.
Use the ERS to
- Determine if an FDS-correlated test profile is over-accelerated
- Upload recordings to analyze, combine the results, and determine if the test is over-accelerated
- Compare the ERS of a PSD to other ERS or SRS traces to calculate the SRS or maximax response spectrum (MRS)
Real-Time Fatigue Measurement
Real-time fatigue measurement helps identify when fatigue levels of a test profile are achieved compared to a field recording.
Review the live stream of a random test to determine when the test levels meet the reference data. Perform the analysis live or in playback mode and identify how long it takes to reach real-life fatigue levels.
With the FDS Live Feature you Can
- Determine Mounting Location: Review the table’s distribution of potential damage to determine where to mount the product
- Verify Test Adequacy: Compare your test’s stress levels to a reference value. In live or playback mode, confirm that the profile meets or exceeds the reference demand
- Predict Product Fatigue: Display how much damage the device under test would incur if tested for a target lifetime
Download PDF
Projected Fatigue Damage
Generate a random PSD test profile with projected fatigue damage. Similar to peak hold, the software displays the maximum value of the underlying trace compared to previous data. Once the PSD reaches the desired fatigue damage, copy the PSD to VibrationVIEW to run the profile as a test.
The Projected option displays an FDS projection using a target lifetime or target life passes. It shows how much damage the device under test would incur if tested for the given period/passes.

Estimate HALT/HASS Fatigue
The live FDS feature allows engineers to quantify the damage at the various points of a HALT/HASS table. They can view a live stream of data to determine when the product has accumulated sufficient fatigue at the frequencies of interest or when the test levels have met or exceeded a reference value. Learn more.
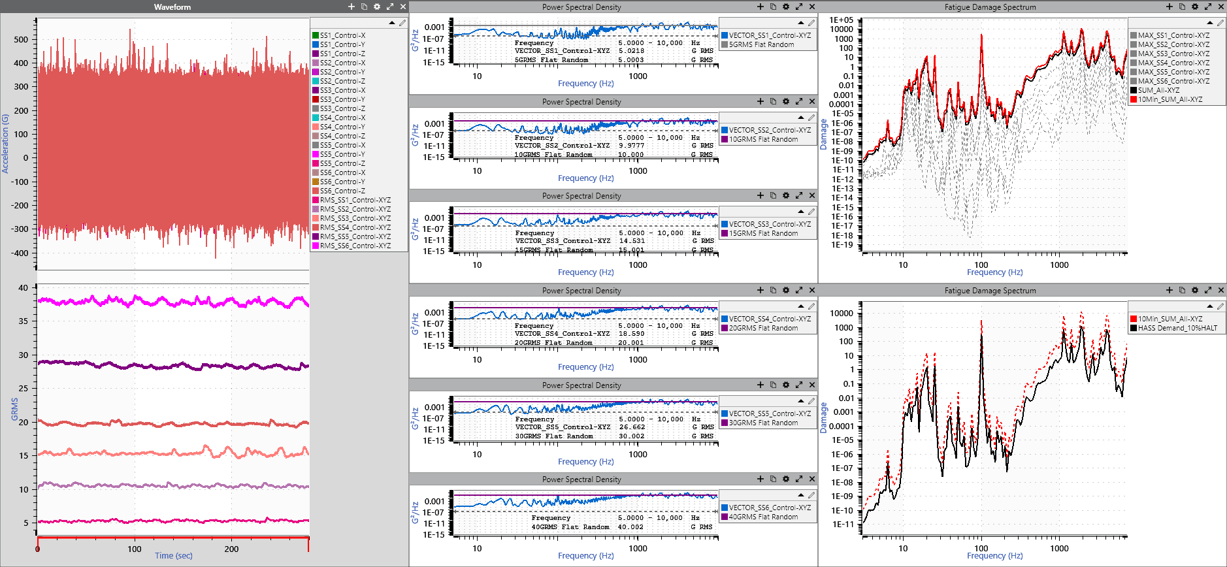
Calculation of HASS demand from HALT data.
Rapid Failure Mode Precipitation Testing
Rapid failure mode precipitation testing (RFMPT™) is a test to failure that engineers can use at any time throughout their product development cycle, from proof of concept to post-production verification and validation. As a test-to-failure, RFMPT demonstrates a product’s robustness to harsh end-use environments and customer use. As an integrated process of a product development plan, it is an efficient and cost-effective way to track reliability growth.
 RFMPT can identify design weaknesses at any point in the product development cycle, whether early in the concept phase, to uncover manufacturing defects before full production, or for continuous improvement after the product is in the field. Learn More.