User-defined Traces
Math traces opens many opportunities for signal analysis. This feature allows the user to add a math equation to a time or frequency-domain graph, creating a new trace alongside the original data. Users can create virtual channels in the time domain, combine input channels, manipulate input channels separately, and much, much more.
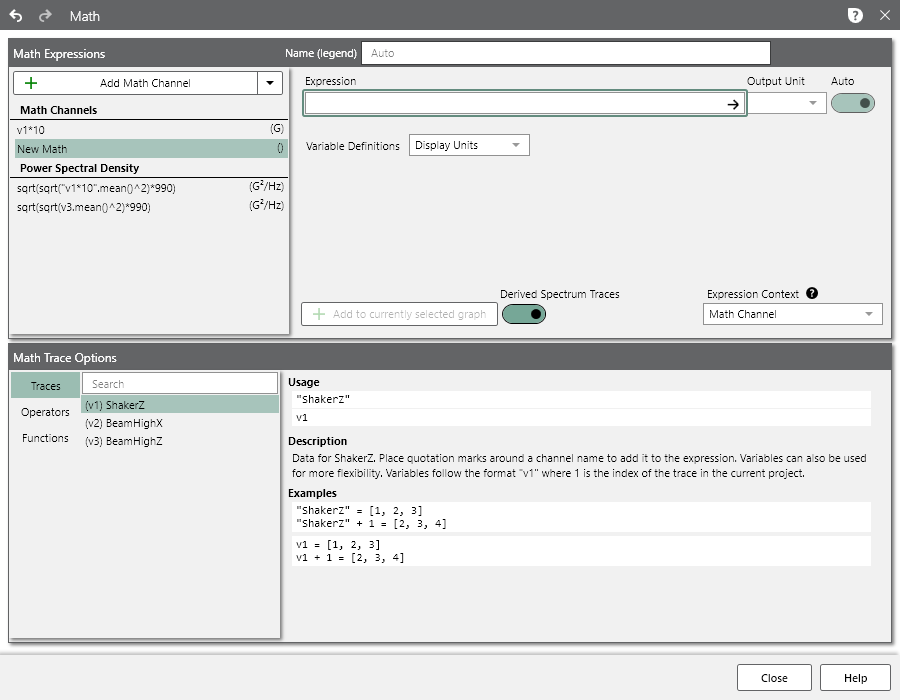
ObserVIEW Math is a free entry field that builds a trace by applying functions/operators to existing trace data.
40 Uses for Math Traces
Vibration Research engineers created a list of applications to get started, but the uses for math traces are numerous and applicable to many industries. Curious about how to implement a math trace for a specific analysis? Contact us!
- Envelope multiple PSD traces
- Create an average PSD trace
- Scale a trace by a constant factor
- Find the ratio of two FFTs
- …
40 Uses for Math Traces
User-friendly Interface
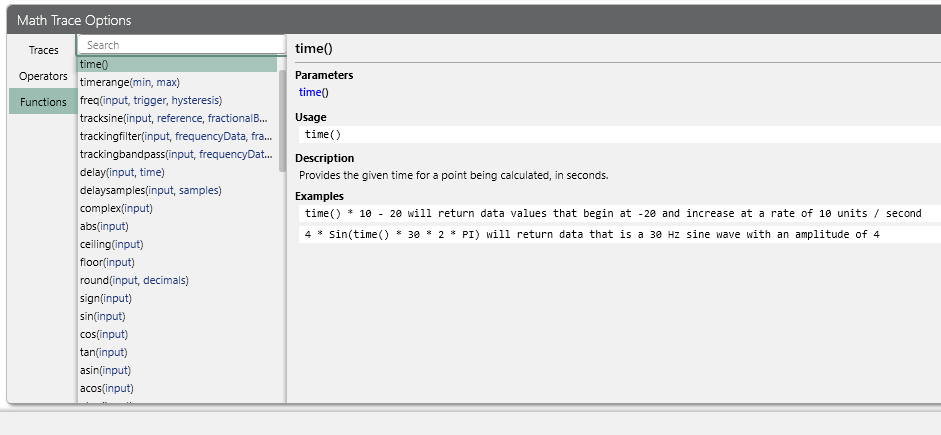
The math dialog includes the list of available math trace functions, including examples of use.
Math Trace or Channel?
Math traces applied to a time waveform graph are math channels. Math channels are unique because the user can create spectrum traces from them, such as an FFT or PSD.
- Math channels allow for per-channel filtering, channel combining to create new channels in units of angle, or creating synthesized waveforms.
- Math traces allow for templated spectrum math analysis: create an envelope or average PSDs, create trace ratios for comparison, analyze average control on recordings, or compare data to pasted tolerance lines. Frequency-domain math traces can reference data ranges and data sources in their functions.
Virtual Channels in the Time Domain
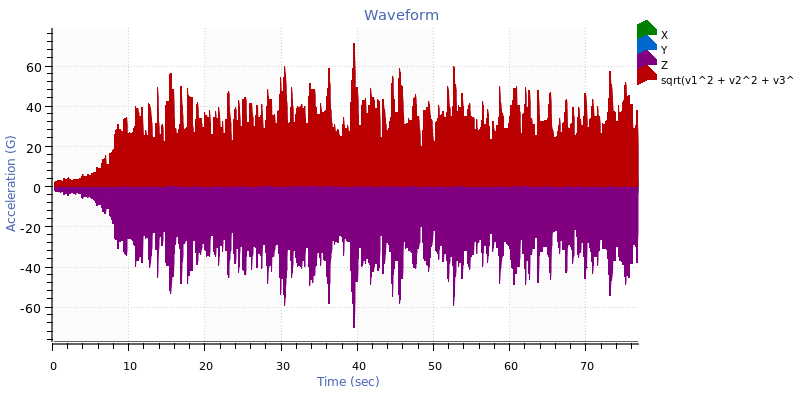
The ability to create virtual channels is an exciting feature unique to ObserVIEW math. Users can manipulate time-domain math traces like any other input channel and create a spectrum trace from the data, such as an FFT or PSD.
Example: sqrt(v12 + v22 + v32)
The expression sqrt(v12 + v22 + v32) calculates the absolute acceleration of a triaxial accelerometer.
Manipulate Channels Independently
In ObserVIEW, users can apply a filter to, integrate/differentiate, etc., all data in a graph. With math traces, they can manipulate just one input channel among many. For example, the user can apply a high-pass filter to one input channel with low-frequency data to only view data of importance.
Time-history Statistics
Users can add statistics to their time-history graphs, such as mean, standard deviation, skewness, and kurtosis. Statistics can help them confirm the validity of a recorded waveform, verify the data, or develop tests for vibration control. To view the statistics on a separate plot, they can create a user-defined unit.
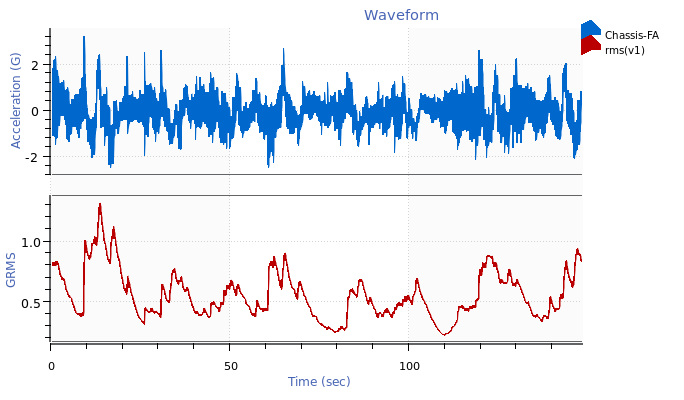
Example: rms(v1)
The expression rms(v1) calculates an exponentially rolling RMS of a waveform.
Examples
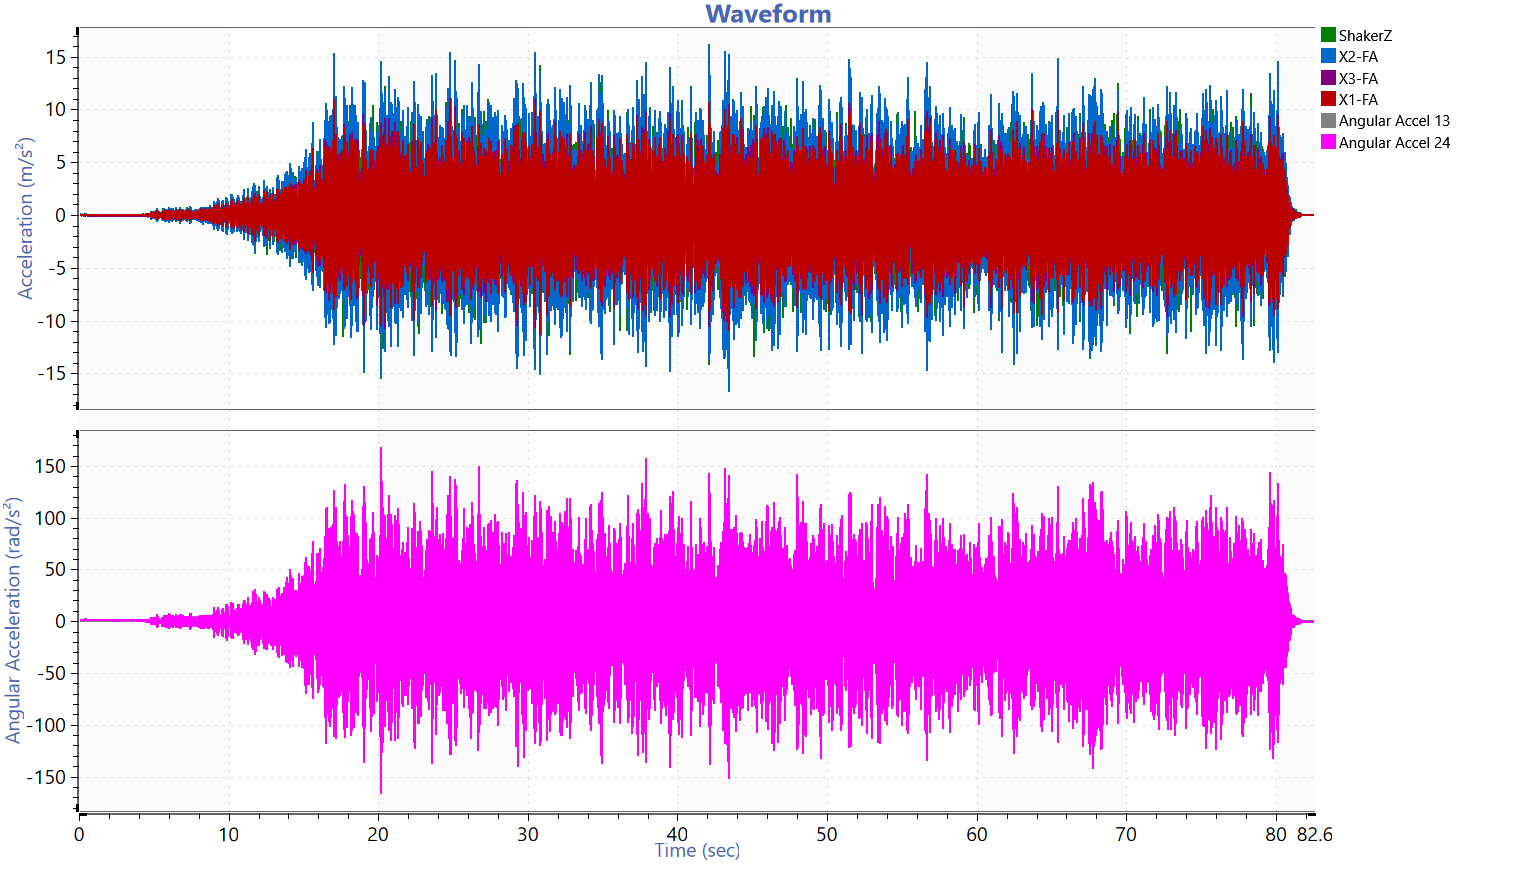
GMW14201 Mirror Evaluation
Using math traces, an engineer can calculate the dynamic rotation, or total angular acceleration, of the mirror following the GMW14201 random test.
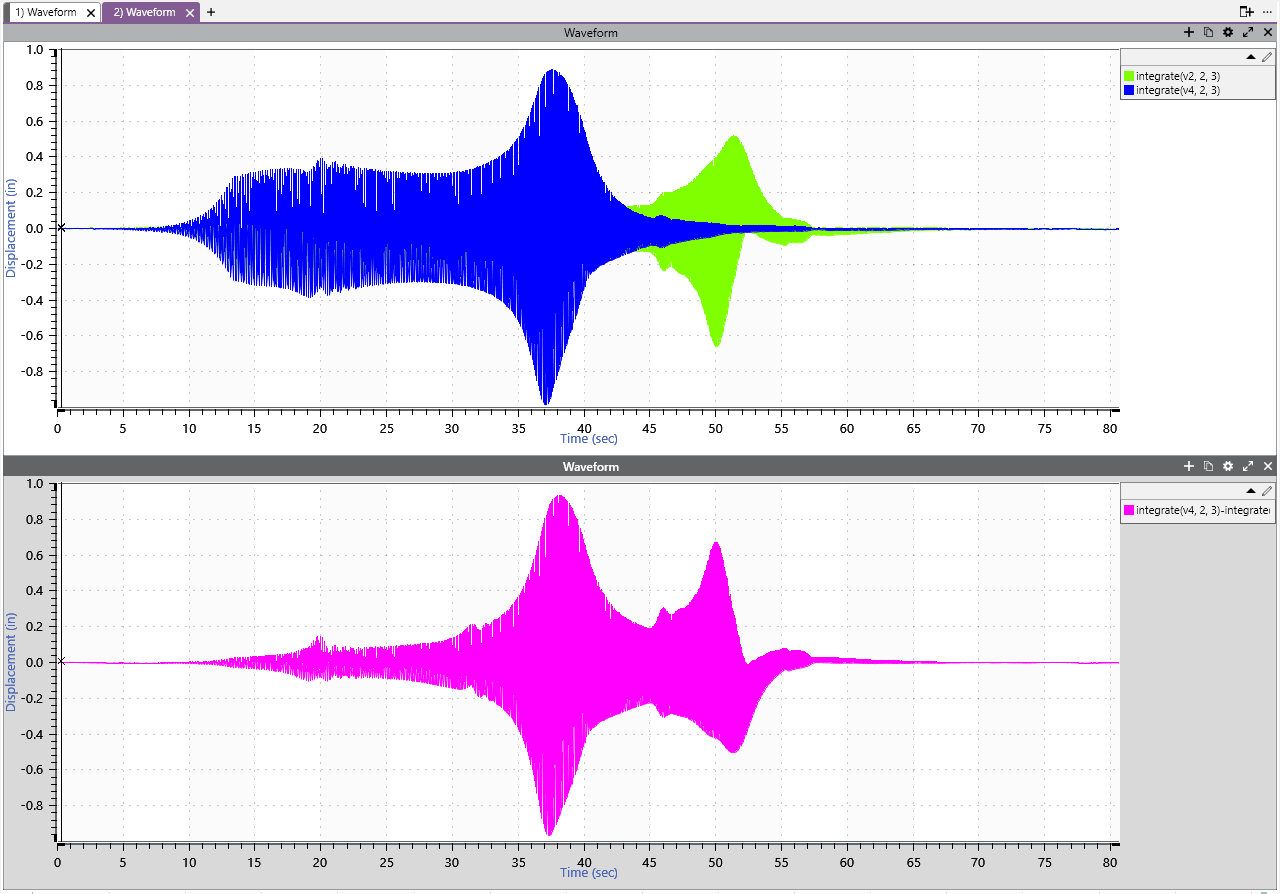
Calculating Relative Displacement
ObserVIEW math can calculate the relative displacement between two channels post-process.
Performing this calculation post-process allows the user to view the two channels in relationship to each other and accounts for all the frequencies when calculating the relative displacement. Learn more.