Why Order Analysis Software?
Order analysis is a technique used to analyze the noise and vibration of machines with rotational or reciprocating components. It helps differentiate the rotational source compared to random vibration in the overall output.
Analysis of rotating machinery can help define resonances and excitations and identify patterns.
Environments to Analyze
- Engine ramp-up/coast down
- Engines, gear boxes, transmissions, turbines, pumps, motors, etc.
Extract & Analyze
The ObserVIEW Order Analysis software extracts orders of interest from recordings with a defined tachometer (angular velocity) channel. It separates the rotational content from the background random, then employs a tracking filter to remove unrelated data.
You can manually select the orders or allow the software to select the orders with the highest peak acceleration levels within the analysis range. You can also manually add/remove orders as a comma-separated list.
Live or Recorded Data
Frequency versus angular velocity (RPM) data can be processed in real-time with Live Analyzer or recorded for post-processing.
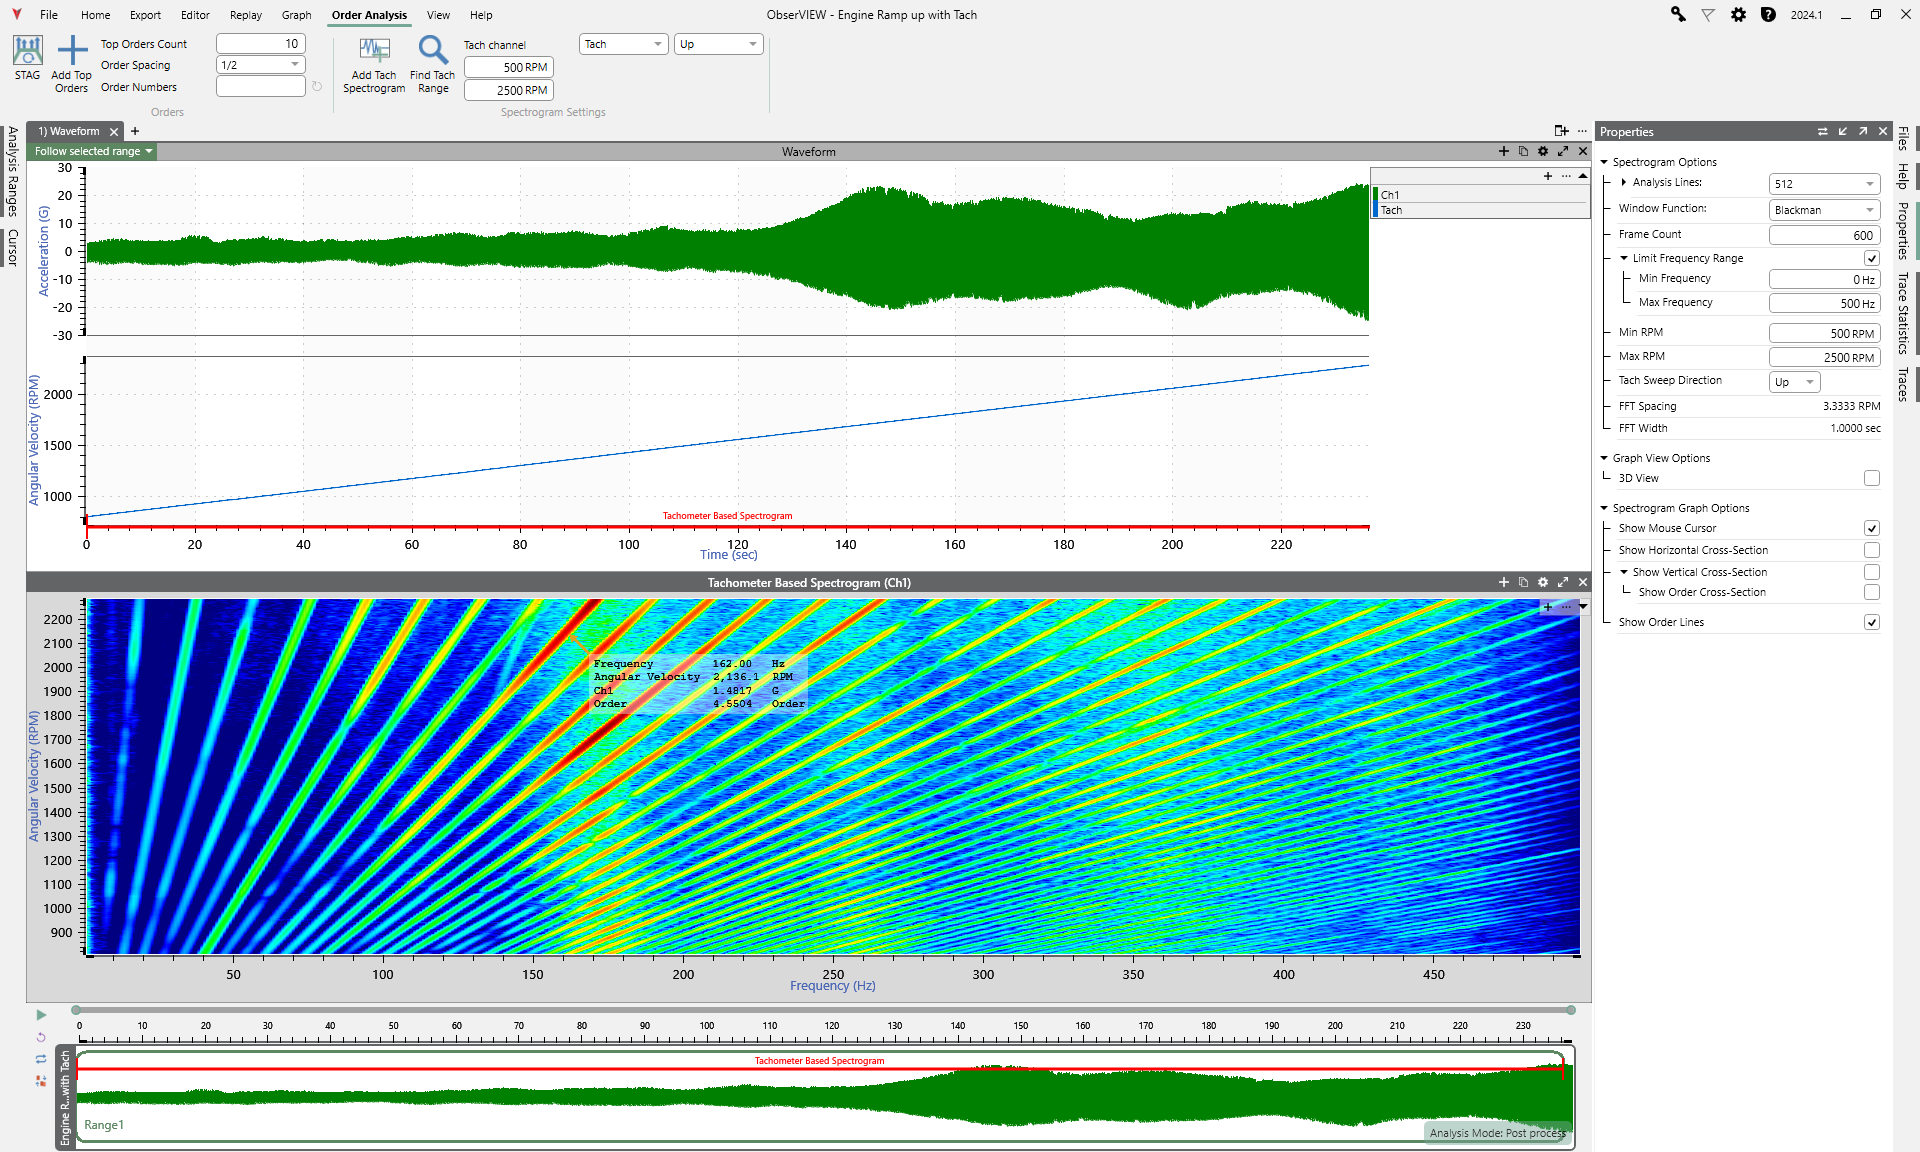
Tachometer-based Spectrogram

The software automatically adds a tachometer spectrogram, if one is not already open, so the selected orders can be highlighted. A spectrogram displays the strength of a signal over time/angular velocity at various frequencies. With time- and tach-based spectrograms, you can analyze/manipulate the data and compare amplitudes.
- Limit the tachometer range of the spectrogram
- Configure the tachometer sweep direction to reflect the trace sweep
- Automatically find the minimum and maximum values
How it Works
Orders are frequency measurements (Hz) that correspond to the reference RPM and its harmonics. When the reference RPM changes, so do the order values.
The Order Analysis software captures a reference RPM signal and correlates it to the vibration on the rotational equipment.
Engineers perform a run-up or coast-down that steadily increases the RPM as a sweep. Order Analysis generates a plot of the frequency response versus angular velocity (RPM). This frequency-domain data can be processed in real-time or recorded for post-processing.
Among other purposes, order analysis determines which part of the vibration is generated from the rotational source compared to some random source.
STAG Software
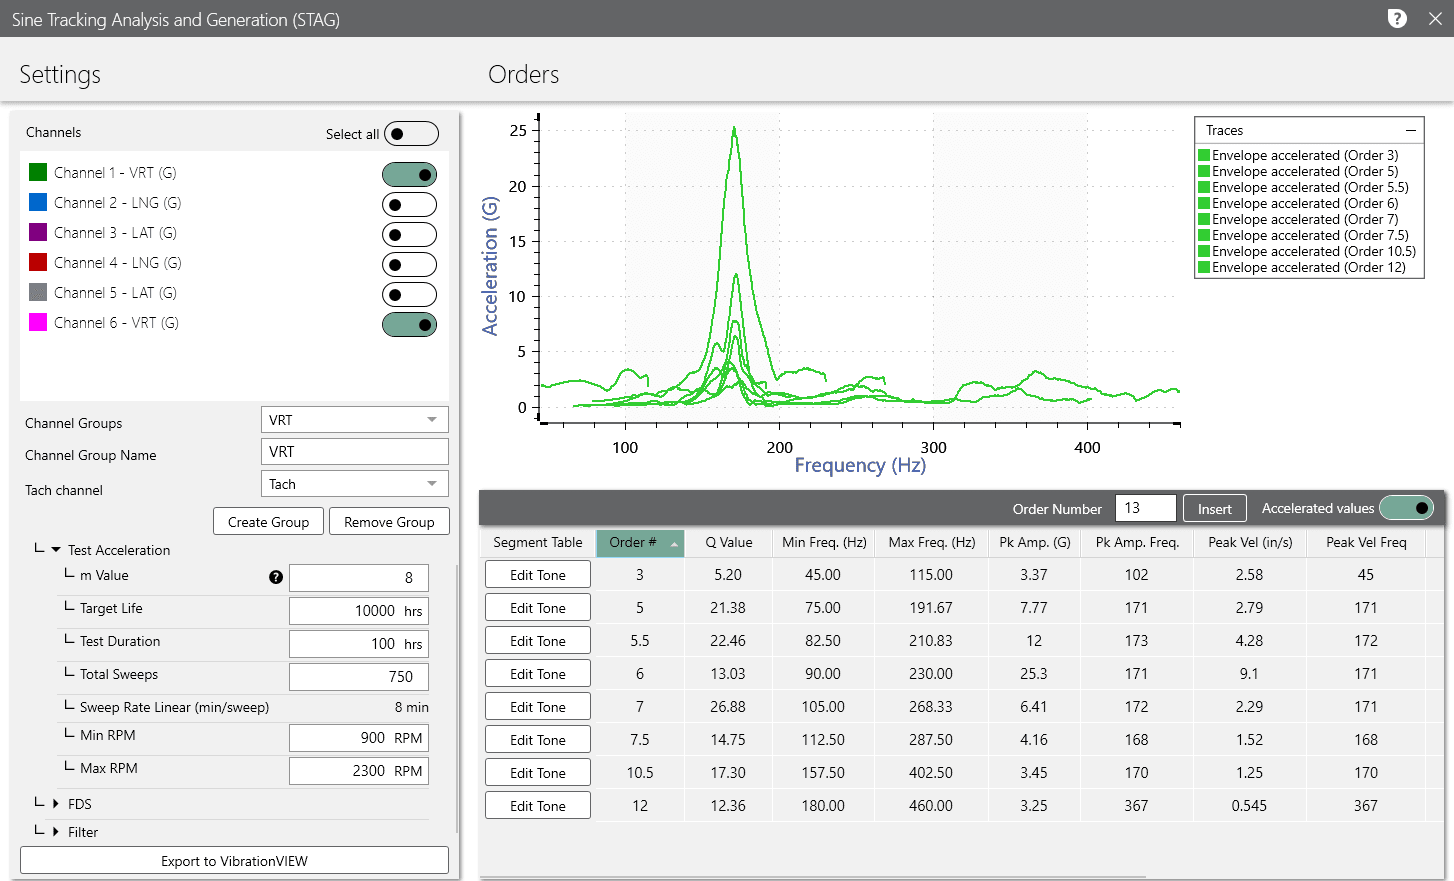
Activate the Order Analysis and FDS licenses and access the tools to effectively analyze field data with dominant rotational or sinusoidal components. Quantify noise and vibration in rotating machinery with order analysis, the recently developed Sine Tracking, Analysis and Generation (STAG), and more. Develop tests and analyze data with software tailored for rotational equipment.
- Short processing time
- Automated profile development
- Simplified process to reduce error
- Create detailed sine profile test segments based on order-tracked data
STAG Software
Sine-on-Random Test Generation
STAG uses order analysis and extraction and sine tone profile creation and acceleration to isolate, extract, and create an accelerated sine profile or series of sine profiles from a recording. It employs the FDS software to analyze the remaining random vibration.
In combination with FDS, STAG allows for the analysis, generation, and acceleration of a realistic SoR vibration test.