Math Channels on Time Data
Filter and Combine Traces
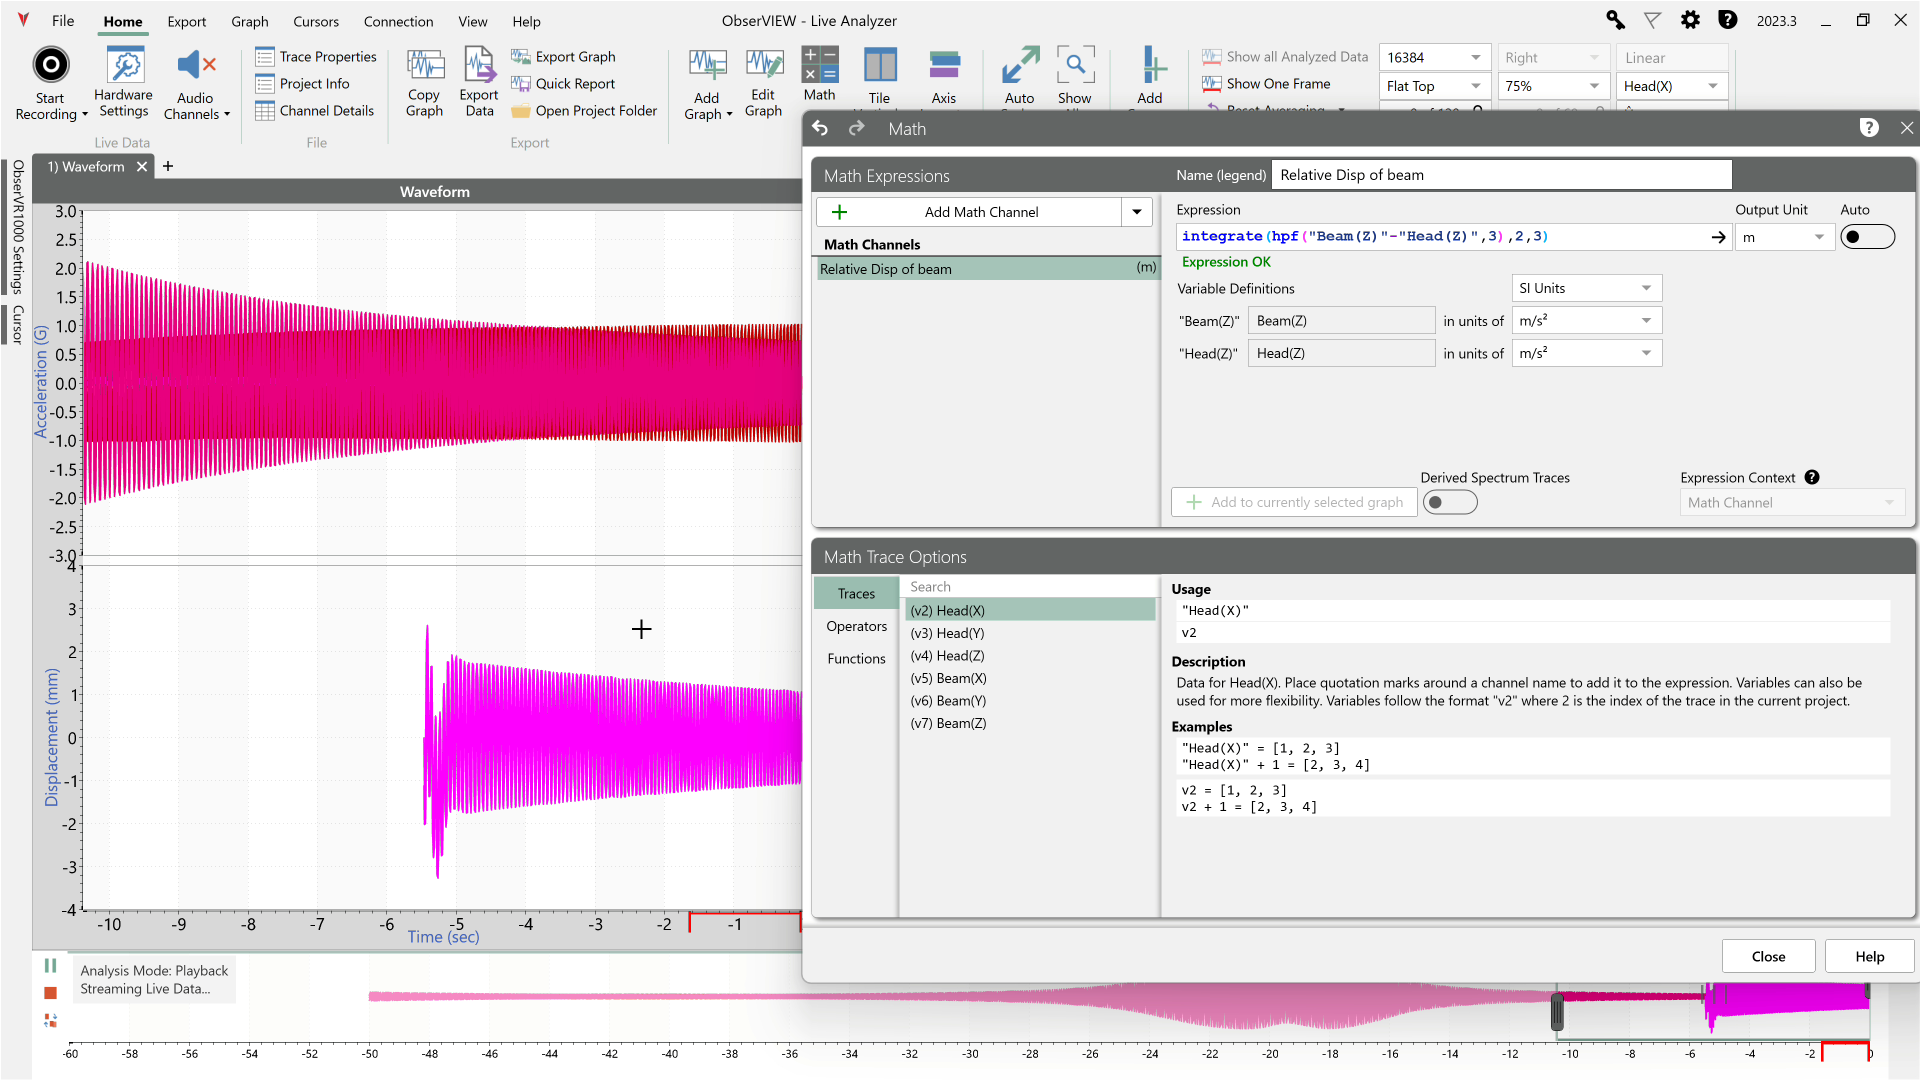
The Math feature plots a user-defined math equation on a time or frequency-domain graph. It allows the user to implement custom math operations not defined by the current graph types.
Live Math Channels
In versions 2023.3 and newer, engineers can apply the power of math traces to live data. In Live Analyzer, the software can calculate the math trace in real-time as the data records.
Custom Modal Setup
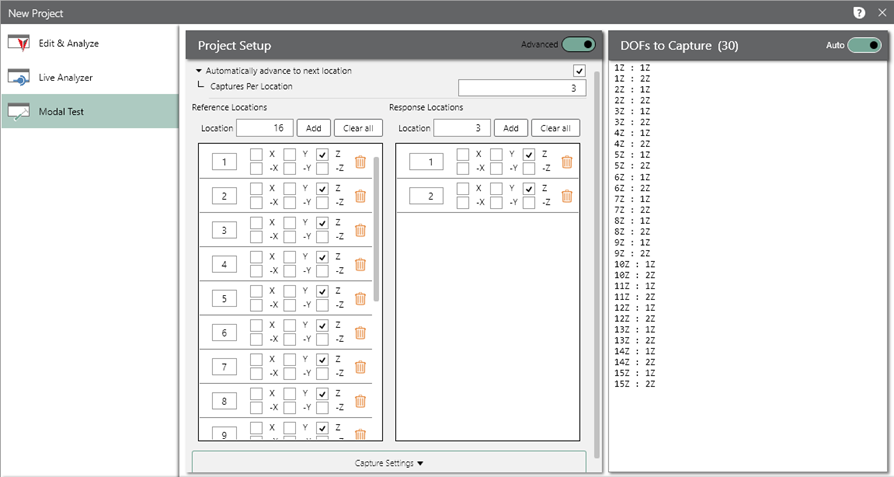
The Modal Testing software now includes an advanced project type. The user can select different response locations/directions for each reference, essentially combining the roving hammer and roving accelerometer methods in one project.
Graph Pages/Docking Layout
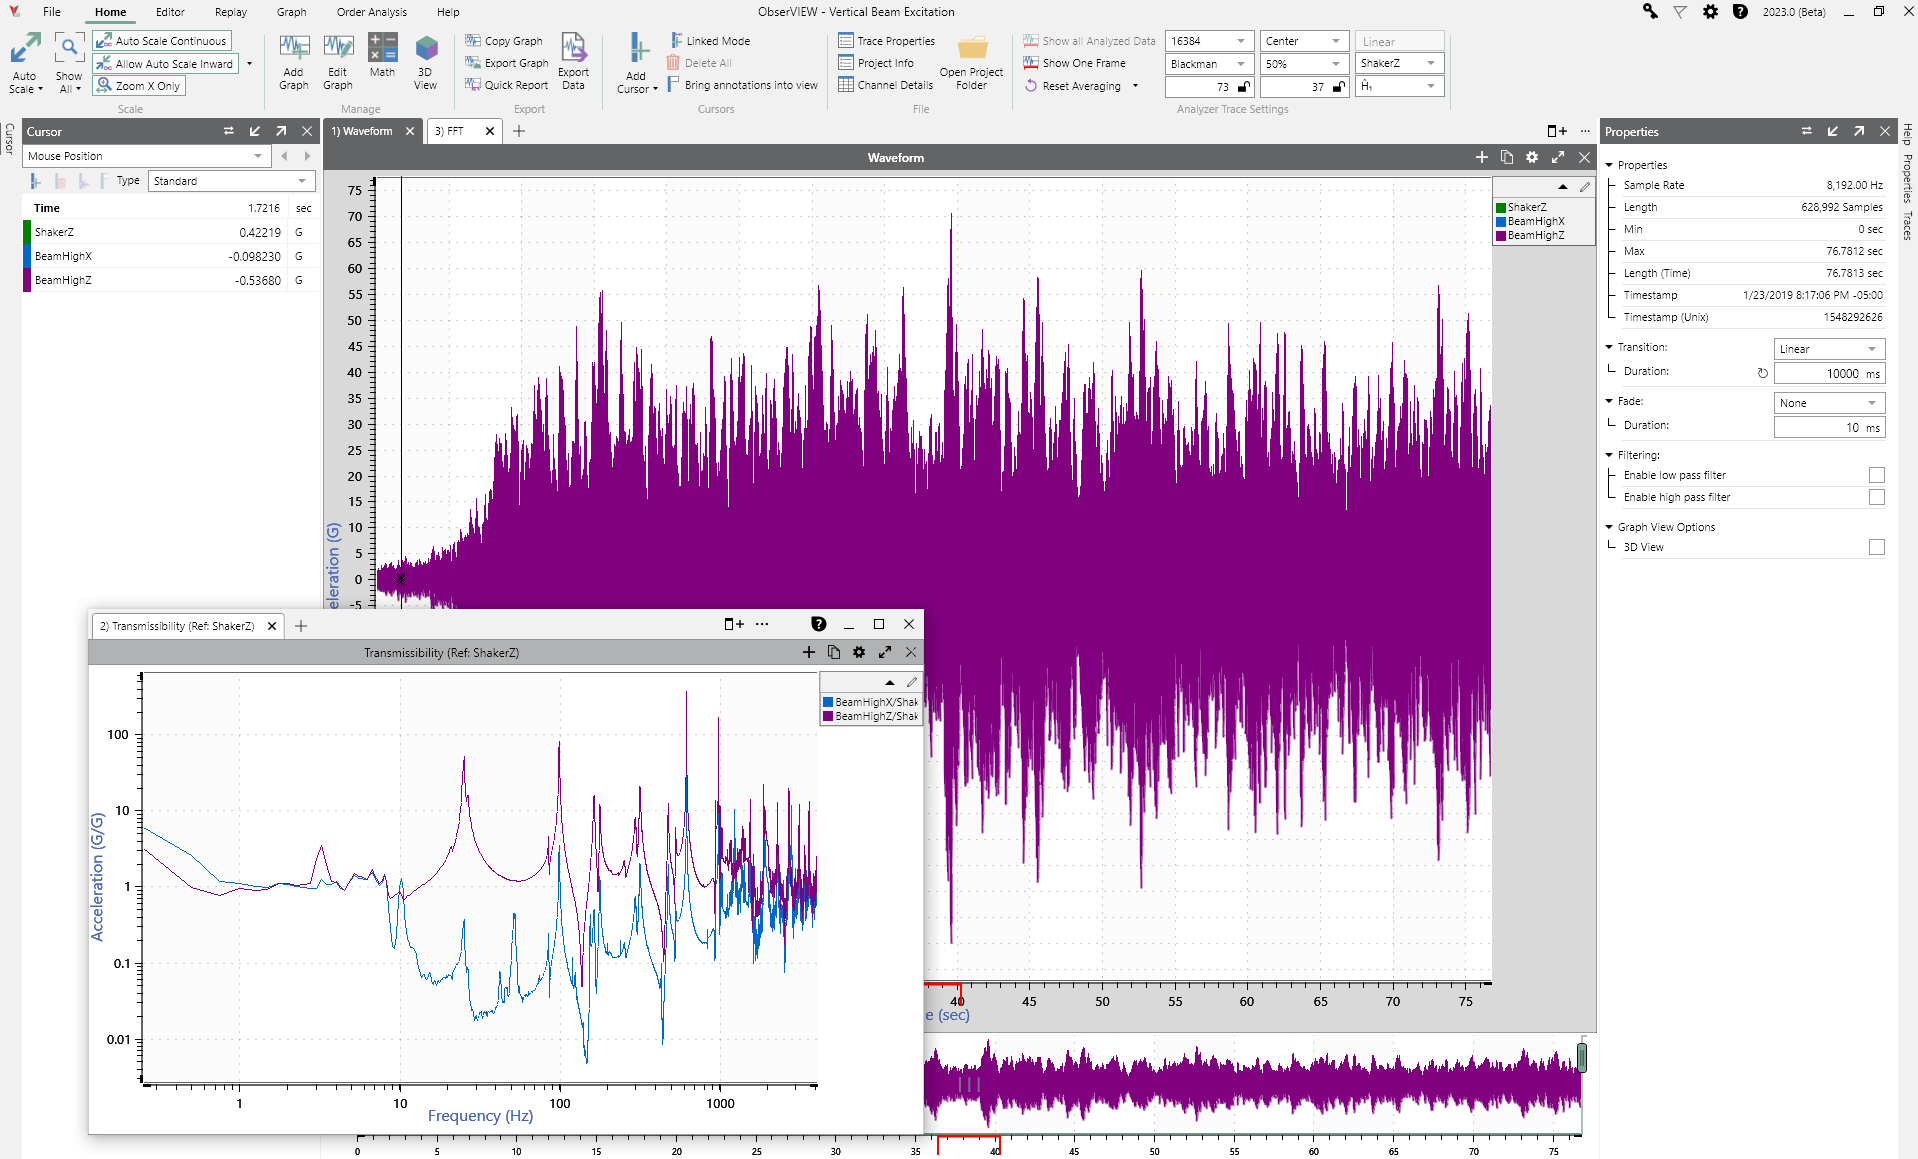
The software now organizes graphs as tabs in the main graph layout for better graph visibility and organization. The user can make isolated changes to graphs in different tabs or monitors, and the software saves the main graph layout.
Improved Cursor Computation of Statistics
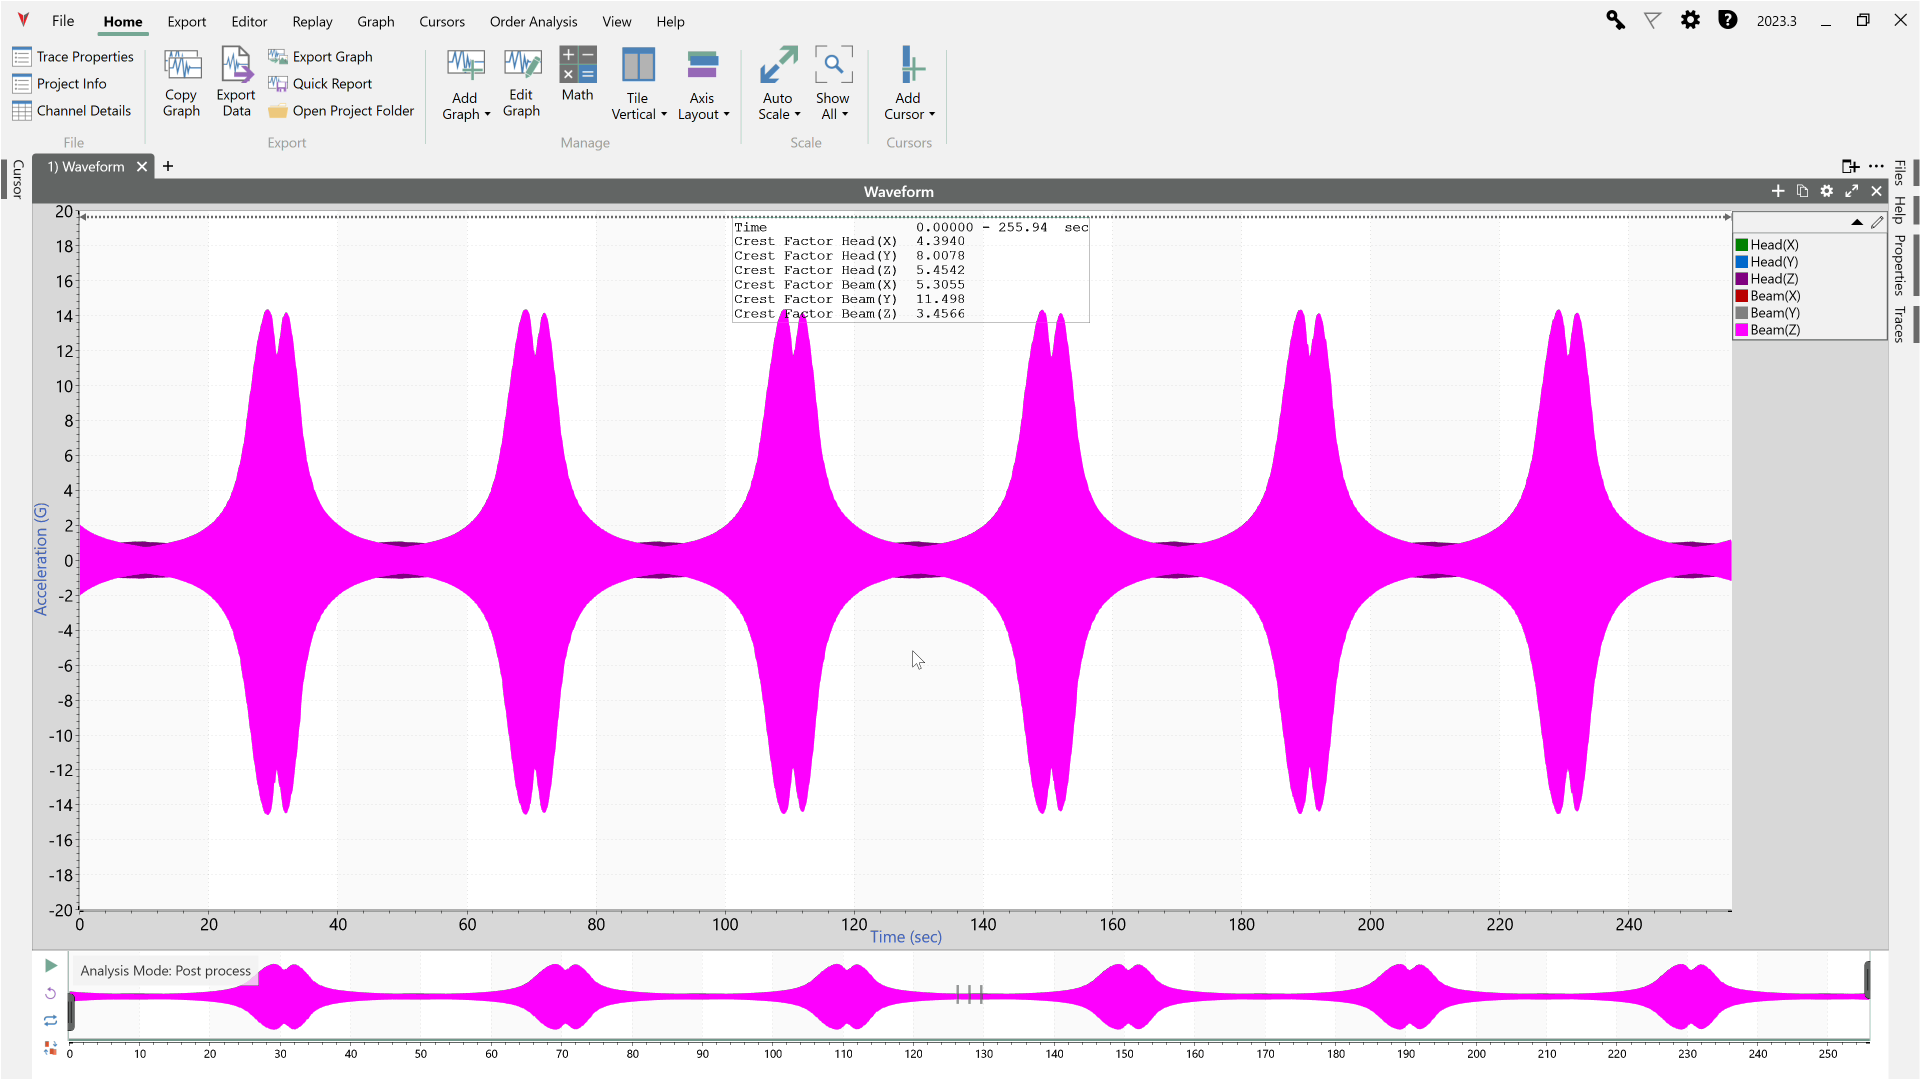
In the 2023.3 release, cursors can calculate statistics like mean, RMS, and kurtosis more quickly and over any time span.
Record to Disk in Live Analyzer
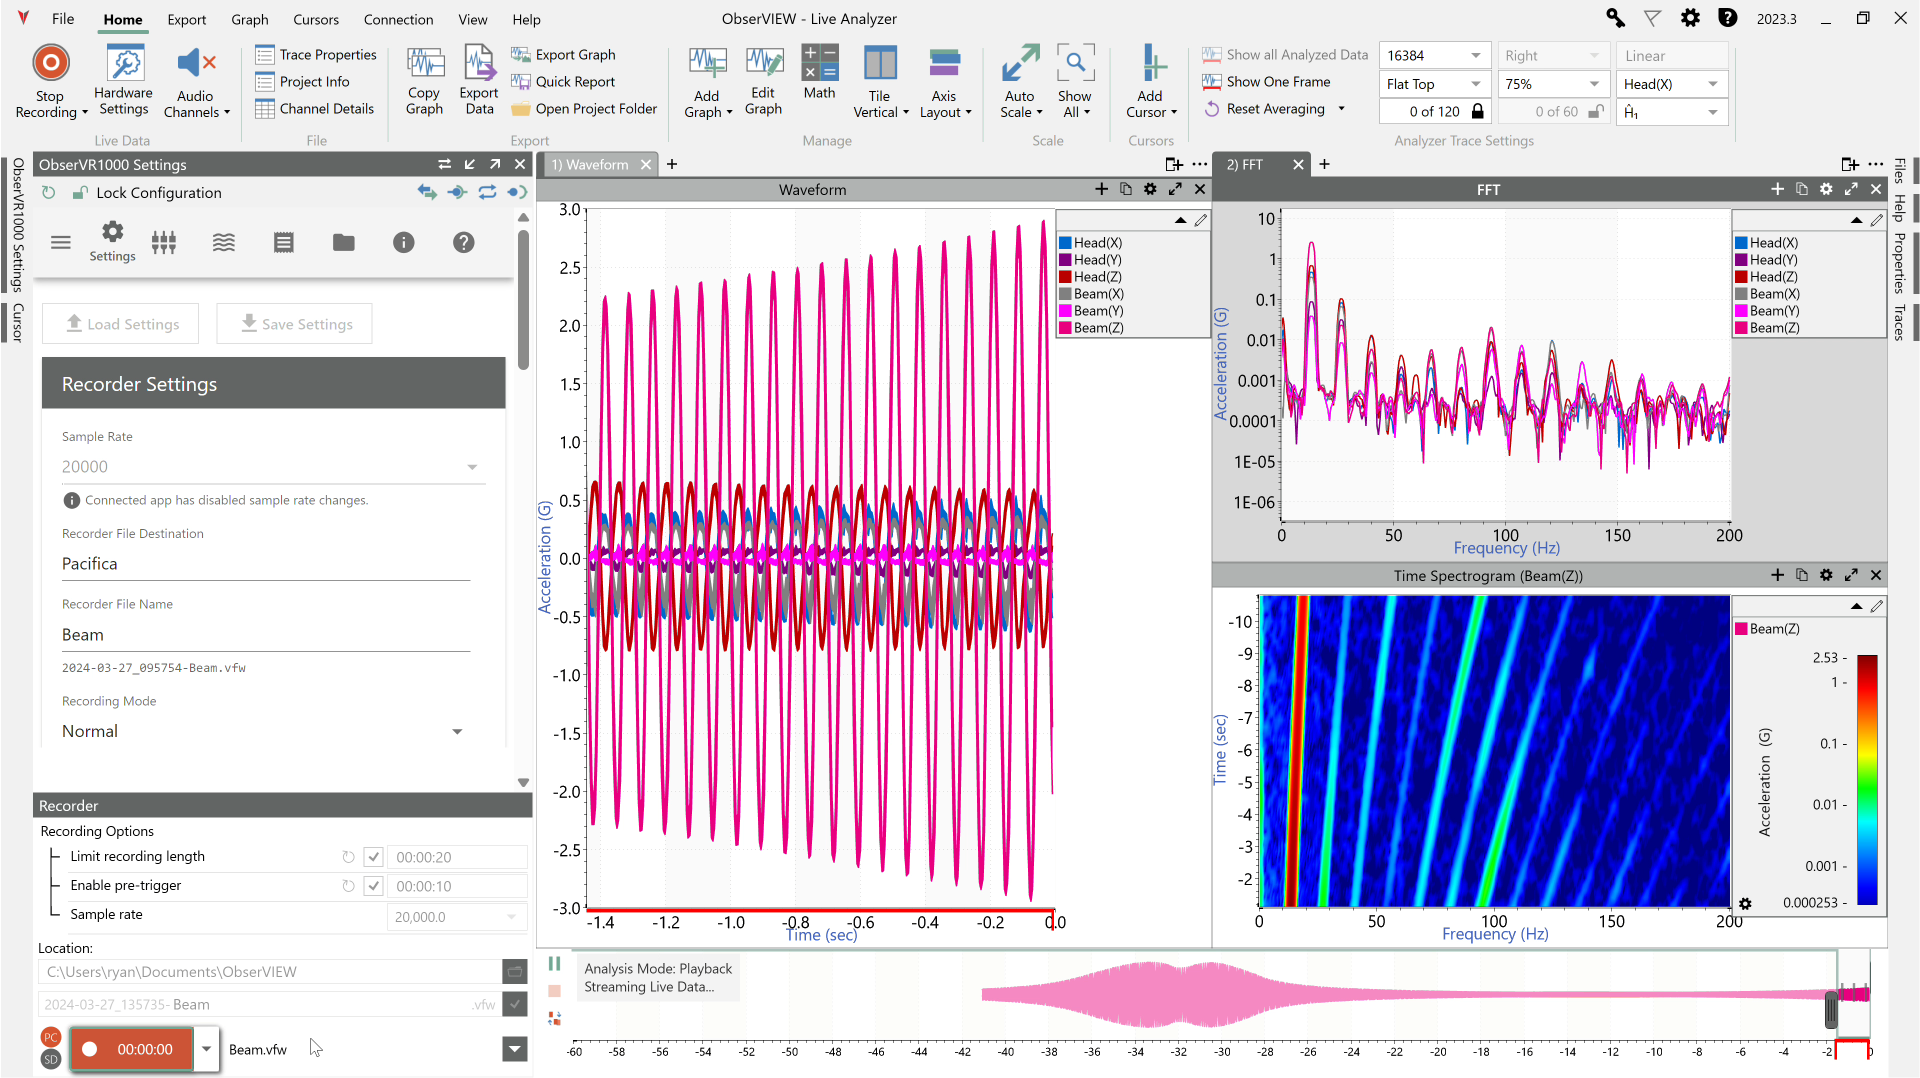
In versions 2023.3 and newer, Live Analyzer can now record live data to a disk in addition to a rolling memory buffer, allowing engineers to record two places at once.
File Import Dialog
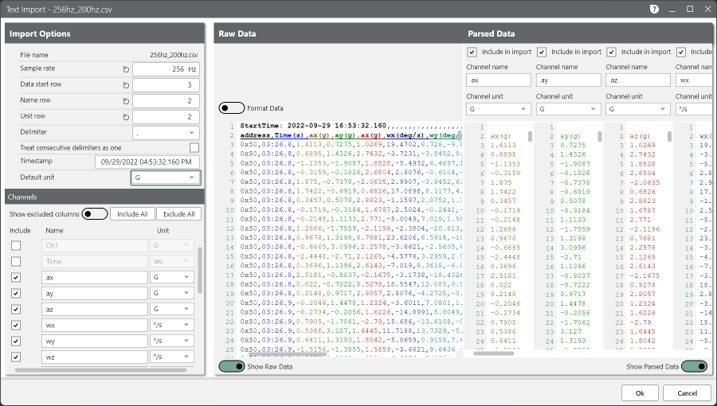
ObserVIEW 2023.1 includes a new import user interface for .txt, .csv, and other text-based files. With this interface, the user can define the waveform’s sample rate, exclude channels from the analysis, display a preview graph, and more.
Batch File Processor
If importing multiple files for analysis, engineers can use ObserVIEW’s Batch File Processor to import/manipulate data simultaneously.
GPS Timestamp Compensation
In ObserVIEW 2023.1 and newer, the user can resample and align saved data to GPS atomic time to compensate for system clock drift and make overlaying data between acquisition devices extremely precise.
With the addition of GPS timestamp capabilities, the user can overlay recordings with more exact data, helping them identify similarities and relationships between waveforms.
Export UFF
The export options for UFF files have been updated in version 2023.2. Users can convert UFF values to display units and use channel names for Y-axis labels.
2023.1 Release Video
Additional Features
Live Output Generator
Run an open-loop output of sine, square, triangle, linear chirp, exponential chirp, or white noise.
User-defined Units
If a user requires a measurement unit that is not pre-set in the software, they can add it to the Display Units list.
Improved Multimedia Sync Video Interface
Multimedia Sync opens media files, including videos, and syncs them with the time waveform recording. The 2023.2 release includes an improved video alignment user interface.
Start using ObserVIEW 2023
VR users with a valid Upgrades and Support Agreement can upgrade to the latest version for free. Anyone can download a free demo version.