Abstract
The Sine Tracking, Analysis and Generation (STAG) software in ObserVIEW requires a ramp-up or coast-down of rotational data, which the engineer can record with a tachometer or proximity sensor. Engineers should aim for a smooth ramp-up/coast-down; however, data can be noisier than anticipated, so it is helpful to have an alternative method to capture the necessary data for STAG.
Question
How do I use STAG if my recorded data has too much noise?
Answer
When data is too noisy, the software may have trouble identifying the rotations per minute (RPM) of the test item’s rotational component. The VR Mobile application offers a solution for calculating this value.
Count the Motor Pulse Signals
Motors use pulse signals to control their rotational movement. A speed controller sends a pulse to the motor, which steps—or rotates—the motor one incremental unit forward/backward. The motor’s pulses per revolution (PPR) value determines how many pulses it requires to complete a full rotation. For example, if it has a PPR value of 25, one pulse is 1/25th of a revolution.
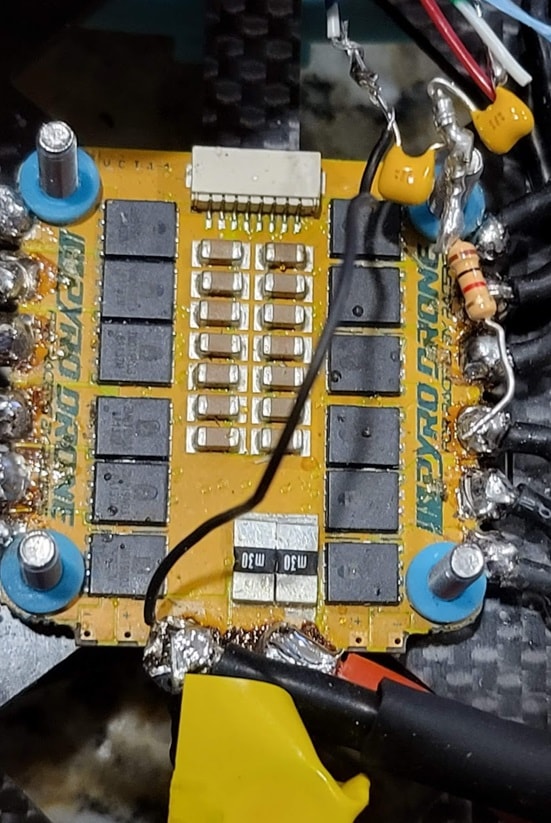
The motor of a drone device.
VR Mobile can calculate a motor’s PPR value using a rotational encoder. Then, it can use that value to calculate the RPM.
Example
For example, the VR team recorded rotational data from a drone using a tachometer. The ObserVR1000 did not capture the RPM from the tachometer data, so they connected to it post-process using VR Mobile.
To connect to an ObserVR1000 in VR Mobile, ensure that the hardware is on. Then, you can use the near field communication (NFC) on the ObserVR1000 to automatically create a WiFi connection. Alternatively, you can select Connect to Device, select the hardware, and select Connect.
Next, the VR team navigated to the Tachometer screen. To do so, select the three-line menu icon, then select the Tachometer option.
Under Tach Input Configuration, enable the tachometer input with the toggle button. Select the Tach Type and Trigger Levels using the drop-down lists.
Run the motor. VR Mobile will read the motor position and populate the Encoder Resolution (pulses/rev) and Motor RPM.
The VR team’s PPR value was 7 pulses/rev. Watch the screen recording below.
Cleaning up the Tach Data
The drone data was particularly noisy, so the VR team needed to clean up the tachometer reading before calculating the RPM in VR Mobile. They ran the recording through an oscilloscope and noticed that the tachometer picked small pulses that weren’t real. They calculated the frequencies to remove, then used an analog filter to produce a clean reading, making it easier for the tachometer to count the pulses.
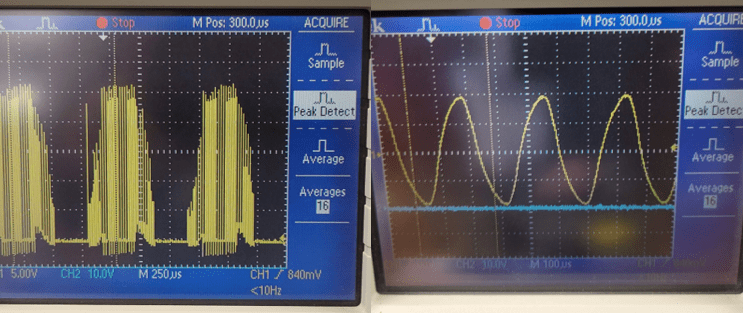
Original tachometer data (left) and the filtered result (right).
Identifying Orders
Noisy data can also make it difficult for the STAG software to identify order numbers. In the previous example, the drone data was not a simple ramp from low to high RPM because its blades spun at various speeds. If the software cannot identify the top orders, the engineer can manually enter order numbers.
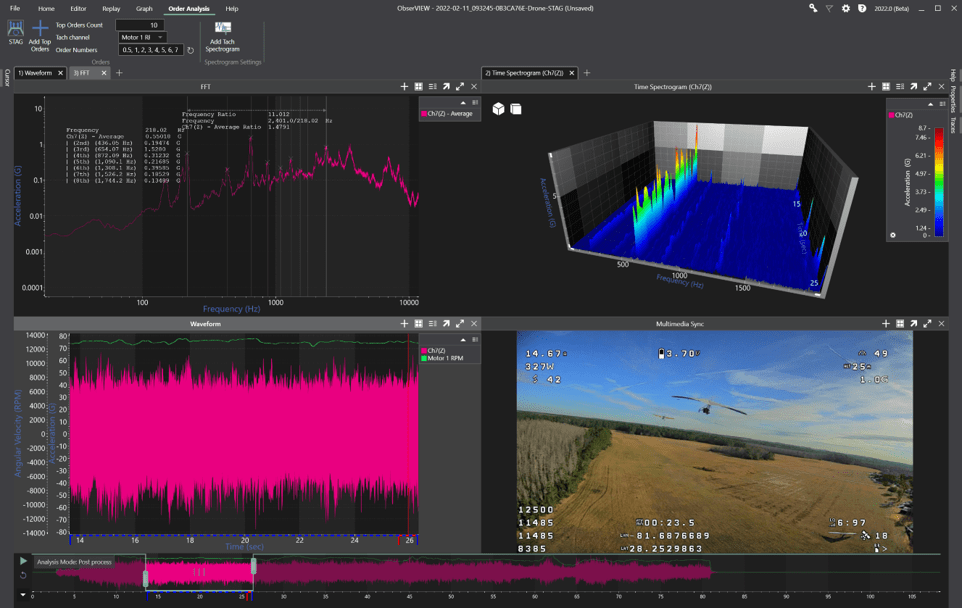
Manually selecting orders from a time-waveform selection.
First, find a section of data where the RPM is consistent. Crop the time-domain data to this section using the tools in the Editor tab.
Add an Average FFT graph over the time duration to clean up the noise. The FFT will eliminate orders that are not of interest. To add an average FFT graph, navigate to the Home tab. Select the Add Graph button in the main ribbon and a blank graph will appear. Navigate to the Traces dialog to the right of the main graph and select the FFT (Average) dropdown list. Select the traces you would like to graph as an average FFT.
Next, add a Harmonic cursor to identify orders and the Delta cursor to add any additional ones. Manually enter these order numbers into the STAG dialog box.
If the resulting order-tracked sine tone profiles have fast-changing amplitudes, the engineer can smooth them out with an exponential smoothing function in Excel.
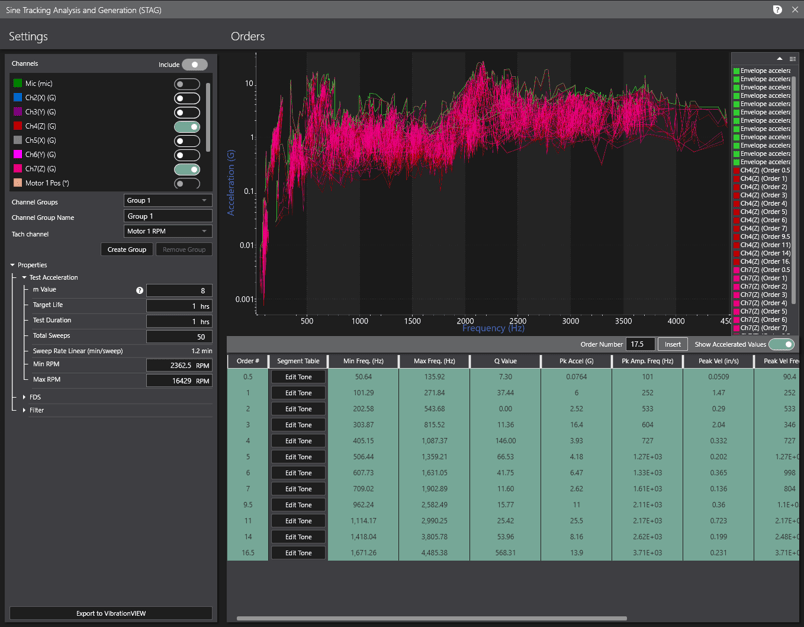
Noisy sine tone profiles after manual selection of orders.