Resonance occurs when an external frequency corresponds with a structure’s natural frequency, resulting in increased severity of the waveform. Complex designs may have multiple resonances that are intensified or suppressed when they interact. When unaccounted for, they lead to structural fatigue or damage.
Engineers can use modal testing to record a structure’s response to excitation for analysis. The overall response helps them to determine the natural vibration frequencies and validate the structure’s design.
Experimental Modal Testing Overview
During an experimental modal test, the engineer excites the unit under test with a mechanical device and records the response. For a more simple analysis, the software then separates the structure into a set of single-degree-of-freedom (SDOF) substructures.
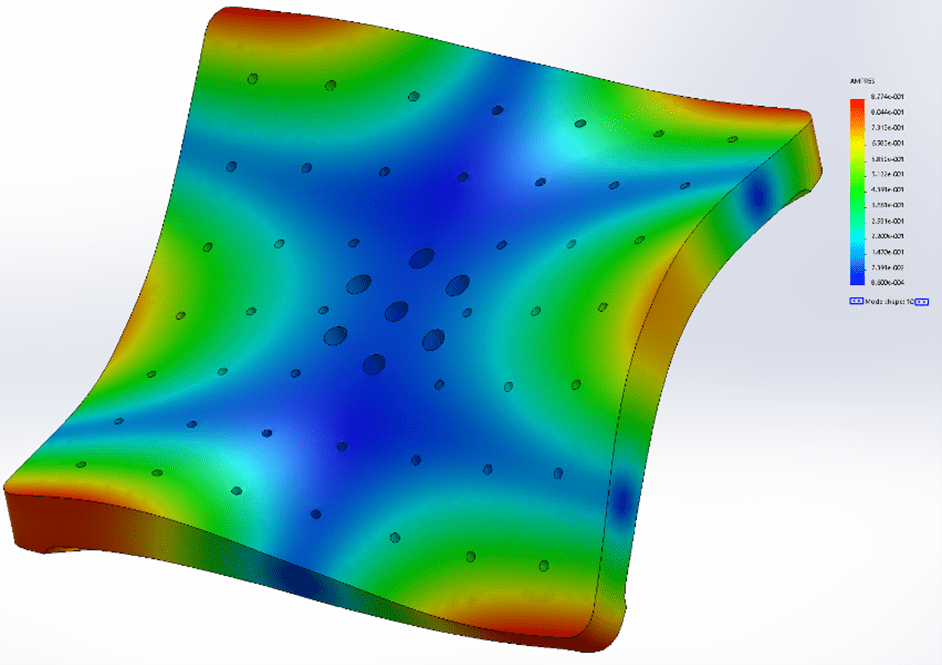
Mode shape of a head expander.
The response of each substructure is associated with a shape called a mode, which reflects its physical movement as it vibrates. The software identifies the mode shapes and corresponding parameters of the substructures. When combined, they constitute the structure’s overall response.
Read the paper: How to Set Up FE Harmonic Modal Analysis to Match Experimental Data.
Defining Modal Parameters
An experimental modal project calls for several parameters that the engineer can configure ahead of time or modify after they have created the project. In particular, they must determine the sample rate, which must be high enough to capture the highest frequency of interest.
Typically, we suggest a sample rate that is four to 10 times the highest frequency of interest. For example, if the highest frequency is 2,000Hz, the sample rate should be around 8,000Hz to 20,000Hz.
The engineer must also define the analysis lines, which determine the number of samples used for analysis. Along with the sample rate, analysis lines determine the frequency resolution of the analyzer.
A Different Approach
There is an accepted method of defining these parameters; however, Vibration Research (VR) has implemented a more intent-based approach.
Test engineers normally anticipate a series of calculations when setting up a modal project. They must determine the correct sample rate based on the highest frequency value and time data resolution, the number of samples based on duration and the sample rate, etc. They adjust the values and re-calculate until the settings are valid and achieve the test objectives.
VR’s Method
VR found that the standard approach to defining modal parameters was time-consuming, particularly for those running basic modal tests. Rather than manually fine-tuning the parameters, the engineer defines those that represent the test’s purpose, such as maximum frequency of interest, oversample factor, and analysis duration.
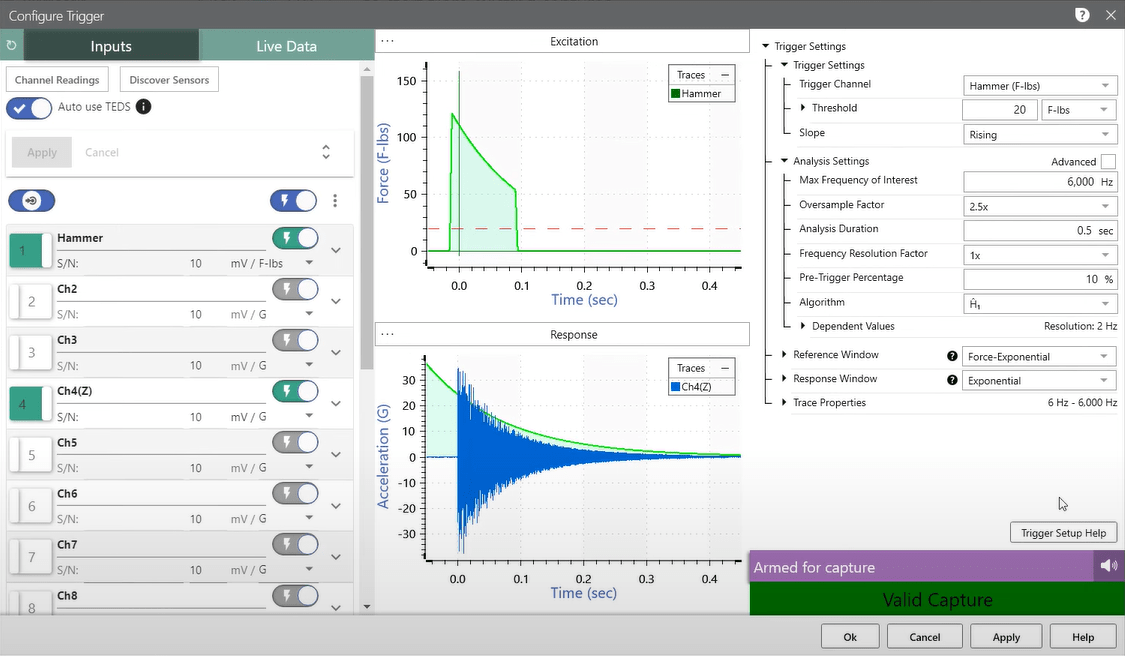
ObserVIEW Configure Trigger dialog.
For example, the maximum frequency of interest is the highest frequency value to be plotted on the analysis graphs. In a modal test set-up, the higher frequency values indicate a resonance. However, there may be high-frequency events that the engineer does not want to capture due to their test objectives. For instance, they may be searching for a resonance they know to be in the 500-700Hz range.
Instead, the software automatically calculates the sample rate, frequency resolution and lines, and the number of samples using these user-defined parameters. Specifically, ObserVIEW can automatically configure:
- Sample rate based on oversample factor and the max frequency of interest.
- Frequency resolution based on the sample rate, analysis duration, and frequency resolution factor.
- Frequency lines based on the sample rate, analysis duration, max frequency of interest, and frequency resolution factor.
- Analysis samples calculated by the analysis duration and sample rate.
It also includes a frequency resolution factor that adjusts zero padding and analysis lines. The software’s approach allows the engineer to focus on the intent of the modal test and saves time during set-up.
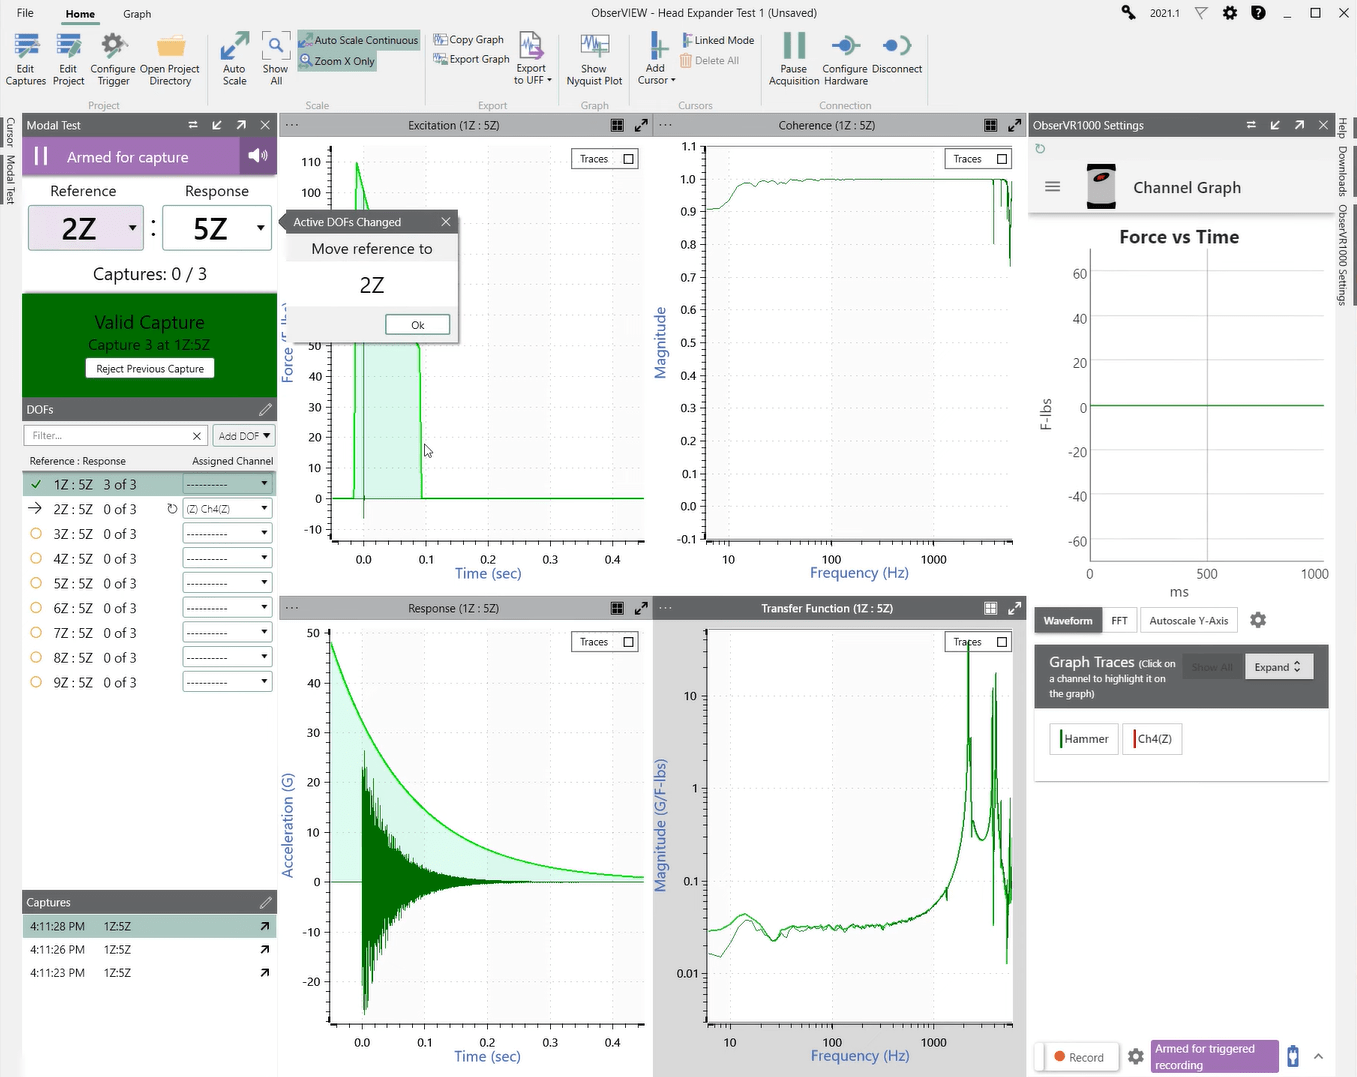
ObserVIEW Modal Testing software.
Modal Testing Software Overview
In ObserVIEW, the Modal Testing software collects a defined number of responses from each DOF, which can also be auto-generated or user-defined. The average response is calculated for each DOF to generate a smooth transfer function or FRF.
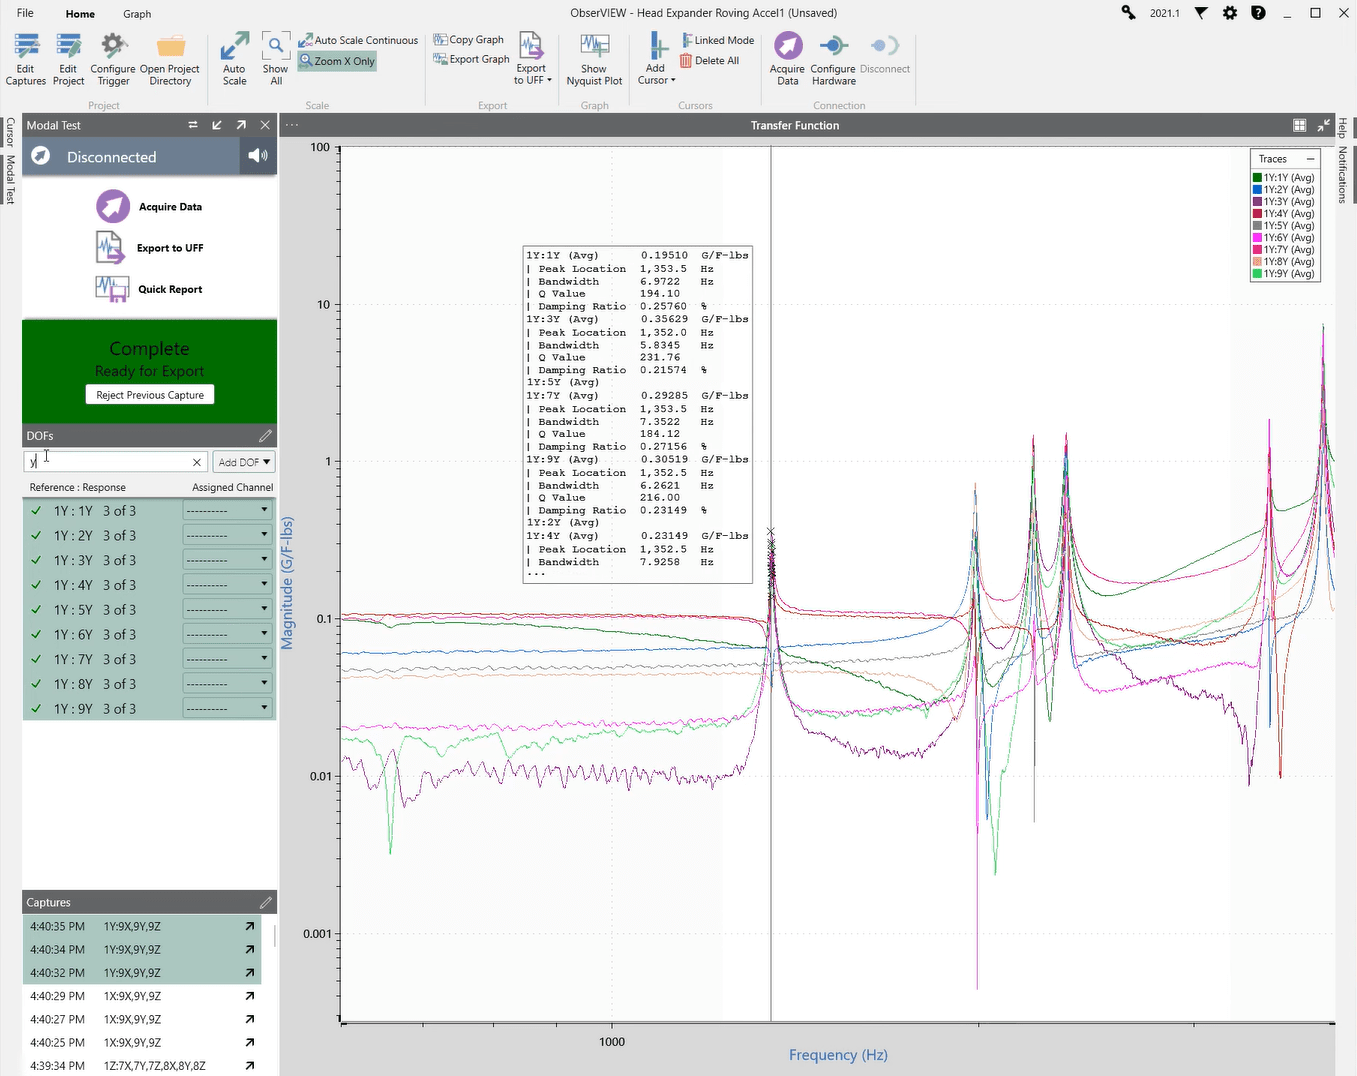
Collection of transfer functions for responses in the y-axis.
Then, the engineer can export the collection of FRFs to a modal analysis software such as MEscope. It exports organized FRF data to a UFF or another modal data format.
With Modal Testing in ObserVIEW, the user can:
- Manage table of hits per location and review hits
- Average multiple data recordings
- Calculate decay rate from transient ring-down events
- Manage the recording channel using a large, interactive display
- View transfer function as a Nyquist plot
- Interact with an intuitive project set-up dialog
- Access the automatic location sequencer
- And more!
To learn more about the features of Modal Testing in ObserVIEW, please visit the software page.