When a device under test (DUT) is excited at its natural–or “resonant”–frequency, the resulting vibration bends it into different shapes. These mode shapes are a tool for analyzing vibration, and engineers use them to determine the resonance of complex structures. Resonant frequencies are essential knowledge because they result in structural fatigue or damage if the engineer does not account for them.
Why Modal Analysis?
Modal analysis uses a computer-aided design (CAD) to analyze a DUT’s response, which can benefit engineers not yet ready to test on a shaker or in the field. For instance, a laboratory may not have enough data to ensure a DUT will survive a shaker test, so it moves forward with CAD first to avoid risk. A modal test can provide information that is necessary for preliminary design before moving forward with more severe forms of physical testing.
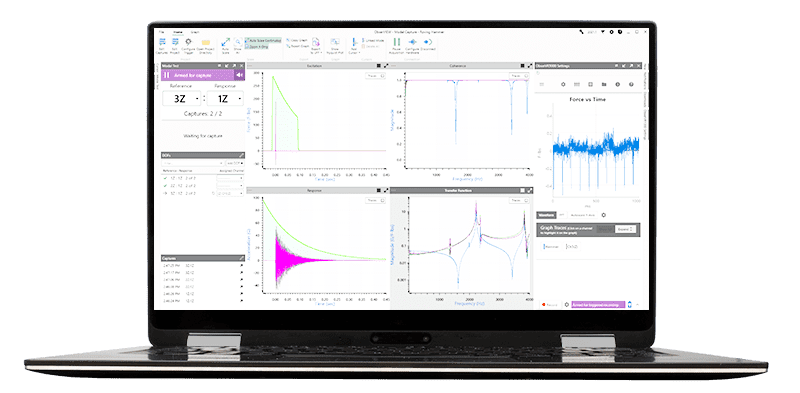
Modal testing project in ObserVIEW.
In the ObserVIEW Modal Testing software, you can capture the response of a DUT at different points to determine its mode shapes. After acquiring the data, you can analyze it in the software or export the modal data to a UFF file and open it in an external program. One applicable program is ME’scope.
ME’scope by Vibrant Technology, Inc. is a series of visual engineering software packages. It contains many tools for a variety of engineering tasks. With recorded modal data, you can perform modal parameter estimation, view or animate rigid body modes, synthesize and analyze data with an array of functionalities, and much more.
Capturing Modal Data in ObserVIEW
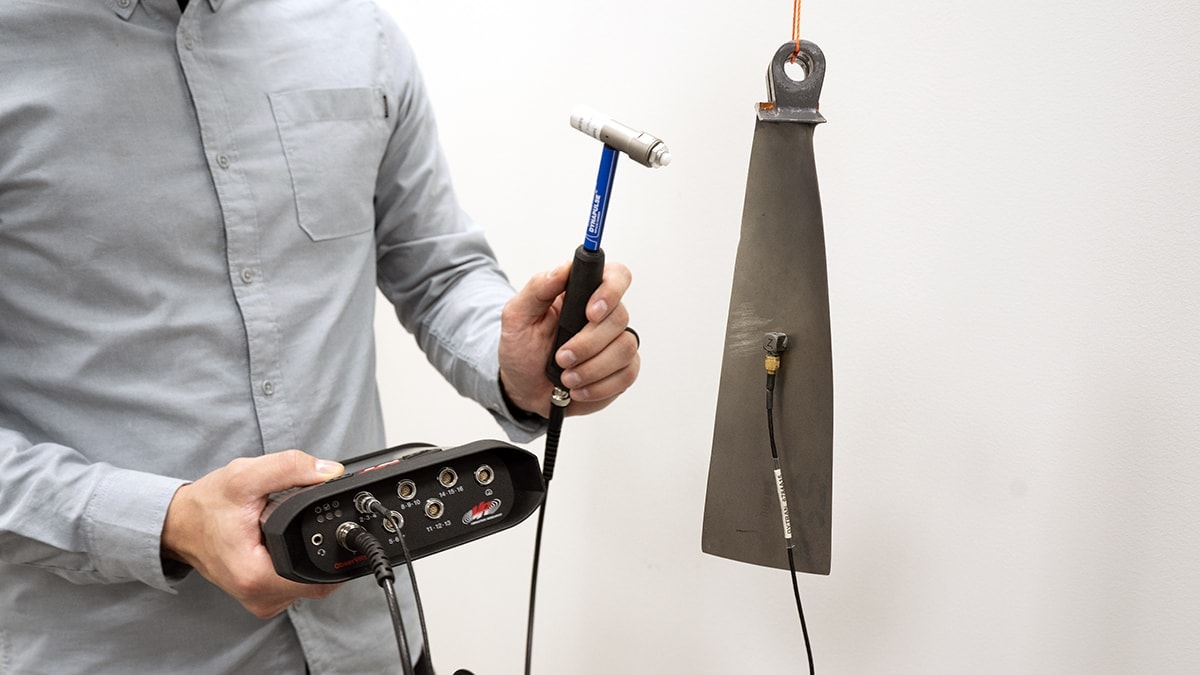
To perform experimental modal testing, the engineer first determines where on the DUT to strike with an impact hammer. In modal testing, the degrees-of-freedom (DOF) value indicates a contact point on the structure in reference to the transducer. The engineer also determines the direction of the impact (from the x, y, or z-axis).
The Modal Testing software in ObserVIEW collects a user-defined number of responses at each DOF. The software then calculates the average response at each DOF and generates a smooth transfer function or “frequency response function” from the input signal and its corresponding output.
For a linear and time-invariant system, the transfer function describes the ratio of the two signals over a defined frequency range. ObserVIEW uses the fast Fourier transform to move the data from the time domain to frequency.
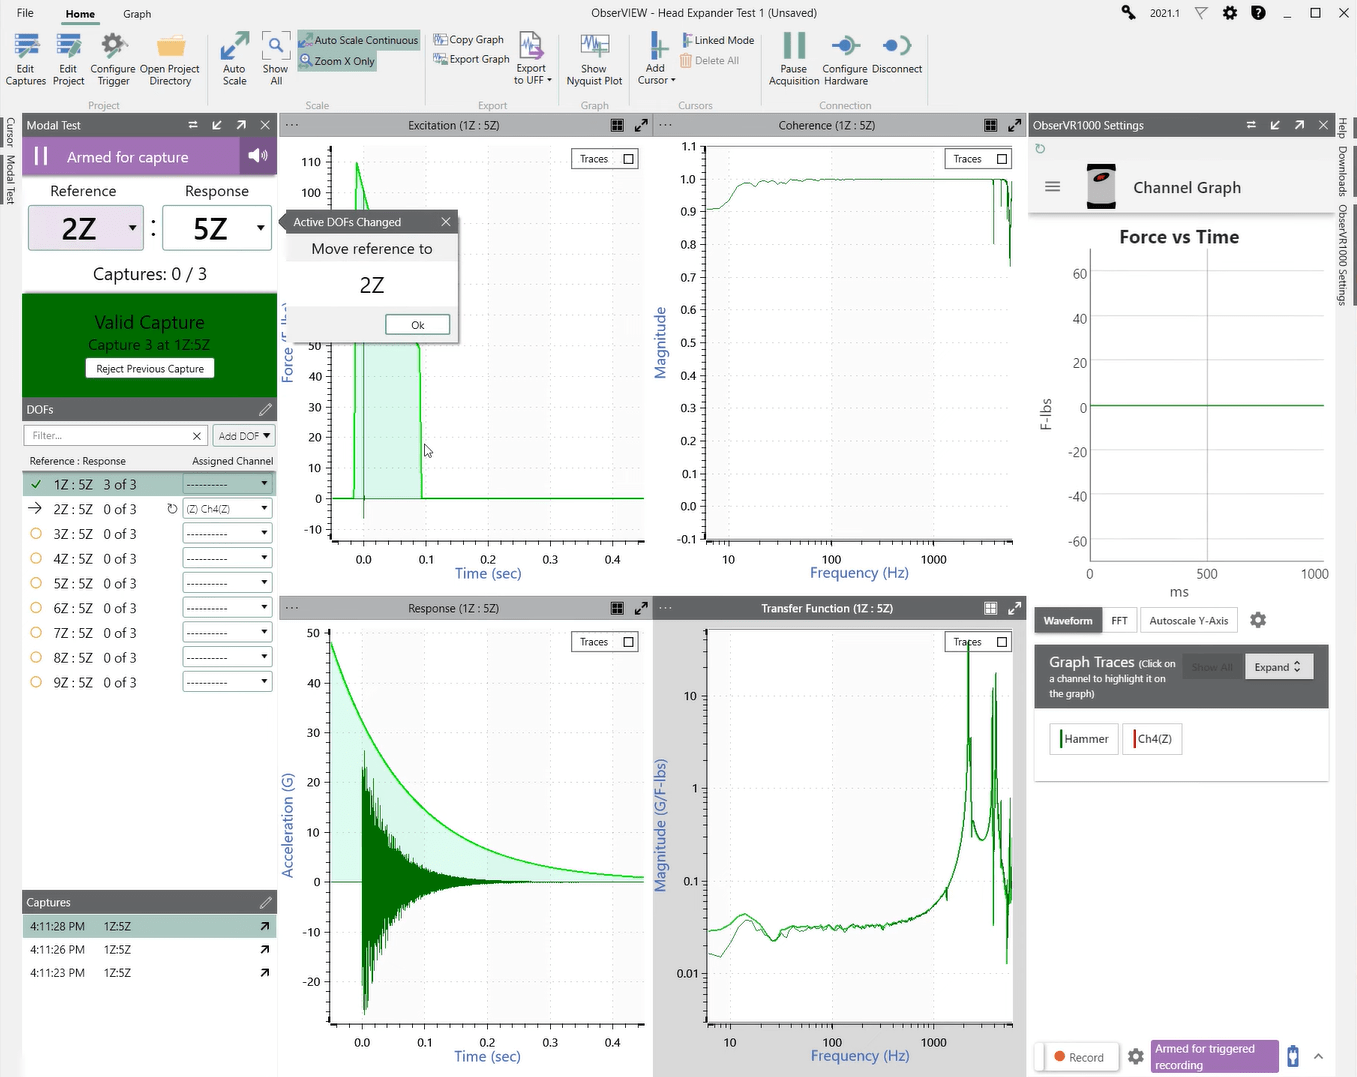
Modal Testing software in ObserVIEW.
Modal Analysis in ME’scope
The collection of transfer functions can be exported to a modal analysis software such as ME’scope. ME’scope performs curve fitting to estimate each identified mode’s frequency, damping, and shape. This estimation also produces the magnitude and phase of the resonance’s strength (a value called the “residue”). The engineer can then view/interact with three-dimensional models of each mode.
ME’scope also offers an array of advanced functionalities for modal analysis.
Export Modal Data
If exporting the modal data to an external program, the engineer must ensure that the measurement points in the program match the DOF in ObserVIEW. Before data collection, you can create numbering points in the ME’scope software and keep the diagram open while you collect data or write the numbering system on the DUT. If you do not have a CAD model, you can make a simplified one in ME’scope.
Additionally, ME’scope swaps the DOF convention, so the modal data from ObserVIEW needs to be exported with reversed DOF. The ObserVIEW software includes this option during the export process.
Analysis in ObserVIEW
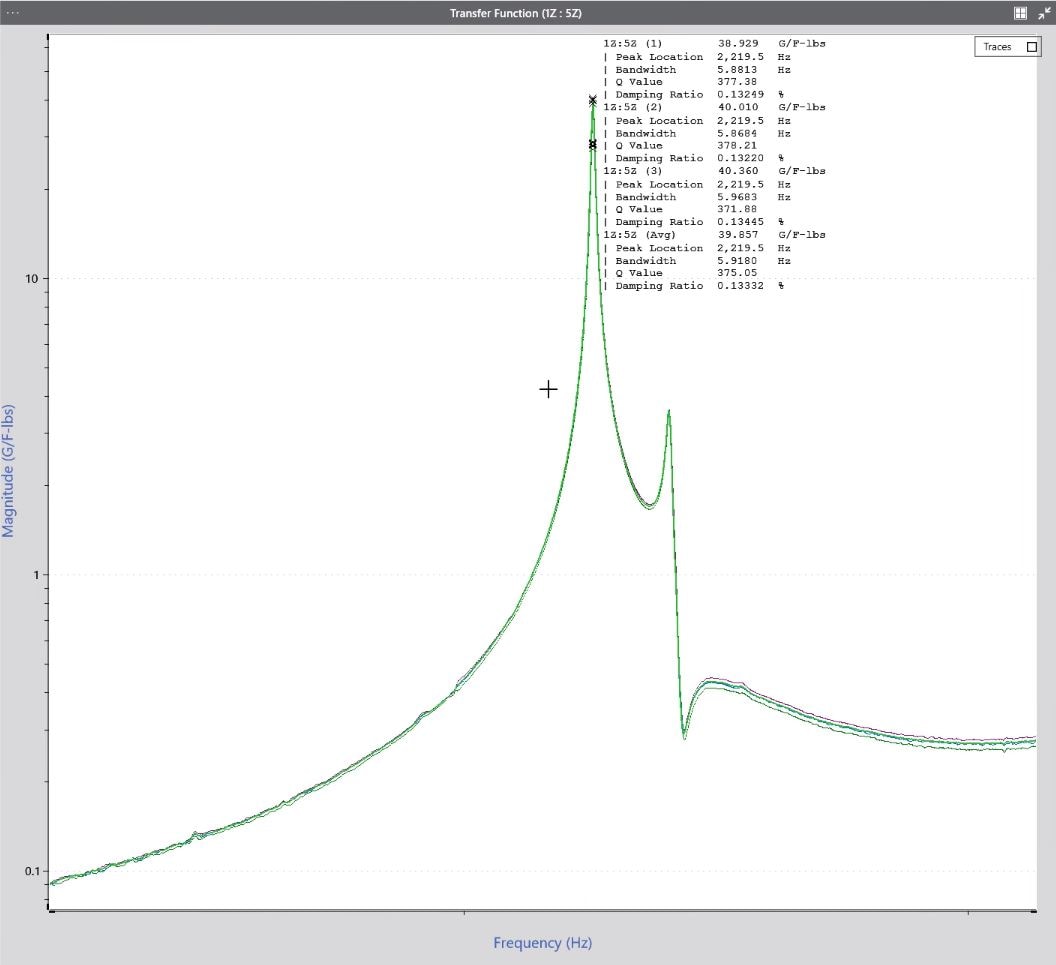
A transfer function in the Modal Testing software.
In ObserVIEW, the user can view the transfer function for each DOF. The transfer function helps to identify a resonance or an anti-resonance in a system. It displays the area around any frequencies where there is a sudden increase or decrease in spectral power. Generally, the transfer function cannot be known but can be estimated.
The engineer can also add a Nyquist plot to view transfer function data as a scatter plot. The Nyquist plot is often used to assess the stability of a system with feedback.
If you have the ObserVIEW software and perform modal analysis, the Modal Testing add-on is a convenient choice. Features of the software include:
- Manage table of hits per location and review hits
- Average multiple data recordings
- Calculate decay rate from transient ring-down events
- Manage the recording channel using a large, interactive display
- View transfer function as a Nyquist plot
- And more!
Learn more about the add-on on the software page and contact your sales representative to get started.