Introduction
An aerospace customer sought to perform calculations on live data recorded during testing and display them on a graph. Their laboratory analysts review the recorded data after each test level and provide feedback before the test engineer runs the next. The customer wanted to automate some of this process.
Cumulative gRMS
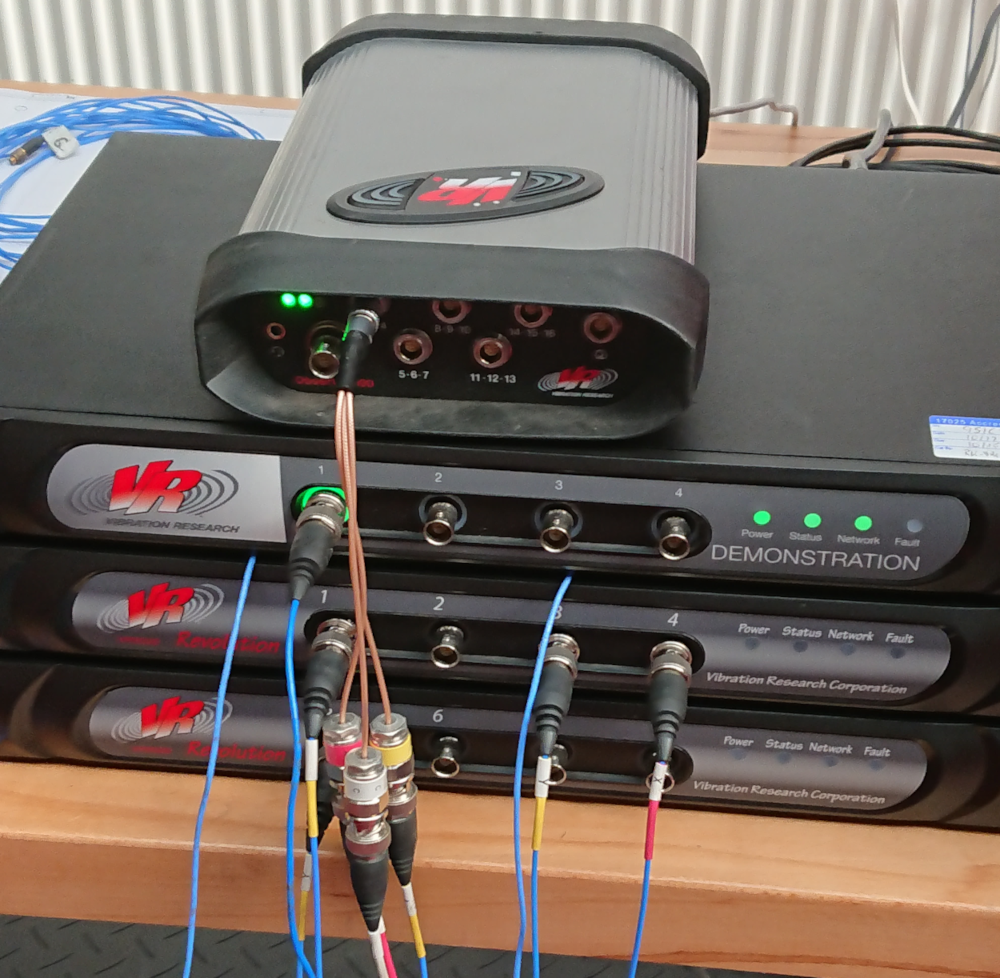
An ObserVR1000 setup for independent measurement.
The customer wanted to display a channel’s cumulative acceleration root mean square (gRMS) level during random vibration tests. This cumulative level provides information about the signal’s overall energy content over a specified frequency range. Engineers use it to measure the overall severity of vibration experienced by the device under test (DUT) and assess compliance.
ObserVIEW’s Live Analyzer can record/display a live data stream from any Vibration Research hardware. The customer can connect a second instance of the VR9700/VR10500 controller or an ObserVR1000 to the ObserVIEW software and use Math Traces to display the cumulative gRMS using the following equation:
sqrt(cumsum(v1^2)/(cumsum(1 + v1 * 0)))
Live Math Traces
Applying live math traces allows the customer to monitor metrics in real-time, observe the DUT’s response, assess its structural integrity, verify the test setup, and more.
Live FDS
Many engineers also use the cumulative gRMS level for fatigue analysis, but Vibration Research suggests using the fatigue damage spectrum (FDS) as a more comprehensive and accurate metric. Live FDS in ObserVIEW displays real-time fatigue measurements to help identify when fatigue levels of a test profile are achieved compared to a reference.
Shock Response Spectrum (SRS)
During shock response spectrum tests, the customer wanted to display a channel’s response spectrum. The SRS analyzer trace in ObserVIEW allows them to analyze the output of a live SRS test and verify that it meets the demand.
Featured Software
Live Analyzer

Math Traces

FDS ObserVIEW

SRS ObserVIEW