Evaluate & Edit Data
ObserVIEW’s time waveform editing options allow engineers to evaluate and edit recorded vibration data for analysis or test generation. Import 100+ GB of data, including multi-channel data sets, from any data acquisition system.
The time waveform editor helps engineers reduce processing time by eliminating erraneous data and allows them to use mutliple files of the same type in one project.
Cut, Crop, Copy
Cut, crop, or copy/paste sections of data to narrow down to areas of interest, remove outlier events, or hone in on the most damaging events. The intuitive interface is accessible to new users and simplifies the process of analyzing large recordings.
Append Files
 Select one or more time waveform files compatible with the active file and append the data to the end.
Users can select the transition or fade between the sections of data. ObserVIEW calculates and modifies the data to resolve any discontinuity between the end of one section and the beginning of the next.
- Transitions allow data to play back without any sudden breaks
- Fades allows data to play back in a repeating loop without sudden breaks
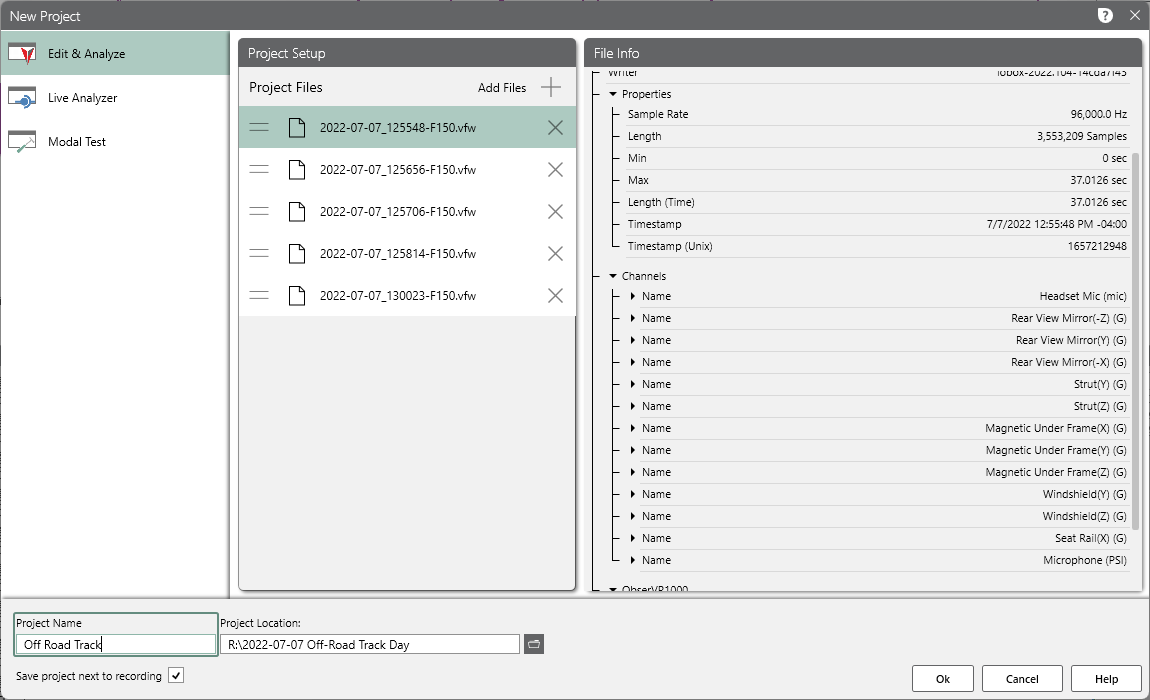
Import Files
ObserVIEW can import VibrationVIEW field waveform (VFW) files and several other file types.
- ObserVIEW project (.obserproj)
- TXT
- CSV
- RPC/RSP
- UFF/UNV
- WAV/WAVE
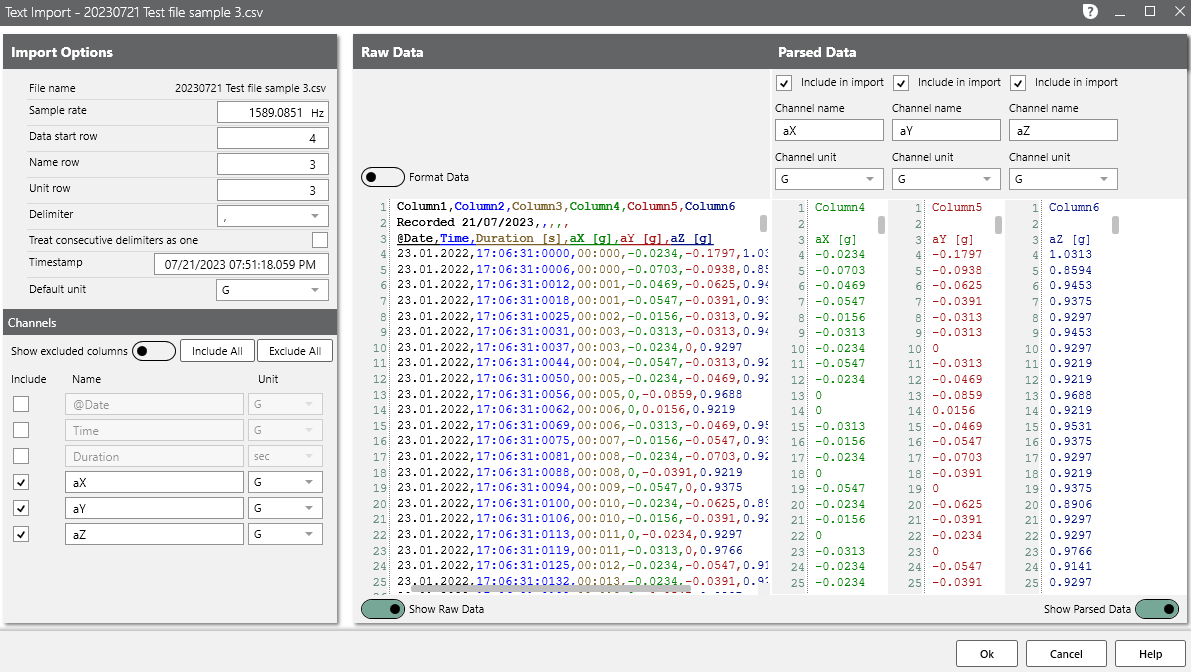
Use Text File Import to parse raw data before import or the Batch File Processor apply global changes such as filtering.
Export Files
Access general and file-based export options. Advanced export options include resampling, high-pass and low-pass IIR filtering, and general-purpose FIR filtering.
File Types
- VFW
- MAT
- CSV/TXT
- UFF (binary or text)
- WAV
- RPC
- RSP
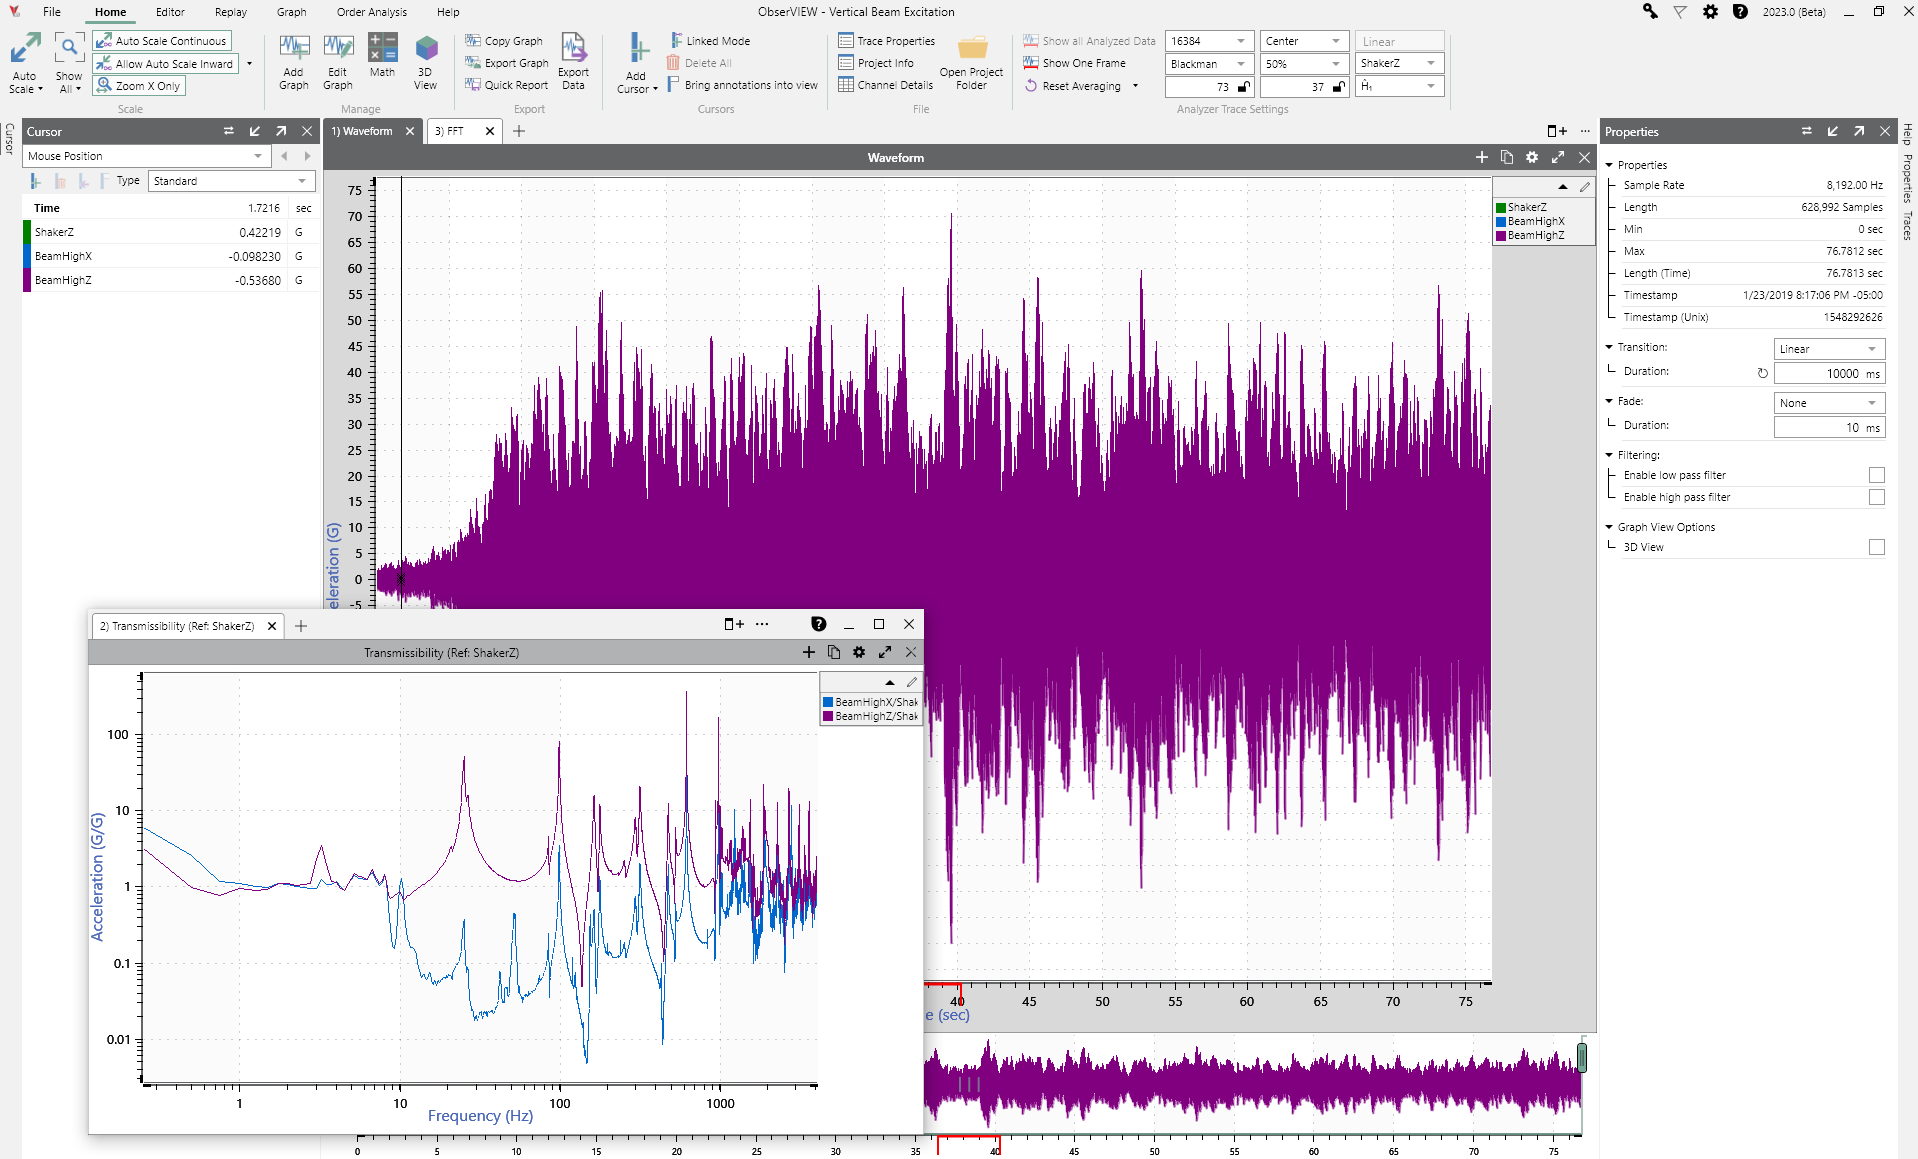
View Data
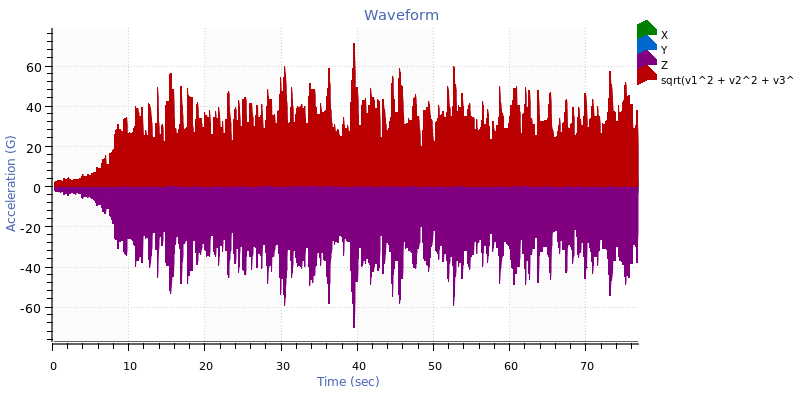
The ObserVIEW main graph displays channels as traces and supports multi-channel files with an easy-to-use interface. The Basic version of the software displays data in a time-domain graph. Advanced graph options include frequency-domain analysis, spectrograms, octave analysis, and more.
Edit Graphs
- Select a trace type to add to the graph
- Change trace color, line pattern, width, and visibility, or remove the trace
- Adjust axes properties and trace layout options
Analysis Ranges
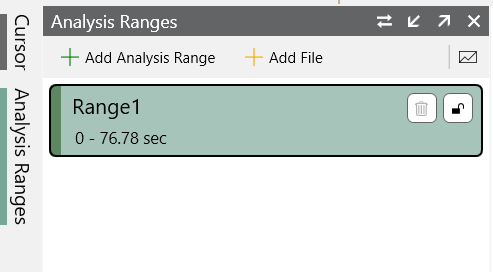
Analysis Ranges allow users to add multiple analysis ranges to a project and easily navigate between them rather than create a new project for each data range of significance.
For example, compare sections of a waveform to a range encompassing the whole waveform.
Copy-Paste Traces
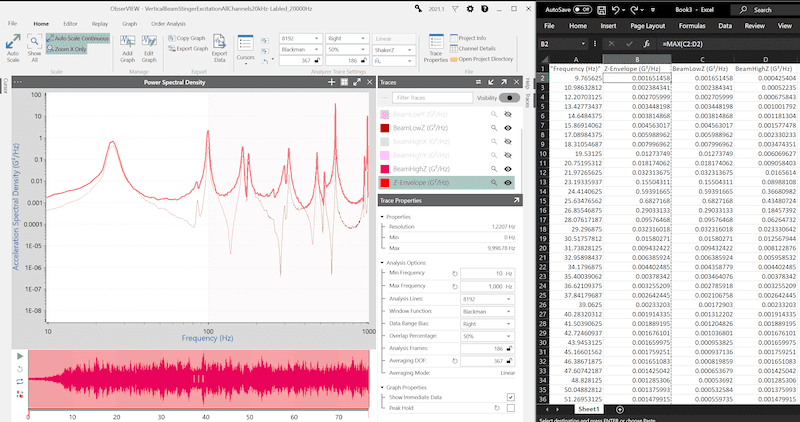
The copy-and-paste command allows users to seamlessly move data between ObserVIEW graphs and other software applications, such as Microsoft Word or Excel. This feature is useful for comparing graph data from different time locations, multiple test results, various test environments, and more.
Advanced Features
Math Traces
The Math feature plots a user-defined math equation on a time or frequency-domain graph. It allows the user to implement custom math operations not defined by the current graph types.
Media Sync
With Multimedia Sync, users can view, edit, and analyze recordings with supplementary data such as video and audio.