Vibration testing generates a plethora of data for the engineer to sort through. They have to analyze initial qualification tests, field recordings, failure runs, etc., to make observations and may want to develop new test profiles from the data. Signal analysis software is necessary for vibration test engineers who want to do more than generate a report.
Signal analysis software programs like ObserVIEW provide tools for engineers to view, edit, and analyze waveforms. They can identify component fatigue, diagnose failure modes, understand the field environment, create realistic test profiles, and more. The many software options create opportunities for process and product improvement.
ObserVIEW is a powerful and efficient signal analysis software with specialized modules for data recording and test generation. Below, we present five of the many reasons to download the ObserVIEW software.
1. Import Data from Any Device
Engineers can analyze files post-process from any data acquisition system in ObserVIEW. Its supported file types are .csv, .txt, .rpc, .rsp, .uff, .unv, .vfw, and .wav, allowing engineers to use the powerful features of ObserVIEW regardless of their current hardware. They can import 100+ GB of data, including waveform, audio, video, GPS, and tachometer data.
For current Vibration Research customers, ObserVIEW connects to all Vibration Research hardware devices for recording and live analysis during testing. Any customer with Vibration Research hardware can download the software and access additional licensed tools unique to ObserVIEW, such as spectrogram analysis, Modal Testing, and Sine Tracking, Analysis and Generation (STAG).
Engineers typically use ObserVIEW with the ObserVR1000 dynamic signal analyzer. Vibration Research designed this hardware and software in tandem to collect, analyze, and report test data from the field. Their cohesive features allow for swift and reliable data acquisition.
Post-process analysis of waveform, video, and audio data recorded in the field.
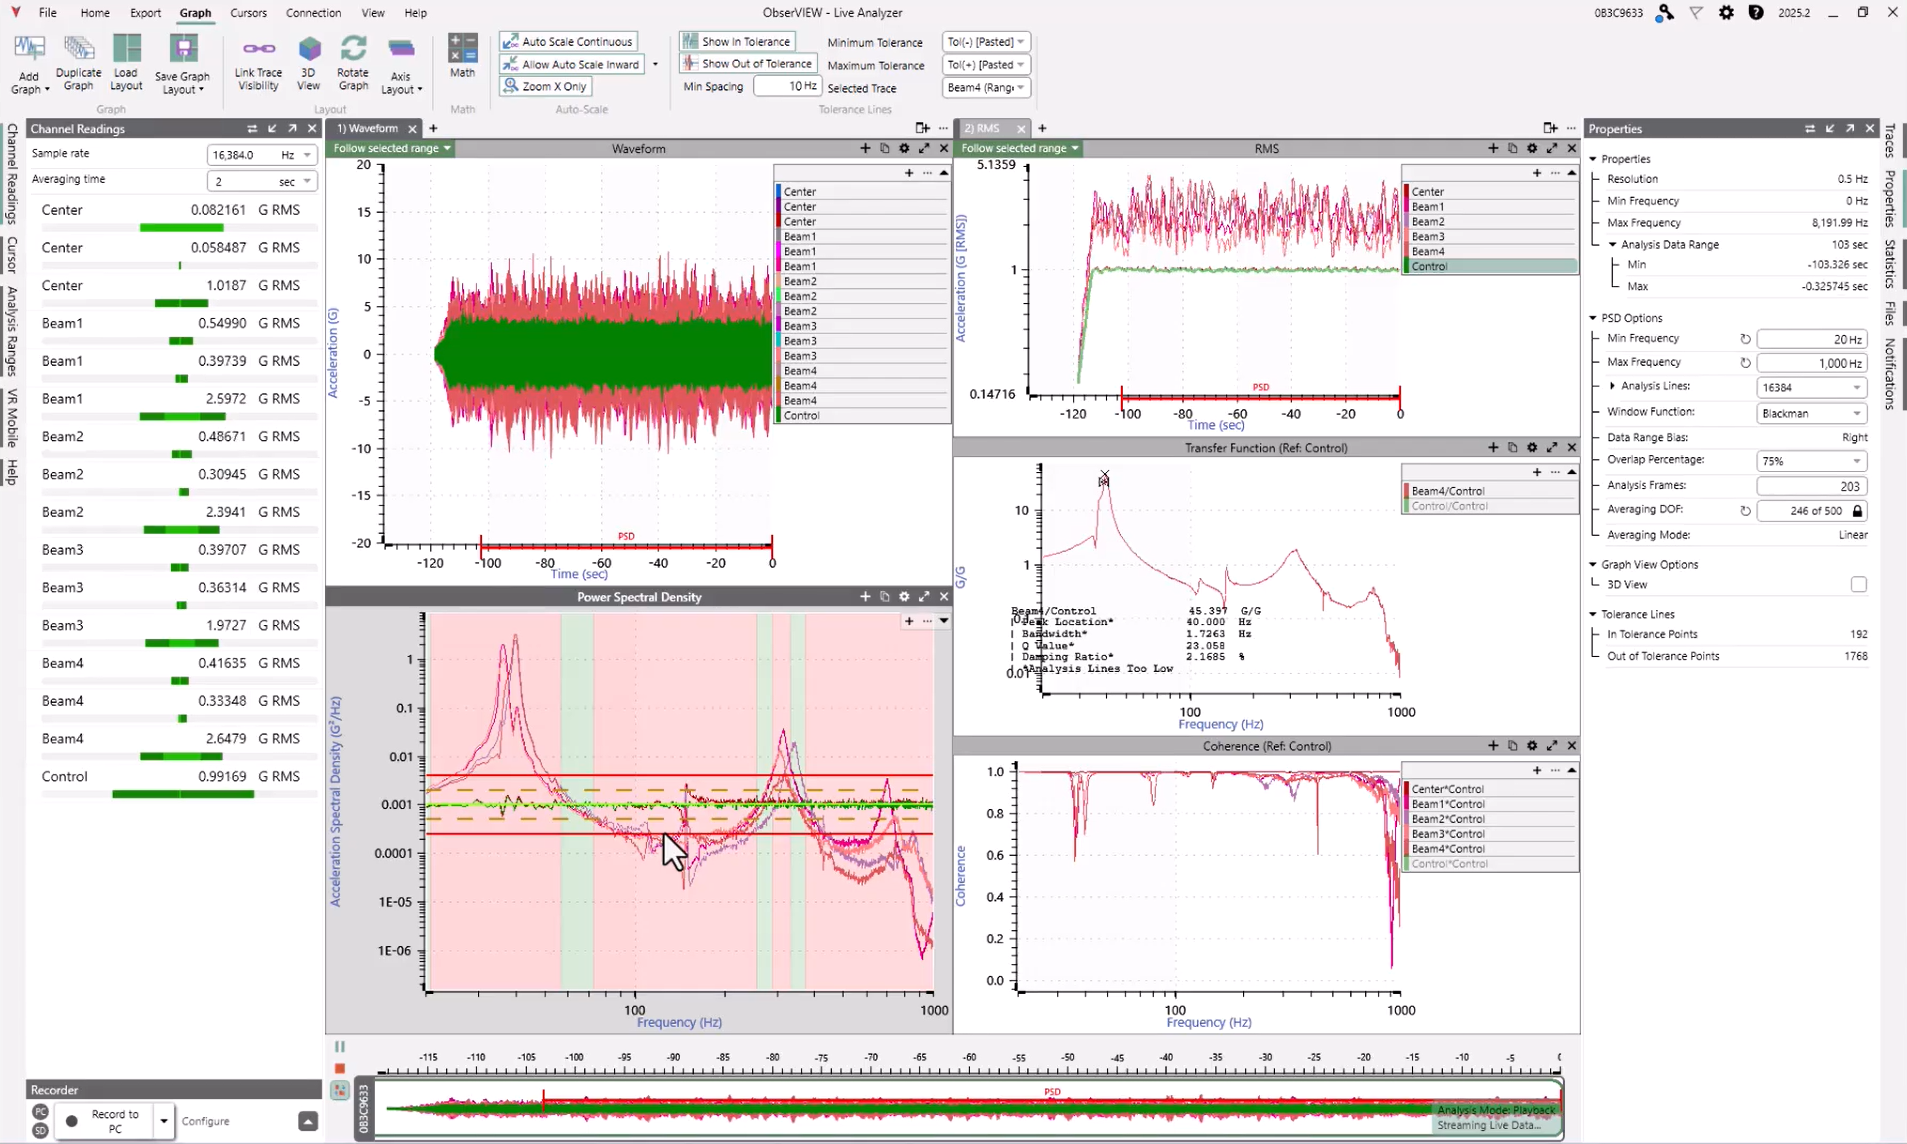
2. Analyze a Live Data Stream
With the Live Analyzer feature, engineers do not have to wait until post-process to begin data analysis. They can pause a live data stream to select, analyze, and export a section of the time waveform for further analysis or comparison; the data will continue to stream in the background.
Live Analyzer provides live feedback and immediate response. It can record live data to a disk or a rolling memory buffer. In a Live Analyzer session, engineers can access many of ObserVIEW’s analysis tools, including:
- Perform FFT, PSD, transfer function, etc., analyses
- Adjust resolution, averaging, and window functions
- Select, cut, copy, append, and transition waveforms
- Plot a user-defined math equation or statistics trace
Live Analyzer is available in the ObserVIEW software and VR Mobile when connected to any Vibration Research I/O unit. Any Vibration Research customer with a current U&SA agreement has access to Live Analyzer. The purchase of a Vibration Research hardware device includes one free year of U&SA.
Live Analyzer Applications
- Analyze, record, and compare data
- Verify shaker tests, including sine reduction and SRS/PSD analysis
- Statistical analysis, monitoring, and outlier evaluation
- Acoustic analysis with octave and SPL time history
- Basic rotational analysis
- Live damage analysis (FDS, SRS, ERS)
3. Add Math & Statistics
The math and statistics capabilities of ObserVIEW allow engineers to calculate even the most custom of values for their analysis. With statistics traces (v.2024 and later), they can plot the following statistics over time for acceleration, velocity, or displacement data:
- Min, max, maximax
- Mean
- RMS
- Standard deviation
- Variance
- Skewness
- Kurtosis
- Range
- Crest factor
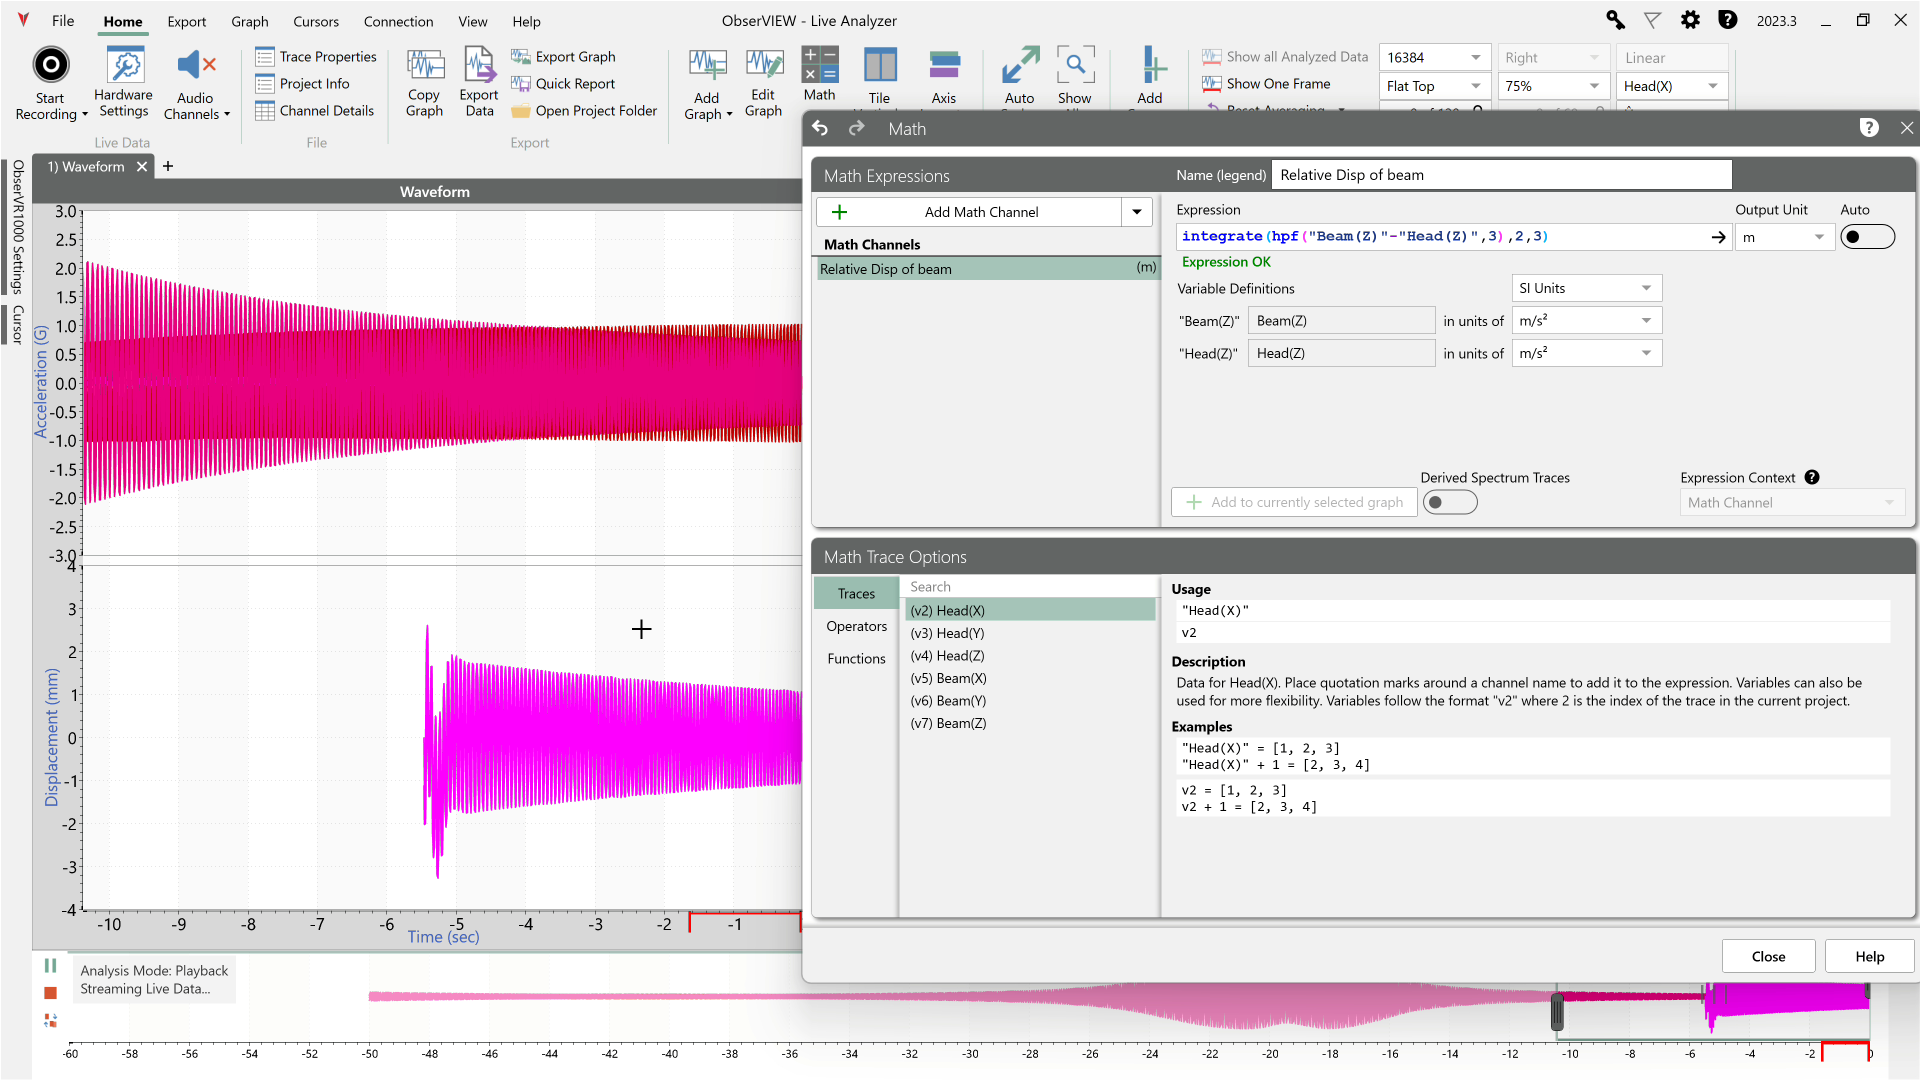 If the engineer needs to add a custom operation to a graph, they can do so with math traces. This feature allows the user to add a math equation to a time or frequency-domain graph, creating a new trace alongside the original data. It is a free entry field that builds a trace by applying functions/operators to existing data.
Math traces allow engineers to calculate values specified by a standard and add it to their graphs and reports. It provides the flexibility of determining values for a range of scenarios and comparing it to the test data.
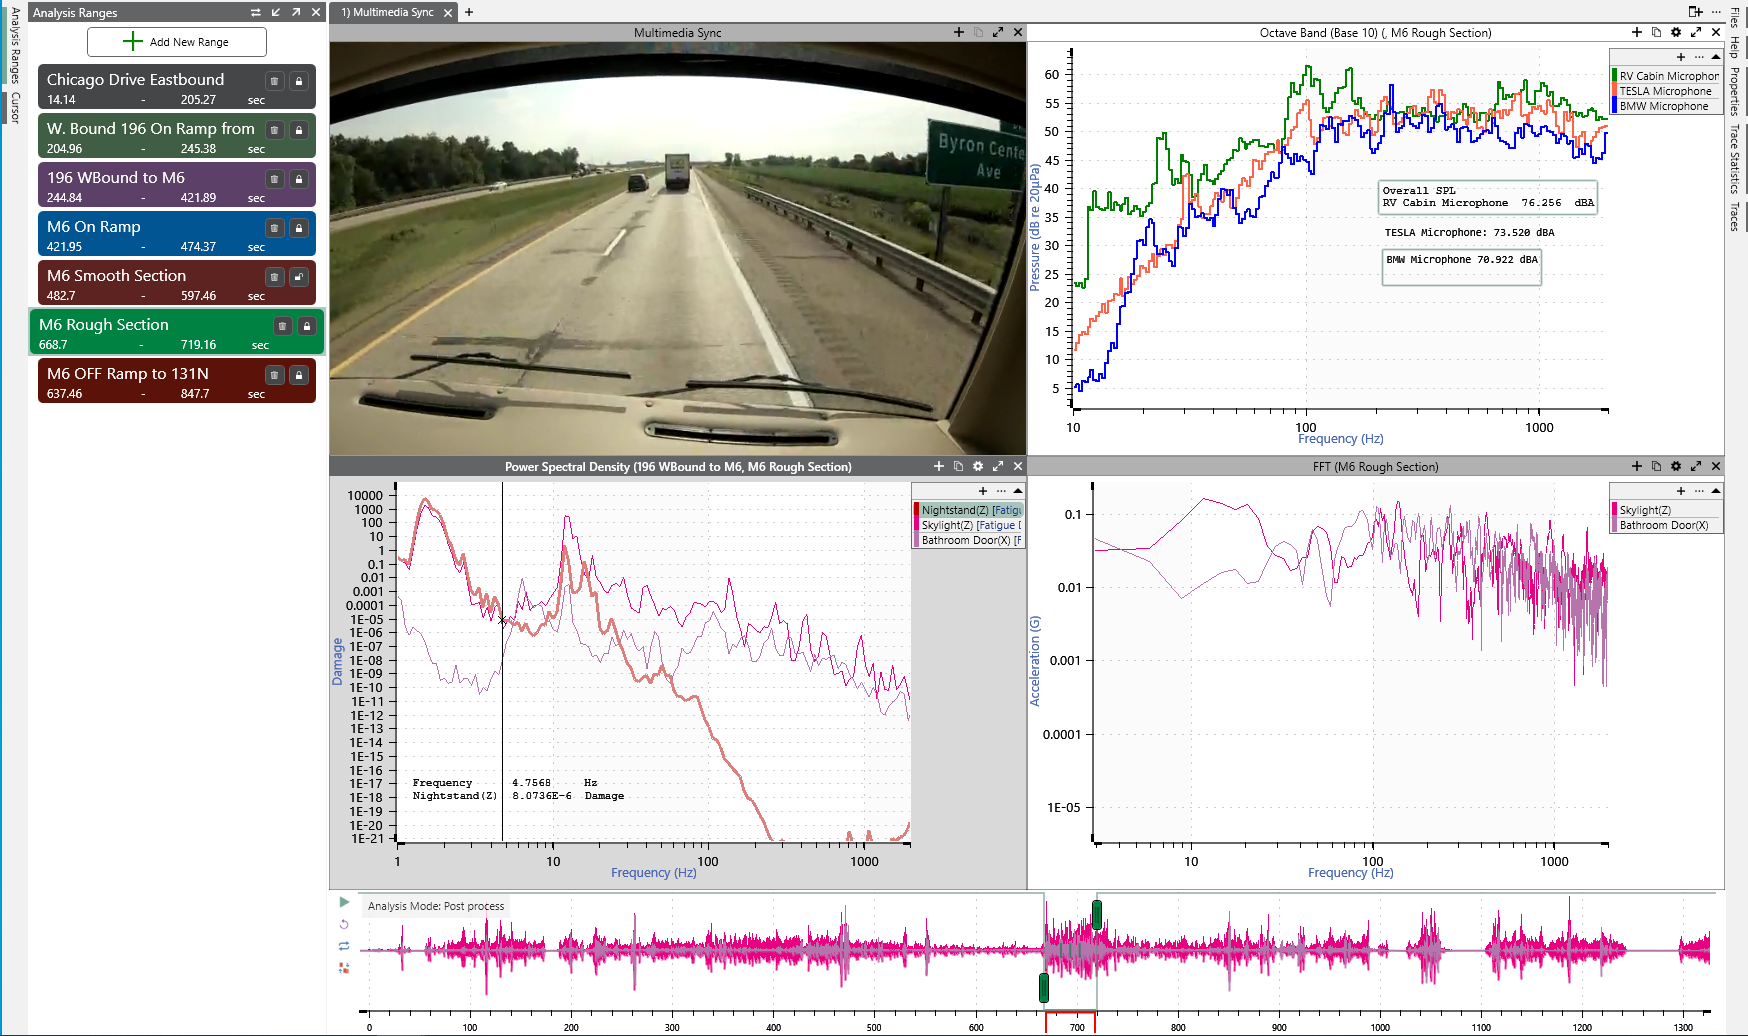
4. Multimedia Sync and GPS Map Plotting
Multimedia Sync plays video or audio files with a recorded waveform. The tool syncs the file(s) and waveform recording so customers can view the playback simultaneously, providing valuable information about the events that occurred during a recording, including the identification of events that led to resonance or failure. They can then extract images for a report.
Multimedia Sync is available with an Advanced license. With the Basic (free) license, customers can open a map view with associated GPS data markers. They can view the data as a map (MapVIEW) or in satellite view.
Watch: ObserVR1000 Porsche GT4 Track Day

5. Develop Test Profiles
ObserVIEW’s test development software options allow engineers to create custom test profiles that reflect the end-use environment. Test standards can omit potentially damaging peaks or over-test the component, leading to over-design. Engineers can improve their test profiles with field-recorded data.
The fatigue damage spectrum (FDS) creates a random test profile that is the damage equivalent to a recorded environment. ObserVIEW can convert an FDS into a single PSD profile and apply Kurtosion test acceleration to reduce testing time without using more energy. The shock response spectrum (SRS) creates a complex shock test profile from one or multiple recorded waveforms.
STAG uses order analysis/extraction and sine tone profile creation and acceleration to isolate, extract, and create an accelerated sine profile(s) from a recording. Along with FDS, STAG allows you to generate and accelerate a realistic SoR vibration test.
Download ObserVIEW
Download a free demonstration of the ObserVIEW signal analysis software and begin analyzing and editing waveforms straight away. Interested in learning more? Visit the software page.