Random Testing Software
Gain a comprehensive understanding of a machine’s response to the vibrations it encounters in the operational environment.
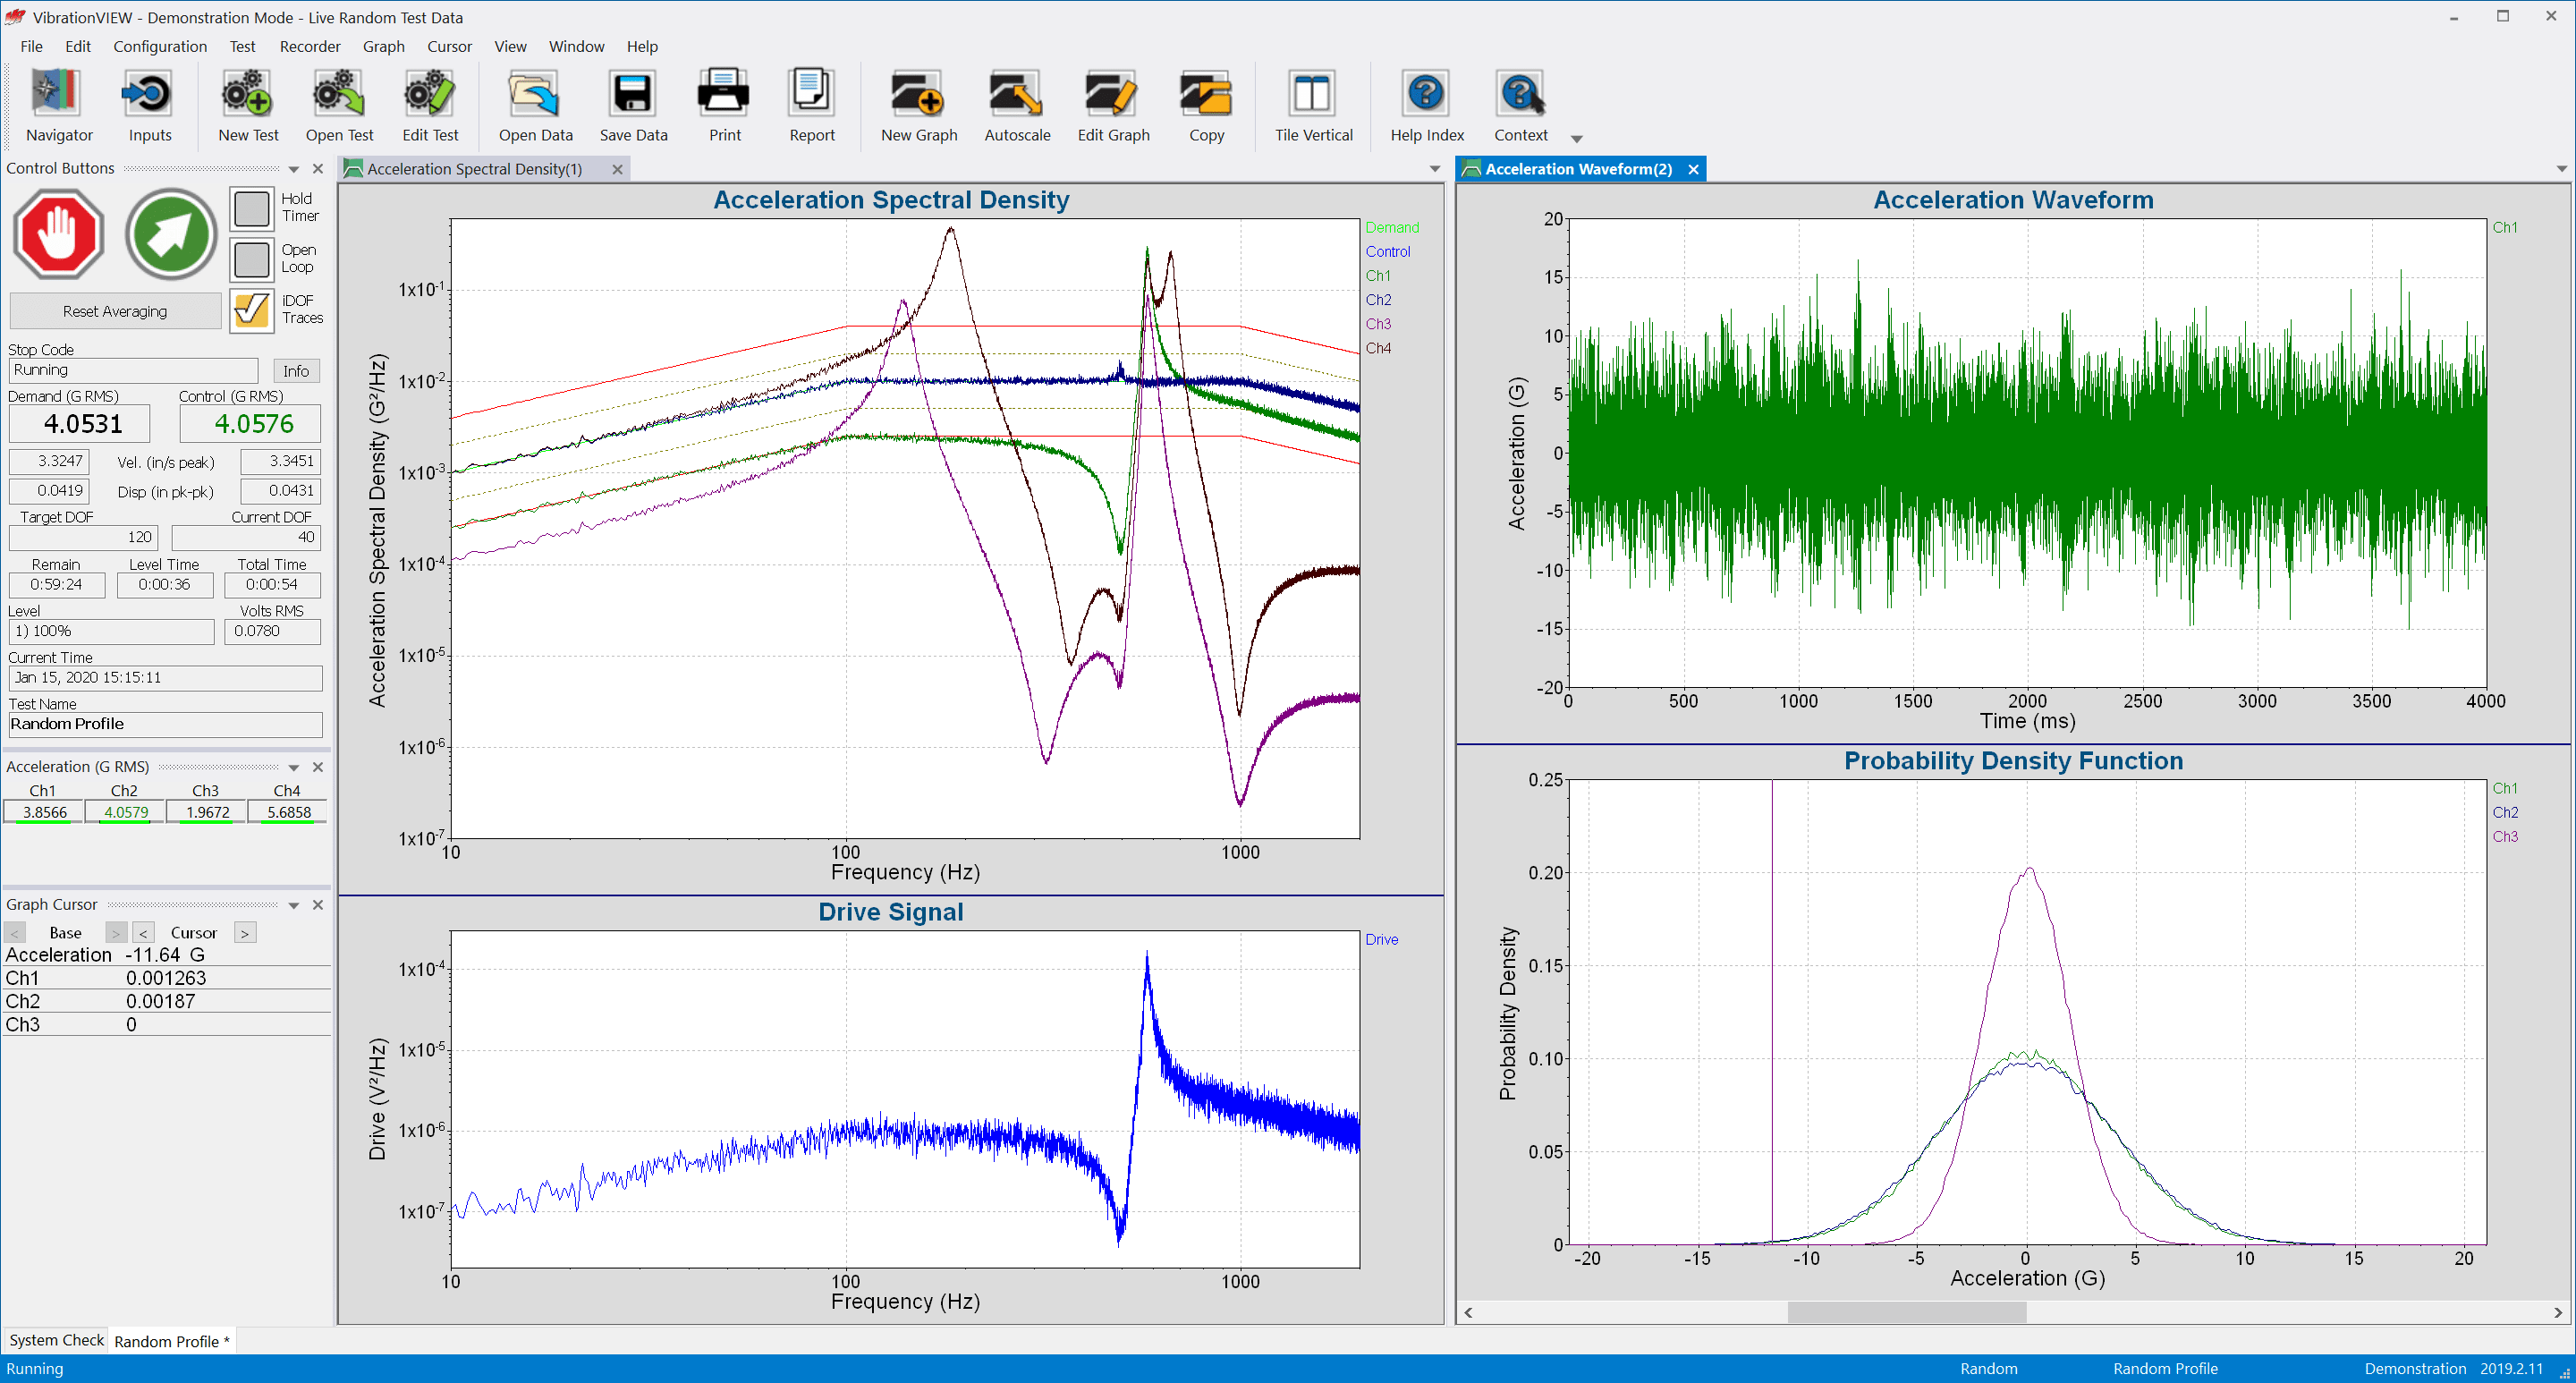
With up to 104,000 lines of resolution, the VibrationVIEW Random software provides the highest possible control in an easy-to-use format. Analyze random data with a comprehensive suite of graph display options or generate a test from recorded data with our advanced test development options.
Available graph displays in Random include power/acceleration spectral density (PSD), scatter plot, and kurtosis versus time.
Additional Software Modules
Review data from product testing to determine the source(s) of unwanted vibration.
Sine
Random
Shock
Shock Response Spectrum (SRS)
Sine Resonance Track & Dwell (SRTD)
Kurtosion
Fatigue Damage Spectrum (FDS)
Mixed Mode
Fulfill Test Specifications
Generate test profiles or enter specifications with ease. The VibrationVIEW interface is intuitive and user-friendly, and the software is industry-leading. Access standard vibration testing modes built for ease of use and advanced features you won’t find anywhere else.
Analyze Rotating Components
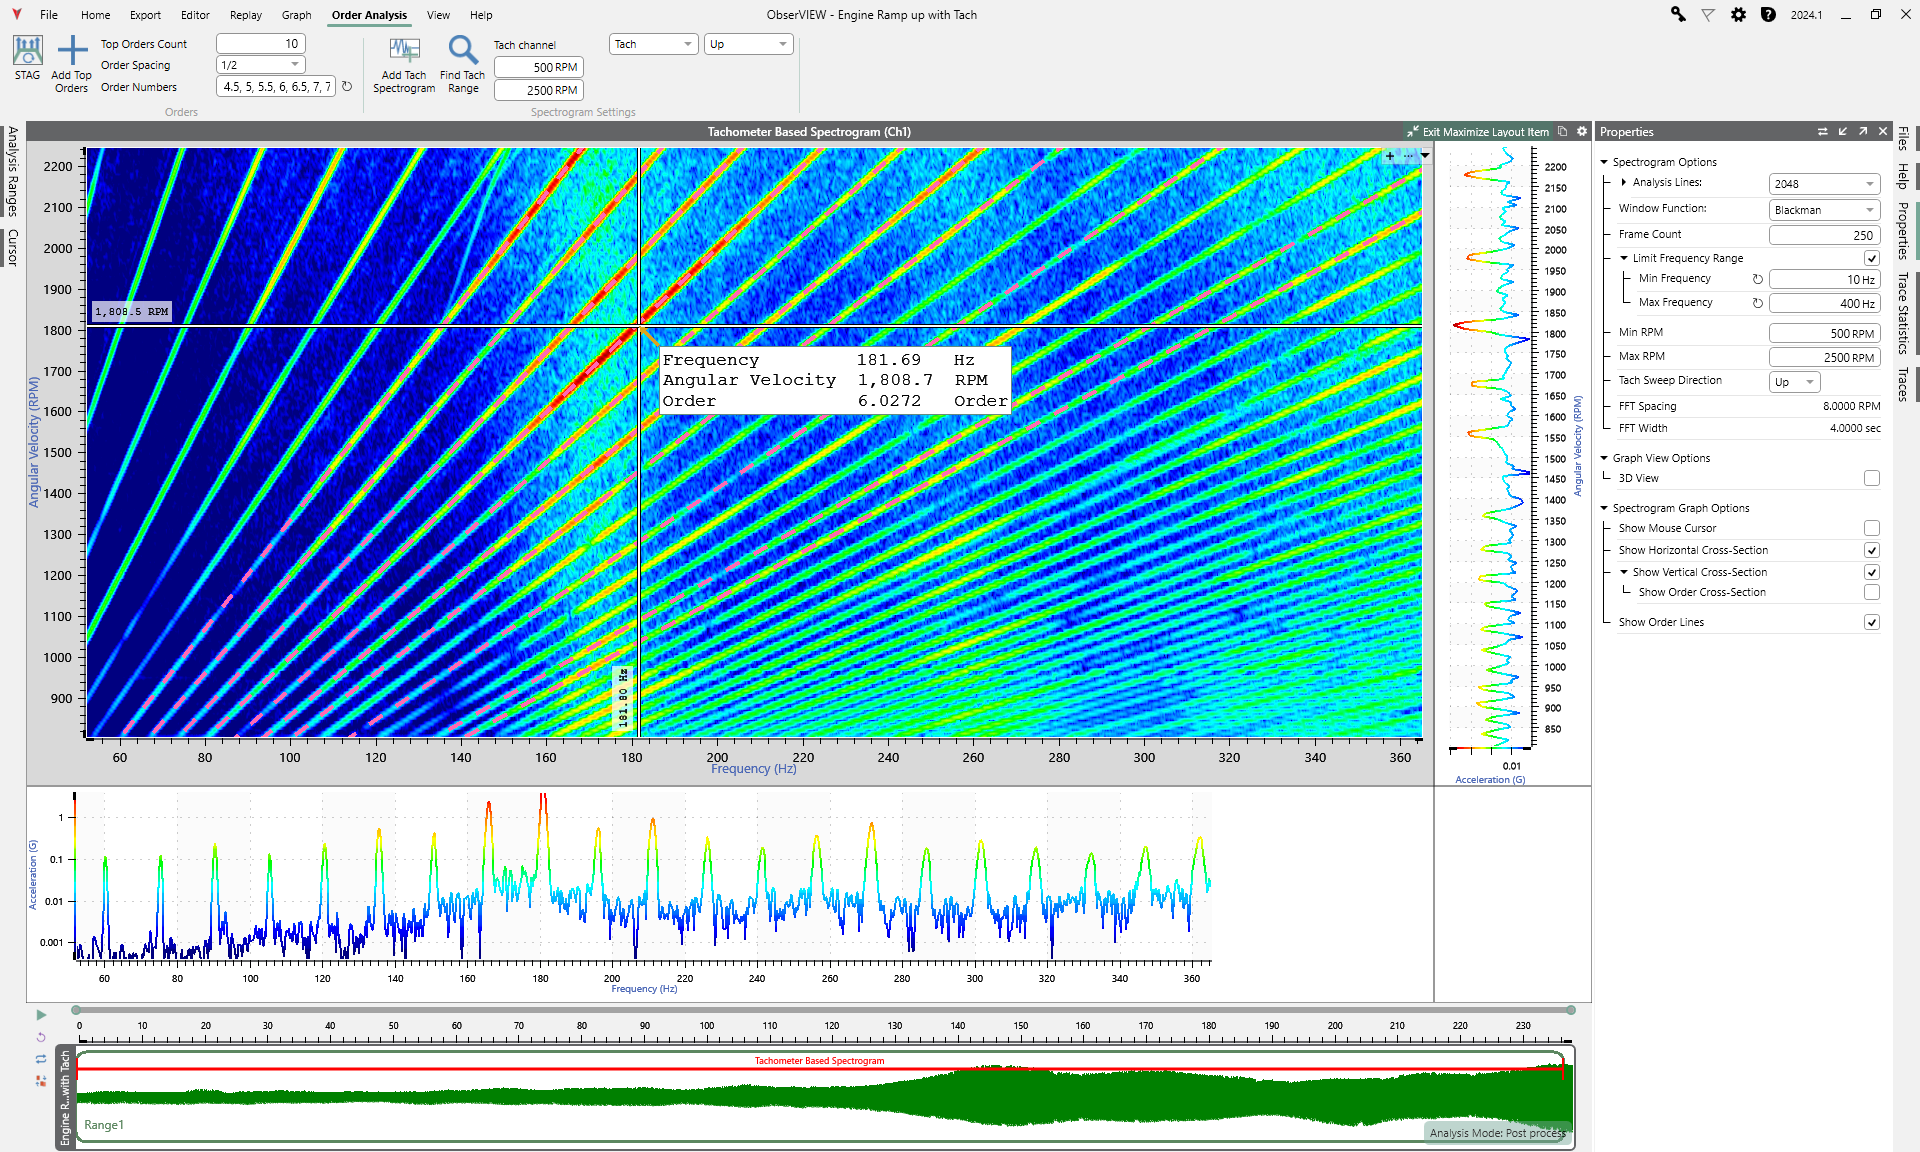
Order analysis separates rotational or reciprocating vibration into orders. Fatigue and damage are often related to harmonics, and analysis of order content helps to locate and prevent product failure. Analyzing order content is critical for a complete evaluation of rotating machinery.
In the ObserVIEW Order Analysis software, extract orders of interest from a recording using a defined tachometer channel. Access tachometer-based spectrograms, compare data across domains, and generate a sine-on-random test with STAG.
Identify Resonances
Resonance occurs when an external excitation vibrates at a machine component’s natural frequency. The resonance increases the intensity of the natural vibration and leads to damage or failure.
Sine Testing
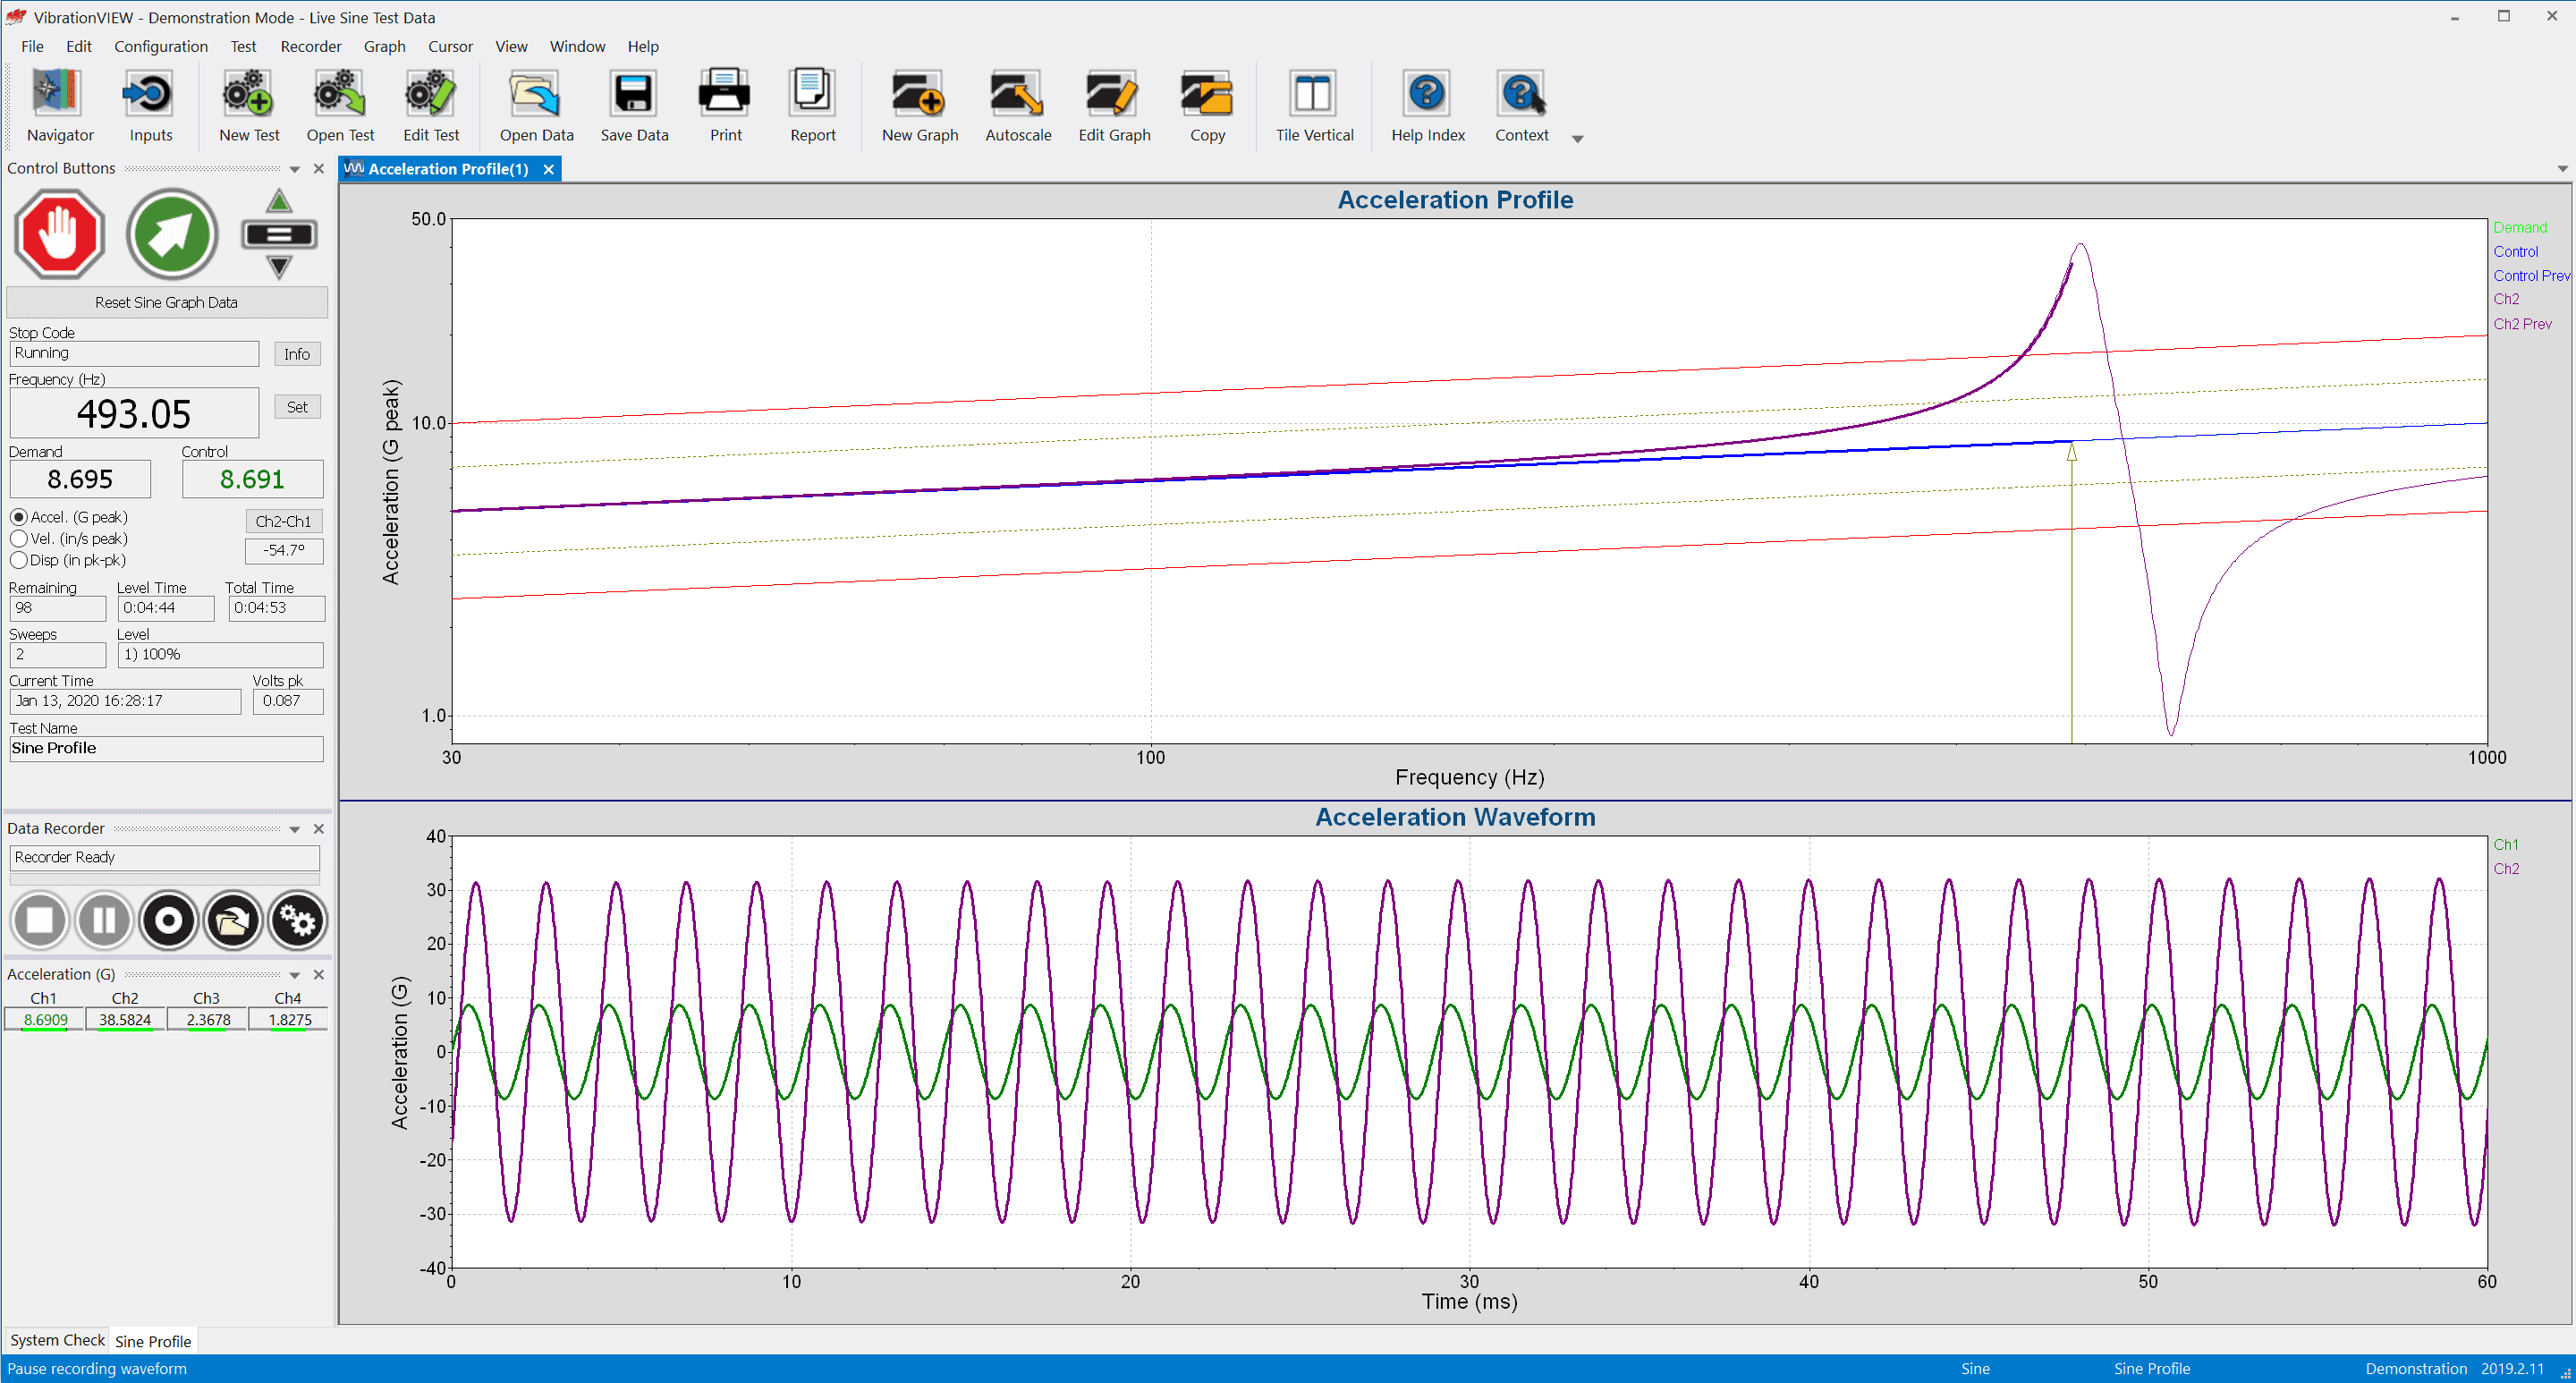
In the VibrationVIEW Sine software, automatically detect resonances using a swept and/or fixed-frequency sine wave test with control of acceleration, velocity, and displacement. Then, use a sine resonance tracked dwell (SRTD) test to determine the number of cycles required to generate a failure at a specific resonant frequency.
Features include easy test entry, configurable tracking filters on input channels, and a large numeric readout.
Modal Testing
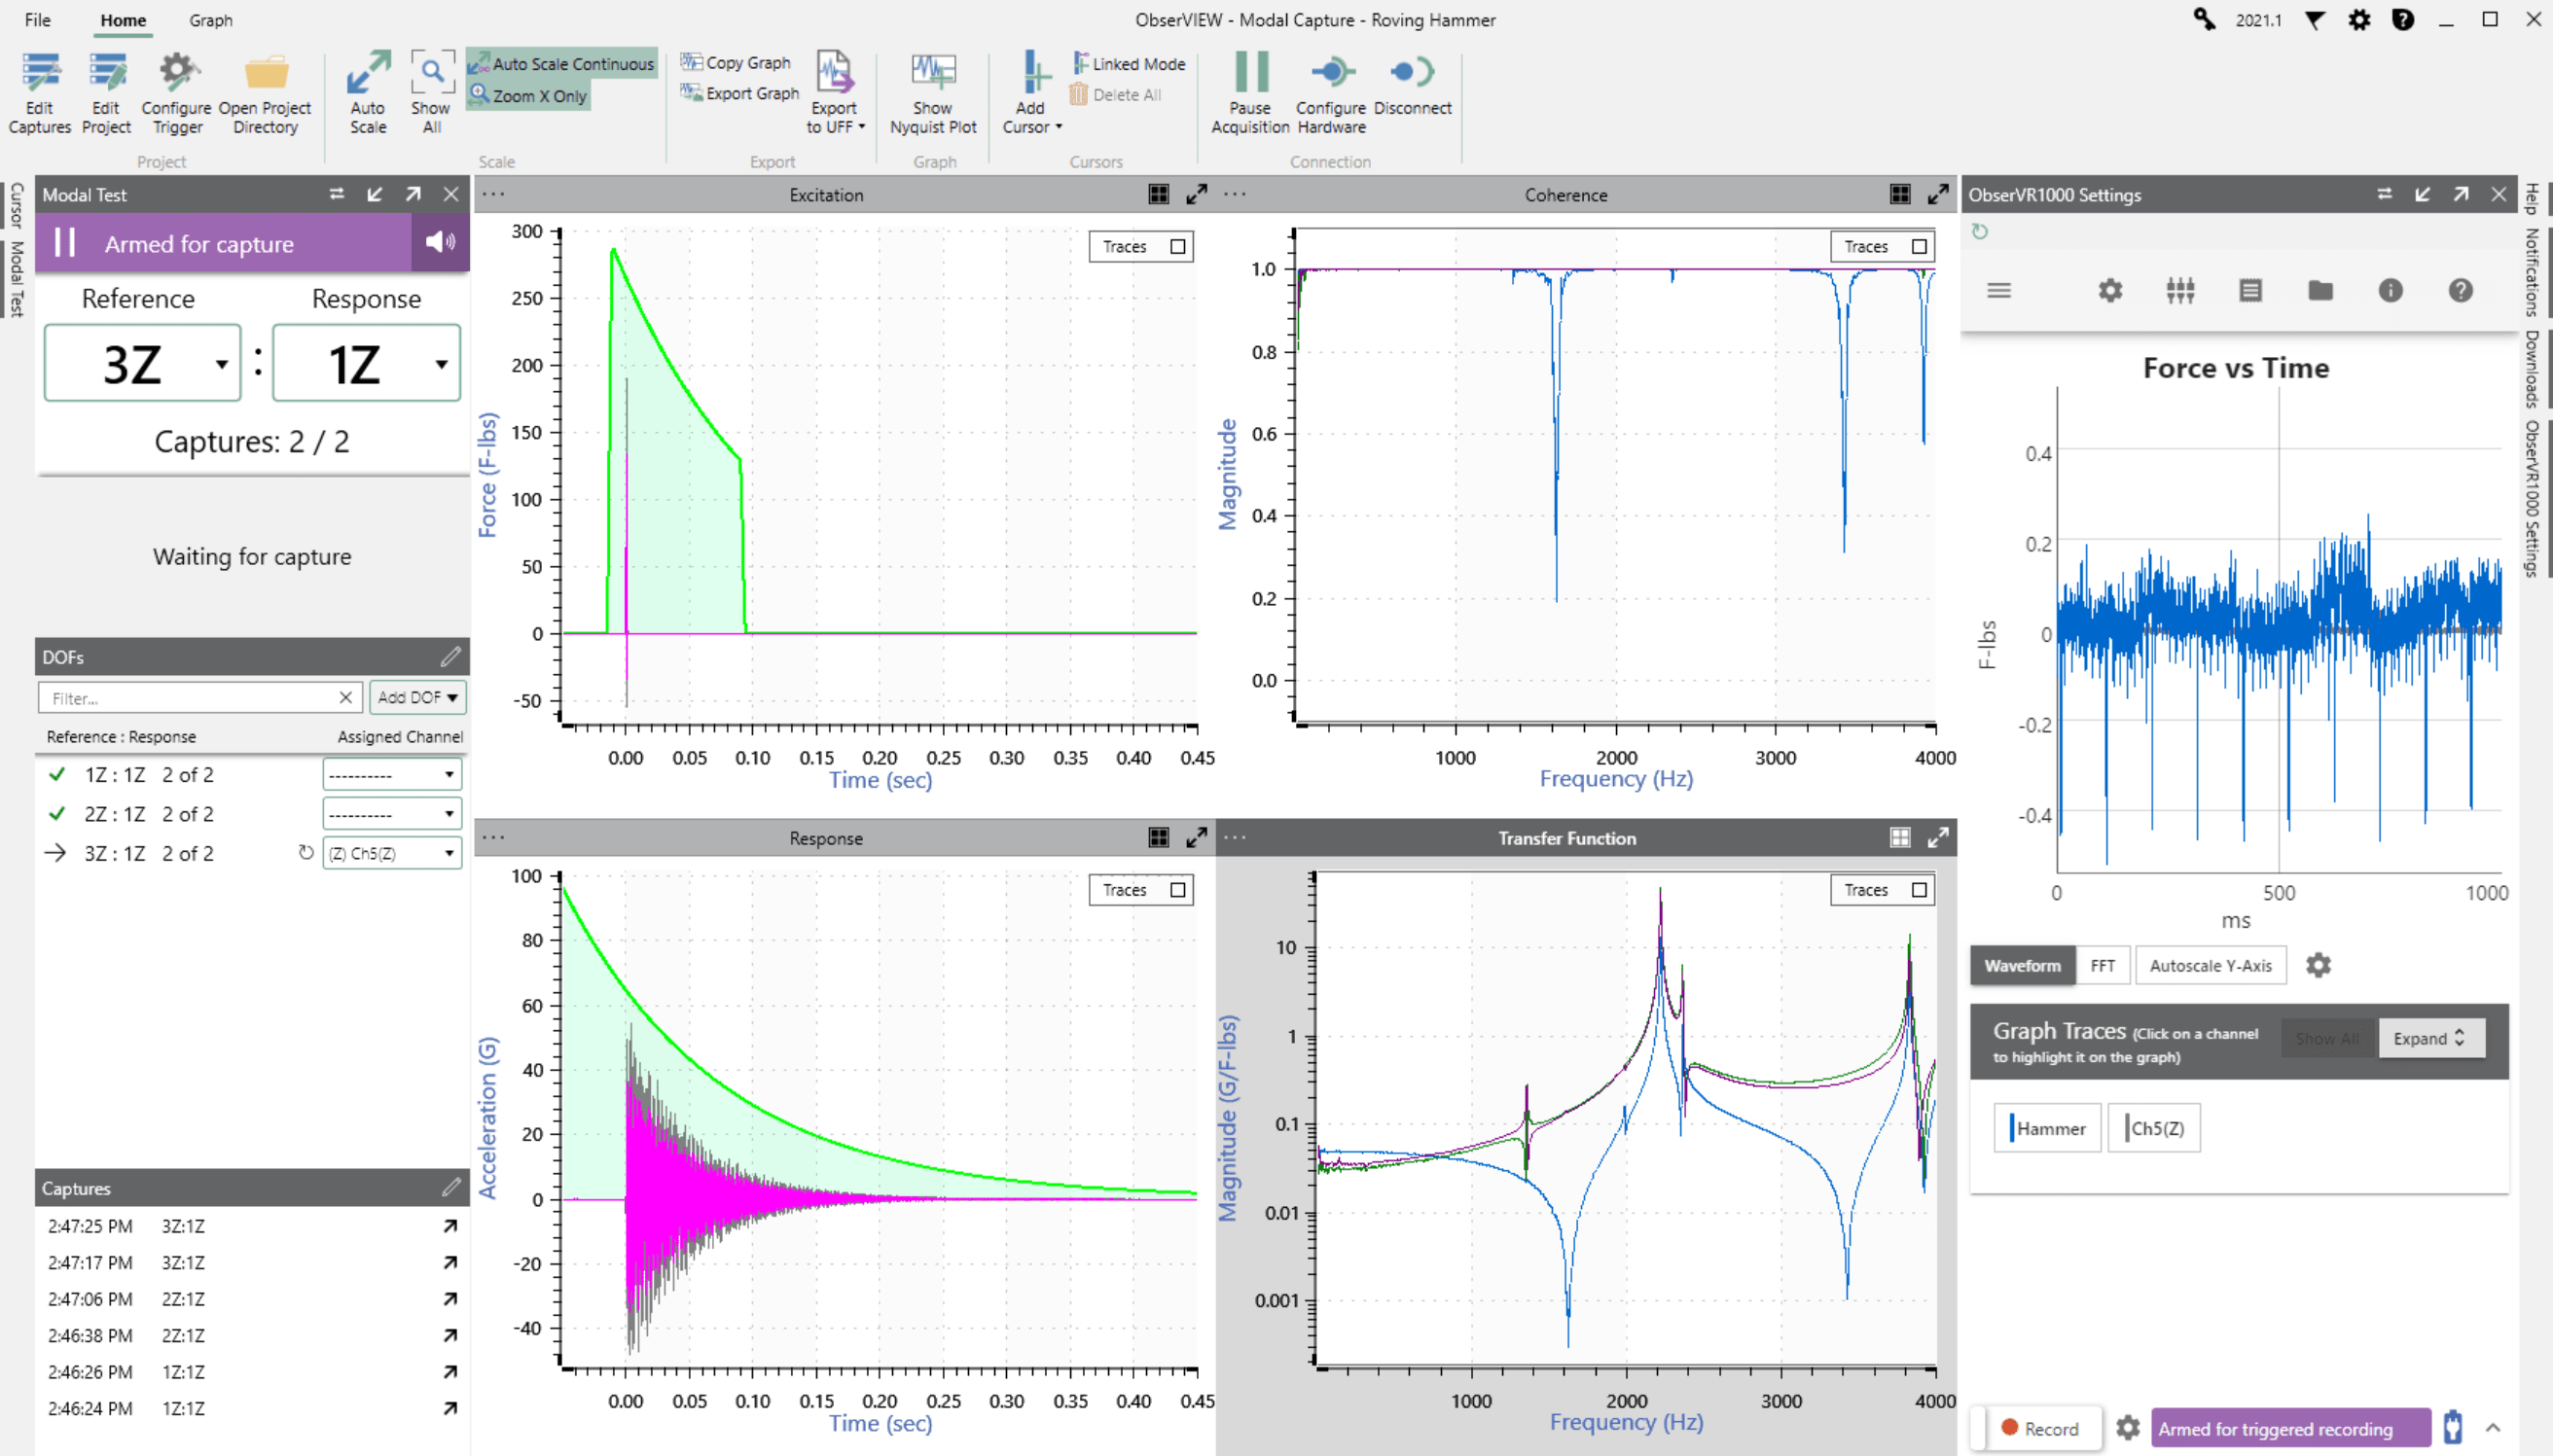
Modal software divides a complex response into simple mode shapes, each with individual parameters that describe the item’s response to excitation. The overall response helps engineers determine resonances and validate the design.
With the ObserVIEW Modal Testing software:
- Manage table of hits per location and review responses
- Average multiple data acquisitions
- Calculate decay rate from transient ring-down events
- Manage the acquisition channel using a large, interactive display
- And more!
Real-time Machine Monitoring
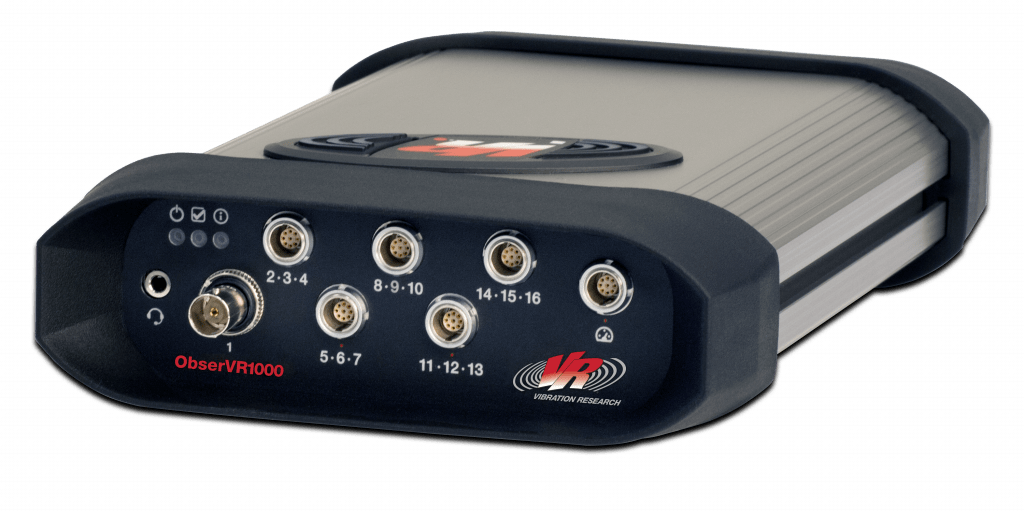
With ObserVIEW Live Analyzer and the ObserVR1000, you don’t have to wait until post-process to begin data analysis. View recorded data in real-time and then pause the live stream to select, analyze, and export a section of the time waveform.
Access the ObserVIEW graphing packages, employ averaging, analyze tachometer channels, and more.
FFT Spectrum Analysis
Perform efficient data analysis on live data or an imported file with the fast Fourier transform (FFT). View changes in frequency and amplitude in a waveform, highlight harmonic excitation in a broad frequency range, and more.
Features of ObserVIEW FFT Analysis include:
- Up to 1,048,576 analysis lines (user-defined)
- Industry-standard window functions with comprehensive support for the selection process
- Standard, harmonic, and RMS cursor types and more
- Quick reporting features, including copy-and-paste functionality
- Live computation of data with Live Analyzer
- AVD conversion (acceleration, velocity, displacement)

