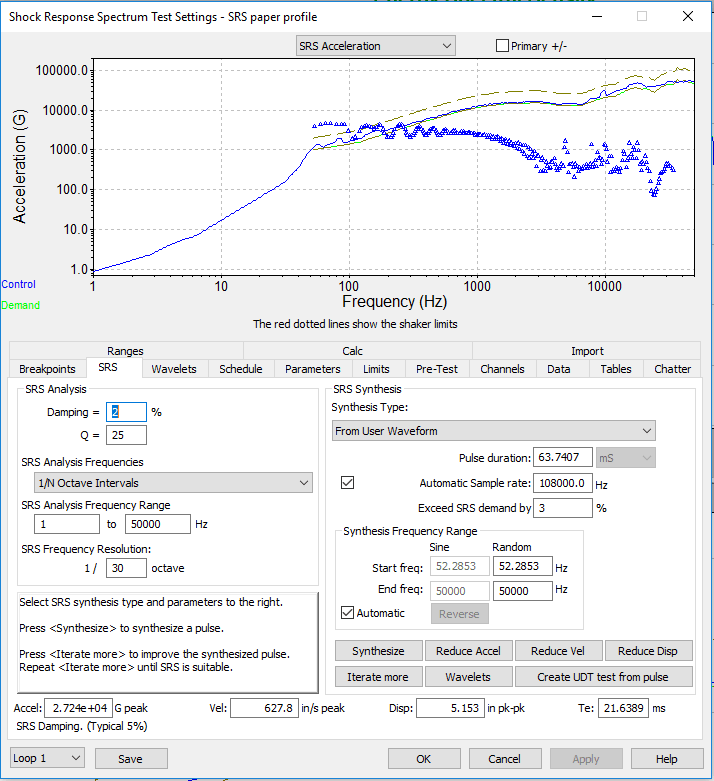
The Shock Response Spectrum (SRS) software option adds SRS plots to VibrationVIEW’s Shock and Transient Capture test modes. Define the SRS parameters and synthesize a pulse to meet a specified curve. The software includes a variety of waveform synthesis generation techniques.
Define the SRS test settings and synthesize a pulse to meet a specified curve. VibrationVIEW supports over 200 individual breakpoints, suitable for virtually any test specification.
Test generation techniques include:
Linear and exponential chirp
WavSyn
Burst random
Linear and exponential chirp on burst random
Enveloped random
Burst sine
Alternatively, iterate an SRS curve from a field-recorded time waveform.
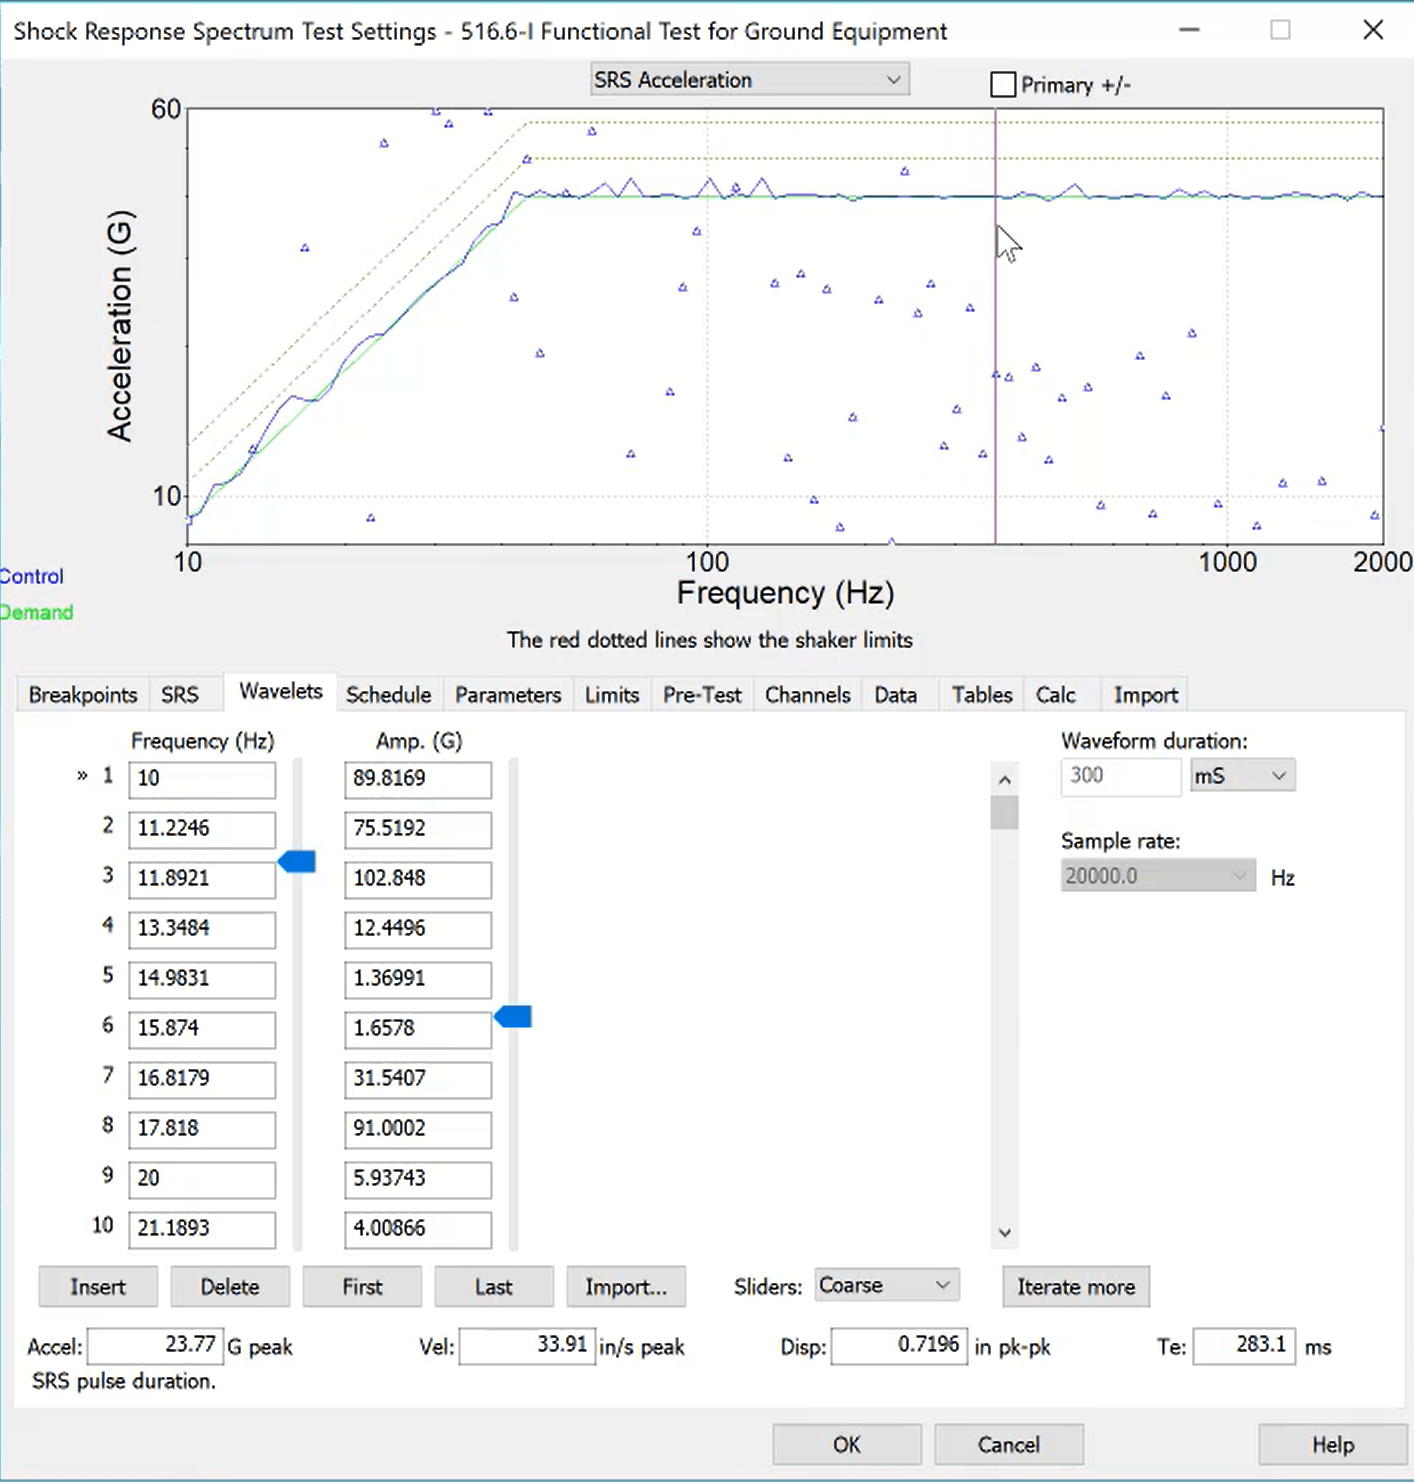
Waveform Synthesis
Manually adjust the parameters of the underlying wavelets or allow VibrationVIEW to automatically create and run a test without intervention.
Additional Software Features
Enter individual tolerance bands for each frequency
Import frequency and amplitude breakpoints from a text file
Define parameters Te and TE for MIL-STD-810
Exceed SRS demand to meet or exceed specifications with a minus tolerance of 0%
Fundamentals of VibrationVIEW - Shock Response Spectra (SRS)
Graphing Capabilities
SRS pseudo velocity and SRS acceleration plots
Acceleration for primary (+), primary (-), or maxi-maxi
IEEE-344 graphs
and more
Generate Professional Test Reports with Ease
Fulfill all your test reporting needs with user-friendly options for customization. VibrationVIEW can generate vibration test reports as a docx, PDF, HTML, or Excel file and includes a built-in Report Builder.
Common SRS Test Specifications
IEEE-344: seismic qualification of electrical equipment in nuclear power plants
QME-100: ASME standard; seismic qualification of mechanical equipment
AC-156: seismic qualification of structure and equipment integrity
ISO 4866.2010: measurement of vibration and evaluation of the effect on structures
ISO/TS 10811-1:2000: vibration and shock in buildings with sensitive equipment
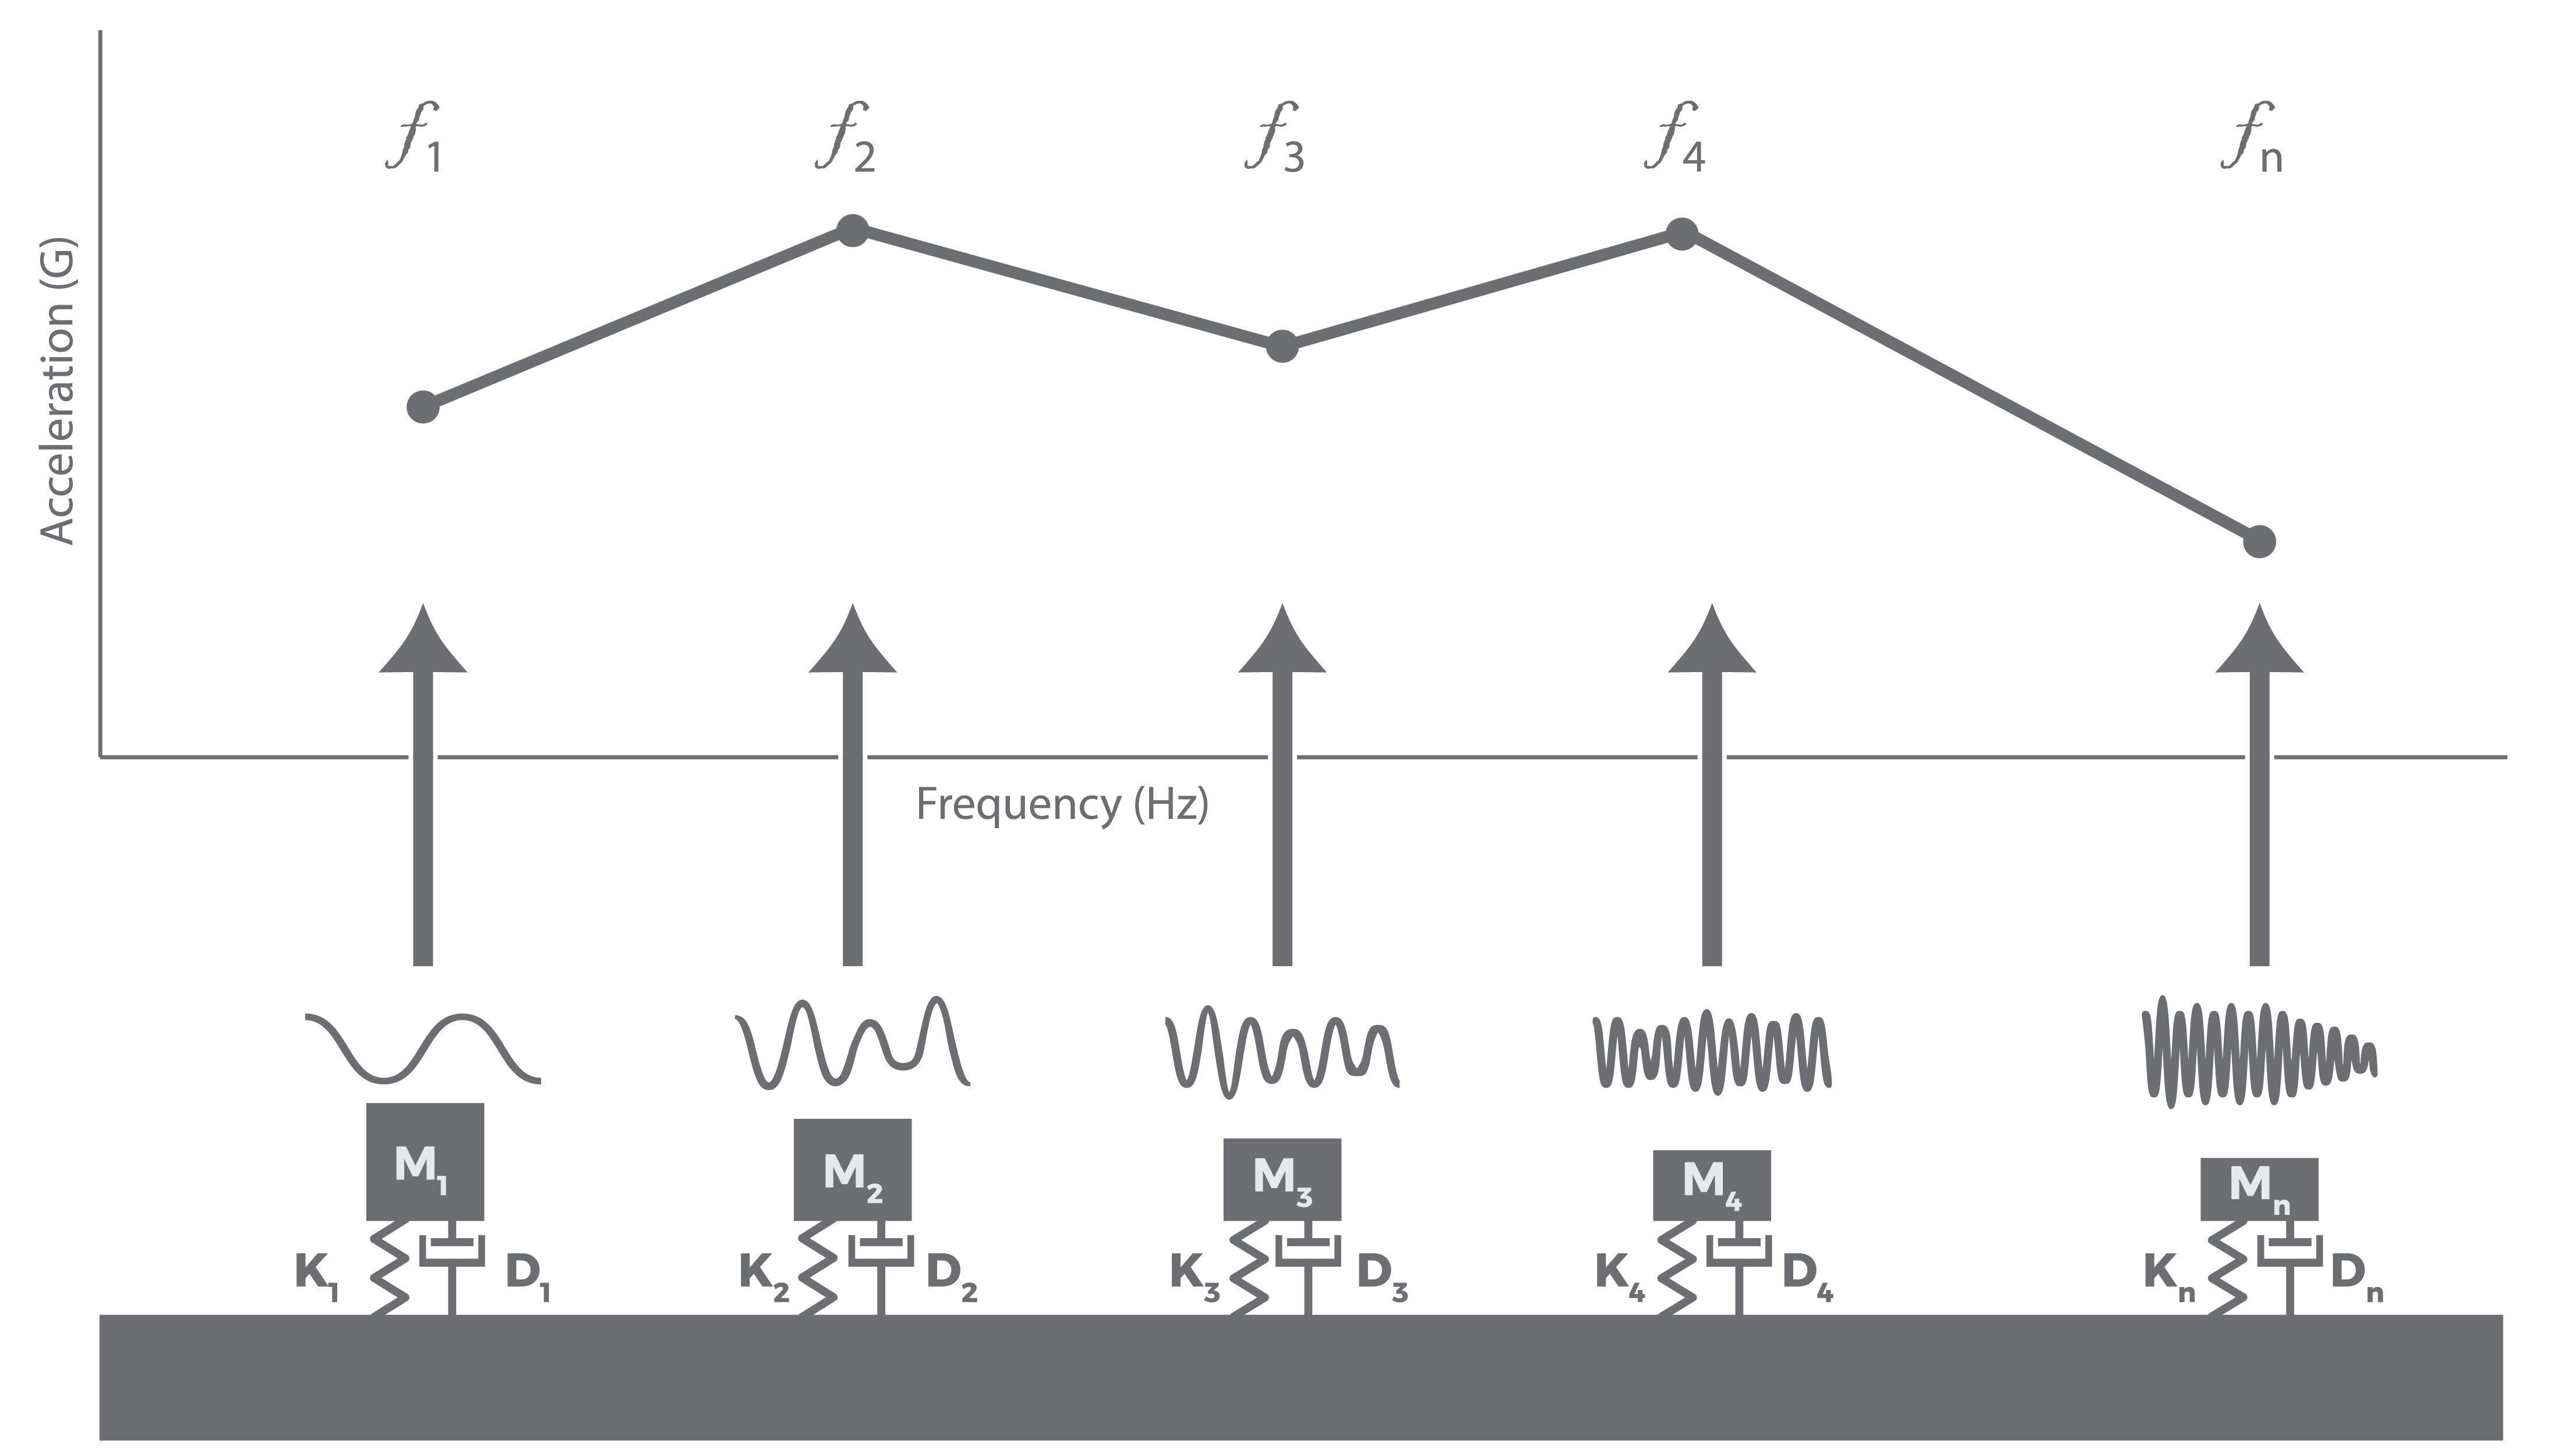
What is the SRS?
The SRS is a model of a test article’s maximum response to a transient event. Engineers use a synthesized SRS pulse to evaluate the test article’s behavior during and after a complex shock event, such as earthquakes, rocket separation, and shipboard shock.
Unlike classical shock tests that use predefined pulse shapes, SRS testing defines a target response. Engineers synthesize a time-domain waveform that produces the required response spectra.
Potential Applications
Describe a transient event in general terms
Estimate the damage potential of a shock event
Design structure resonances
Define test specifications (particularly for seismic tests)
Replicate failure modes
Tech Talk
This VR tech talk discusses the process of developing SRS test specifications, including common problems and suggested practices.
Common Issues in SRS Testing
Pyroshock (Pyrotechnic Shock) Testing
Pyroshock testing simulates pyrotechnic events or explosive loading that occur in real-life applications such as rocket separation. These events are characterized by high-G peaks at high frequencies and short durations and affect components with high natural frequencies, such as small electronics and lightweight components.
Engineers can use a shaker or mechanical excitation to generate short-duration transient motion that simulates shock waveforms experienced by far-field components. These tests are often qualified by the damage potential of the resulting SRS compared to that of the pyroshock event.
Standards
ECSS-E-ST-10-03C
GEVS: GSFC-STD-7000A
MIL-STD-810G, Method 517
NASA STD 7003
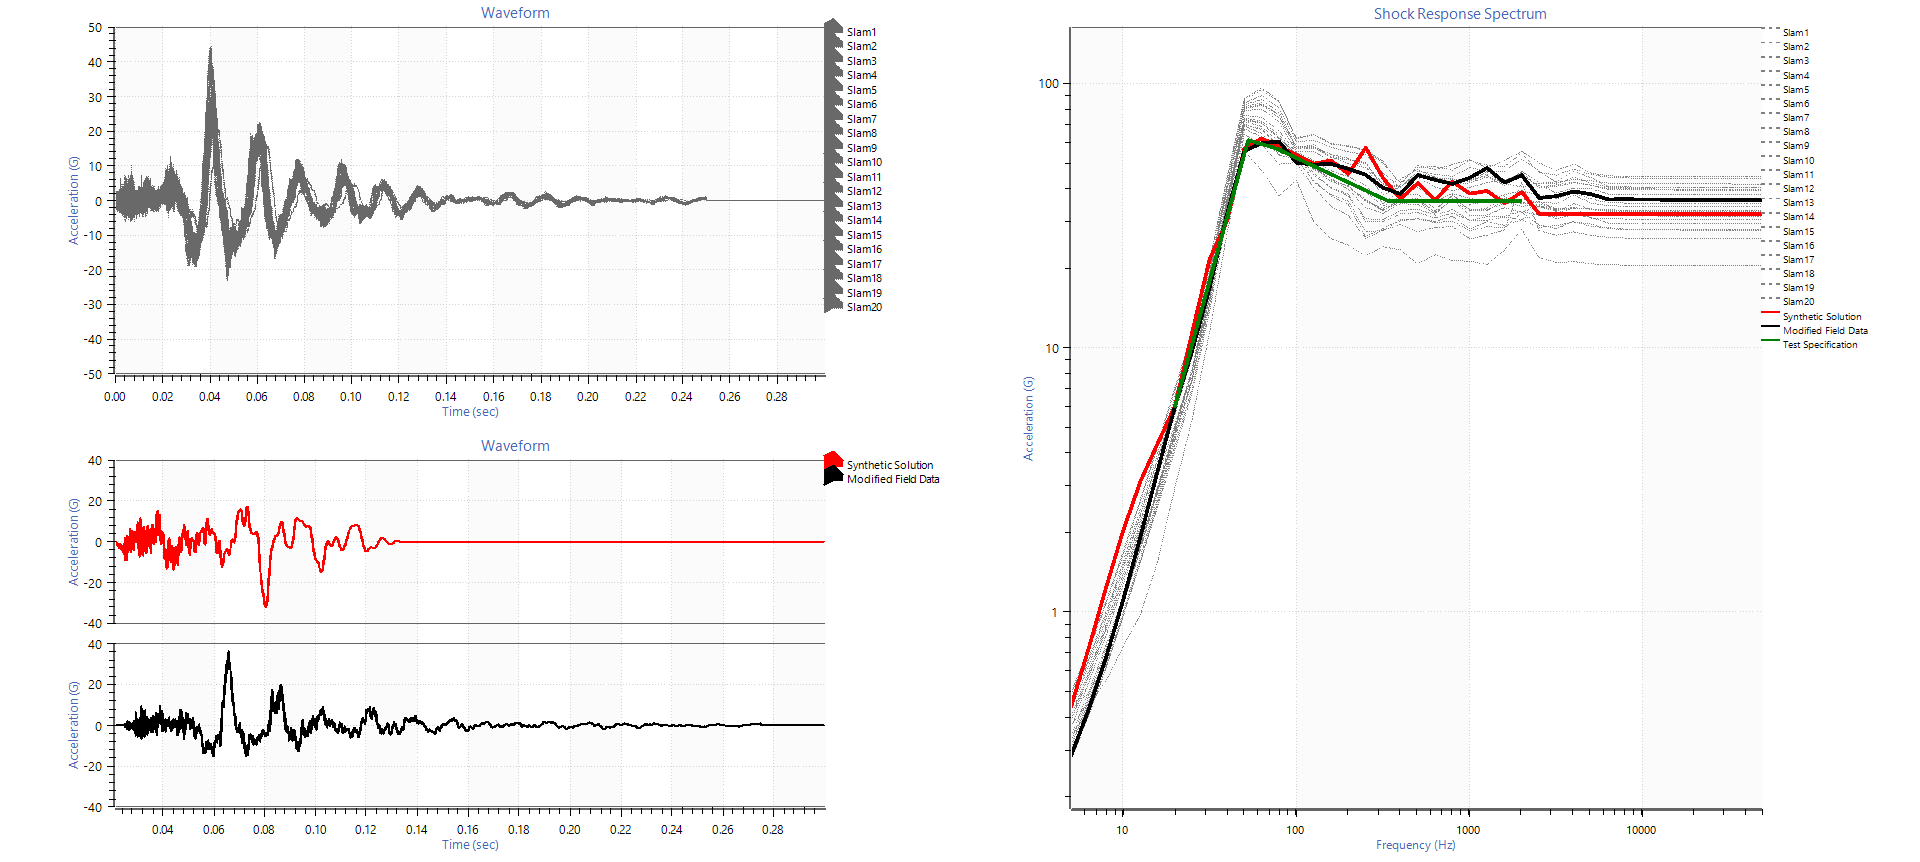
Develop an SRS with Field-recorded Data
In VibrationVIEW, you can modify a field-recorded time waveform to meet or exceed a specified SRS curve. The resulting time waveform reflects the end-use environment and has the same frequency response function.
A waveform based on an enveloped set of field recordings maintains real-world characteristics and creates an SRS waveform that accurately reflects the real-world application. Learn more: Using Recorded Data to Improve SRS Test Development.
SRS Analysis
Analyze field data, develop spectra from recorded data, and compare the potential damage of test profiles in VR’s ObserVIEW analysis software.
Evaluate the test repeatability of the shock source level
Evaluate the effects of various test configurations
Compare test simulation versus real life
Compare resonance before and after random testing
Compare damage of a single shock pulse versus multiple occurrences