Abstract
Random vibration test specifications are likely to specify a degrees-of-freedom (DOF) value. Statistical DOF help to define confidence intervals and the probability of meeting tolerance. An understanding of the DOF calculation will help to clarify the purpose of the defined value.
QUESTION
What is statistical degrees-of-freedom? How do you achieve a defined DOF value?
ANSWER
What is statistical degrees-of-freedom?
Statistical degrees-of-freedom (DOF) is relevant when performing random vibration testing. This property derives from the computation of an averaged random power spectral density (PSD) using the fast Fourier transform (FFT).
In short, the averaged PSD of a Gaussian waveform is a chi-squared distributed random variable with (2*F) DOF, where F is the frames of time data. Thus, confidence intervals and the probability of meeting tolerance can be computed from the equations that define the chi-squared distribution. A more detailed explanation of the calculation of the averaged random can be found here.
How do you achieve a defined DOF value?
Often, vibration test specifications will define the desired DOF. Reaching the defined value may require the adjustment of several test settings such as window functions and overlap.
**Note: for DOF calculations to be accurate, the time waveform must be stationary.**
Window Functions and Overlap
Time to acquire (N) DOF with 50% overlap = 0.25 * (N) * (lines) / (maxfreq)
When frames of data are assumed to be independent, the DOF equals 2x the number of frames. However, when frames are overlapped and window functions are applied, the frames are no longer independent. As such, the effective DOF of the average is no longer a multiple of the number of frames.
Instead, the DOF can be estimated by simulating data with the specified overlap and window function applied, computing the statistics of the resulting PDF, and comparing the statistics to a Chi-squared distribution with a known DOF. The following DOF calculator can be used to assess the probability of a random vibration test being within tolerance.
DOF CalculatorGenerally, with a 50% overlap and a window function, the DOF is close to 2x the number of frames. A 75% overlap achieves a DOF of about 1x the number of frames. Therefore, the effective DOF for a given time interval can be doubled by applying a 50% overlap.
The following image displays a typical set of random test settings. An update interval of 1.0 sec means the DOF will update at roughly 2 DOF/sec. For example, a 100 DOF test will take about 50 sec at level to reach the desired amount of averaging.
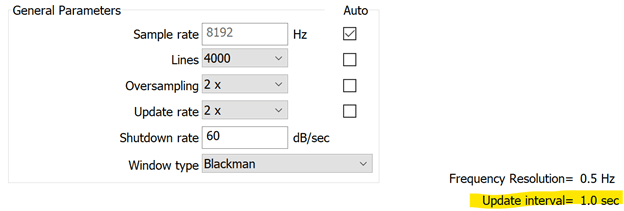
An update interval of 1.0 sec for a random test.
The update rate (also called overlap percentage) changes the required step size between each FFT frame block with respect to the window type. At a 1x update rate (0% overlap), each frame equals exactly 2 DOF. At a 2x update rate (50% overlap), each frame is < 2 DOF. And, at a 4x update rate, each frame’s DOF contribution is smaller than the amount at the 2x update rate. The number will depend on the type of window function.
The DOF value increases linearly with each new FFT frame until the desired value is reached. Then, the system transitions to exponential averaging to provide a rolling DOF average. The rolling average has a time length equal to the linear averaging duration.
We recommend adjusting settings in Demonstration Mode before running the test on the real shaker system to determine how long it takes to reach the desired DOF.
Variables of Statistical DOF
Statistical degrees-of-freedom (DOF) depends on:
- Sample rate
- FFT analysis lines
- Overlap percentage
- Window function
The ObserVIEW analyzer software can be used to illustrate the interaction of these four variables concerning statistical DOF. As an example, consider the following time waveform data:
Sample Rate: 20,000Hz
Length: 983,040 samples
Length (Time): 49.152 sec
Analyzer settings:
- Analysis Lines: 16,384
- Window Function: Blackman
- Averaging DOF: 60
- Averaging Mode: Linear
The effect of each variable is defined below.
Sample Rate and Analysis Lines
The interaction between sample rate and FFT analysis lines is the simplest of all four to explain. The FFT size equals two times the FFT analysis lines. Therefore, 16,384 analysis lines value requires 32,768 samples of time data to compute one FFT block. From there, we can conclude that one FFT requires 1.6384 sec of time data (16,384 * 2 / 20,000).
A 0% overlap creates a unique situation because each FFT frame equals two DOF. To achieve 60 DOF at 0% overlap, we need 30 FFT frames. From there, we can equate the total time as 1.6384 sec * 30 FFT frames = 49.152 sec.
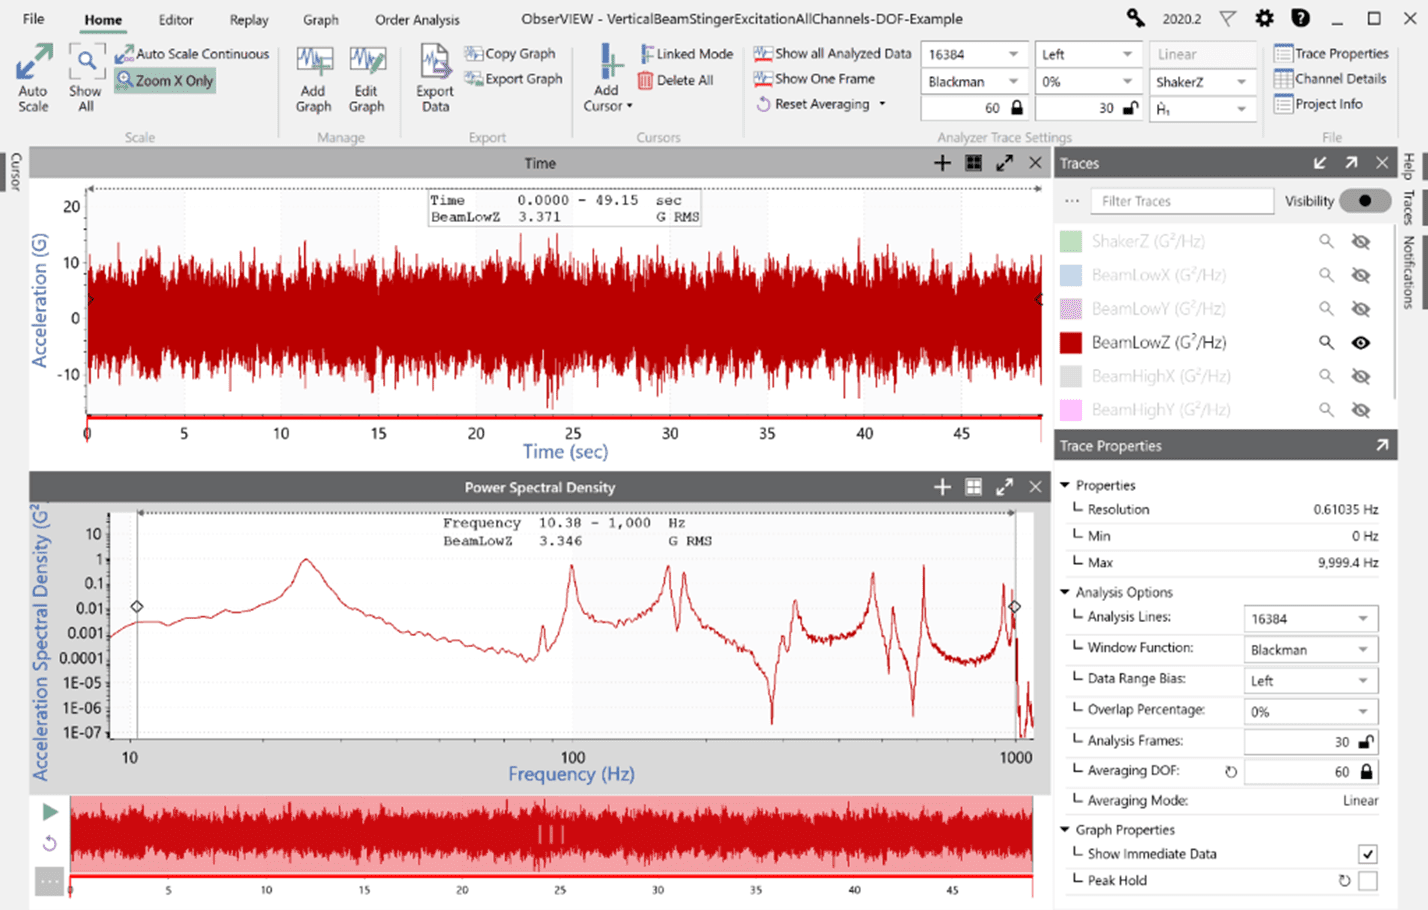
Zero-percent overlap.
Overlap Percentage
If the overlap percentage is changed to 50%, 30 FFT frames are still needed to reach 60 DOF, but the FFT blocks can be overlapped by roughly 50% in the time domain (not exactly 50%: see the “Window Function” section below). In doing so, the required time to reach 60 DOF is reduced to 25.38 sec (a 0% overlap requires 49.15 sec.)
The data being analyzing is stationary, so the resulting G RMS in the time domain and frequency domain are roughly equal, even though the time analyzed is about half.

Fifty-percent overlap.
The following image is a representation of a 50% overlap if the windowed time waveform subsets from each FFT were superimposed on top of the original data and spaced apart by the time required for the desired DOF.
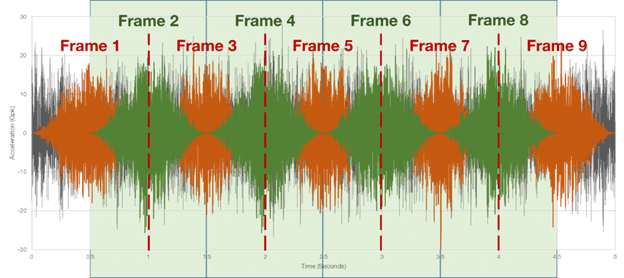
Windowed time waveform with a 50% overlap.
If the overlap percentage is changed to 75%, the time required to achieve 60 DOF drops to 21.30 sec. However, the required FFT frames jump from 30 to 49 frames.
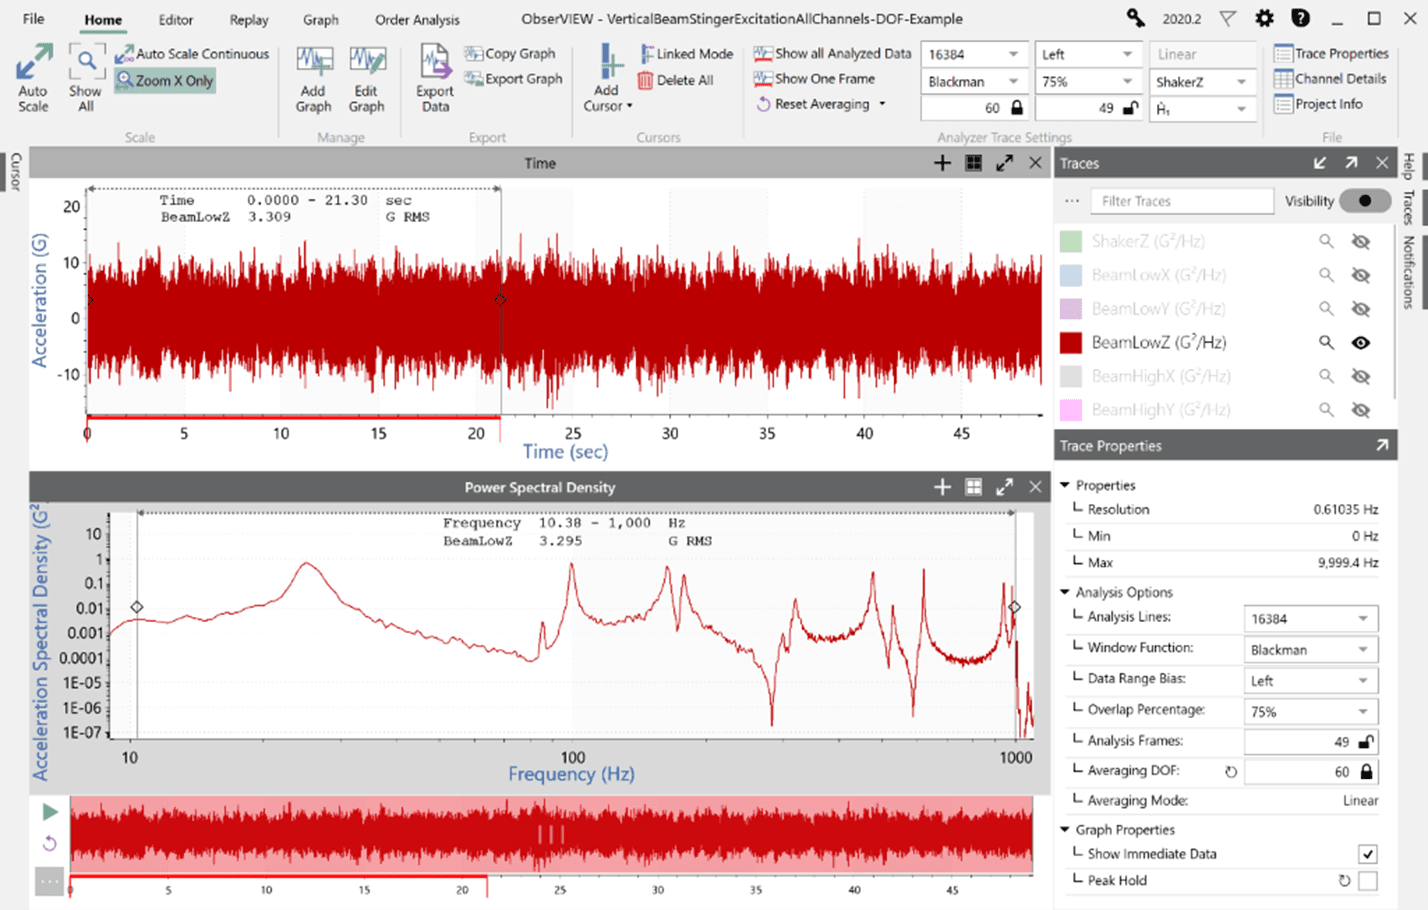
Seventy-five-percent overlap.
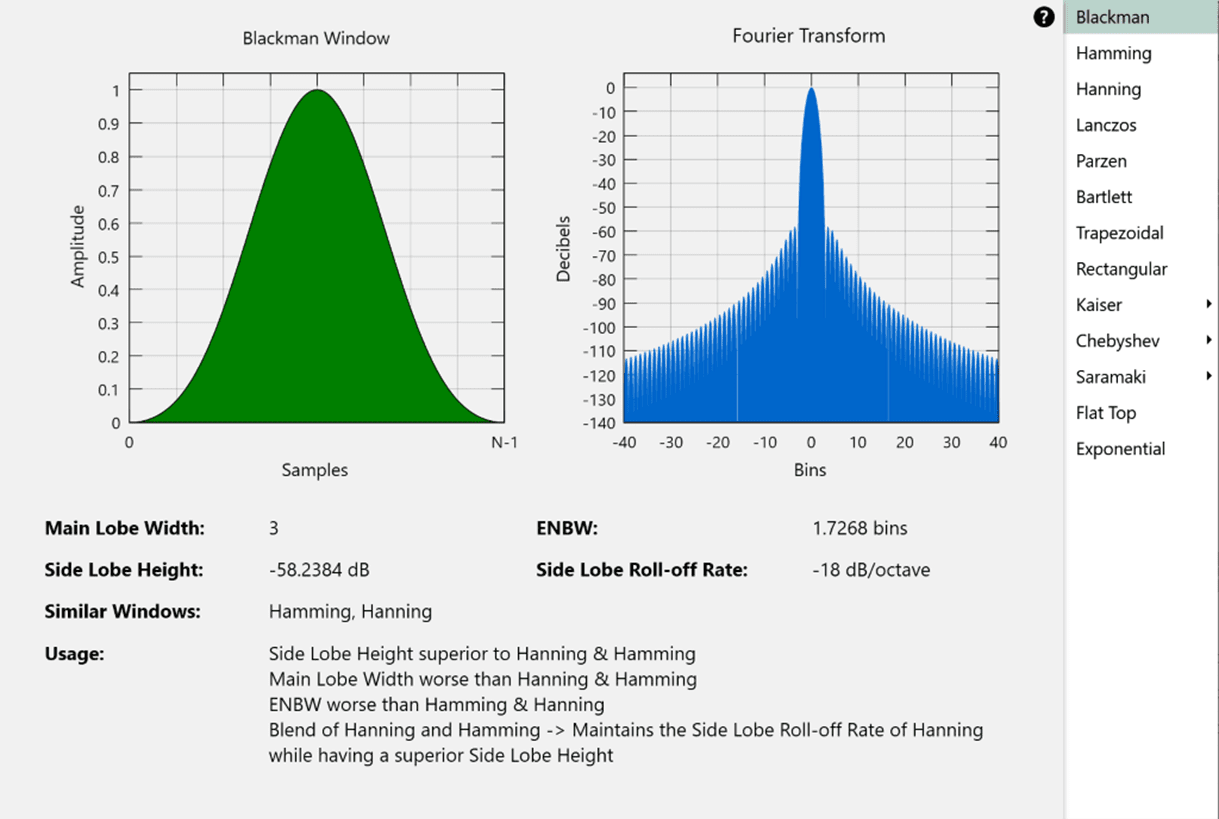
Window Function
When the overlap percentage is greater than 0%, the shape of the window function influences the size of the time step between each FFT block. Window functions pass different amounts of a signal based on their characteristics.
This explains why at a 50% overlap the time step is not exactly half the time required for one FFT block. The effect is even greater at a 75% overlap. Below is a diagram of the characteristics of the Blackman window.
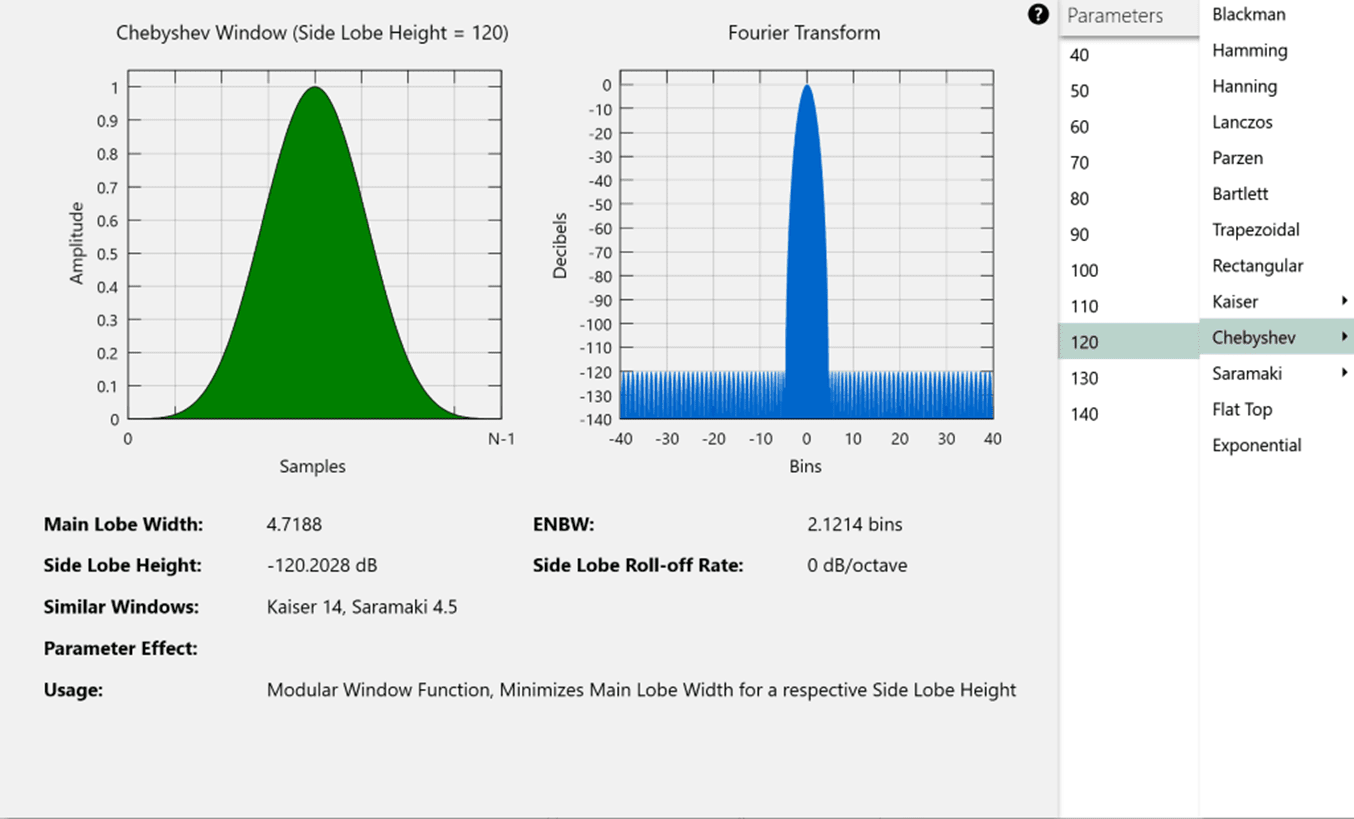
As a comparison, with a Chebychev 120 window, the amount of time required for 60 DOF at 75% overlap drops to 17.61 sec (compared to 21.30 sec).
Short Duration Test with a High DOF
If test specifications require a short duration test with a high DOF and tight frequency resolution, we recommend using Instant Degrees of Freedom® (iDOF).
Short vibration tests with a high DOF can be used to represent real-life events such as an aerospace launch. This type of test is meant to identify any potential issues without damaging the equipment. However, these vibration tests often have tight tolerances (+/- 1.5dB). The statistics of averaging the FFT power values prevent the lines from being within tolerance in a short period.
iDOF calculations are a statistically valid way to ensure smooth lines and an in-tolerance PSD in a short testing period. For more information on short-duration random vibration testing, read the paper, “Meeting the Challenge of Short Duration Random Vibration Testing.”