Abstract
The fatigue damage spectrum (FDS) measures the relative potential for stresses associated with resonant responses to cause fatigue failure. Engineers can use FDS software to statistically simulate a product’s end-use environment. This technical note answers frequently asked questions about the FDS capabilities in the VibrationVIEW and ObserVIEW programs.
What is the Purpose of the FDS Software?
 VibrationVIEW’s FDS software is a feature of random vibration control. It controls an accelerated random test profile on a shaker to replicate a product’s operational environment in a fraction of the time.
Engineers can create an accelerated random test profile in VibrationVIEW FDS or with ObserVIEW’s Random Test Generation tool. Both programs can generate a test profile that is the damage equivalent of multiple time-history waveform files, weighing the files based on their contribution to product life in a standard environment.
 ObserVIEW’s test generation options allow for further analysis of time-history files. Engineers can analyze product failure runs, compare specifications to real-world data, and determine if their current testing method is valid, over-testing, or under-testing.
Can You Combine Multiple Time-history Files?
Both software programs can generate an accelerate random test profile from multiple time-history files. These files can be weighted individually by time or cycles to achieve an accurate target life for the product.
When combining the data, the software uses the same m, Q, and frequency range to create an equal relationship between the imported files. The output PSD is the damage equivalent of the imported data based on the target life for each file and the FDS settings.
For instructions on creating an FDS test profile, see the tech note:
- How to Create a Fatigue Damage Spectrum (FDS) Test in VibrationVIEW
- Create an FDS-correlated Random Test in ObserVIEW
Does the FDS Include Resonances?
Properly recorded field data includes resonances. If the recorded file has resonances, the software will include them in the test profile.
To What Degree Can a Test be Accelerated? Is There a Recommended Ratio?
An accelerated test is not equivalent to running the test for its lifespan. Generally, the less the test is accelerated, the more accurately it reflects the real world. At a minimum, the test cannot exceed the product’s instantaneous stress limit, such as yield stress or ultimate stress (assuming the product fails due to fatigue damage). The instantaneous stress limit varies depending on product construction.
Additionally, the FDS uses the stress-strain curve to determine the acceleration, so the test acceleration is only as accurate as the m value. As the test acceleration level increases, the more important the m accuracy becomes. Some composite materials may make it difficult to estimate the m value.
According to MIL-STD-810G, test engineers should not accelerate tests by applying excessive amplitudes “simply to achieve short test durations. Such excessive amplitudes may lead to wholly unrepresentative failures and cause suppliers to design material to withstand arbitrary tests rather than the in-service conditions” (p. 237).
The military standard also defines an exaggeration factor. “It is recommended that the exaggeration factor be kept to a minimum value consistent with the constraints of in-service time and desired time, and should generally not exceed values of 1.414^(S1/S2) or 2^(W(f)1/W(f)2).” According to this statement, for material with an m value of 7.5, the maximum ratio between the in-service time and test time is 1.414^(7.5) ≈ 13.4.
ERS for Validating Test Acceleration
To help determine how much acceleration is “just right,” engineers can use the extreme response spectrum (ERS). If the accelerated test’s extreme response exceeds the ERS tolerance, then the test acceleration must be reduced. Learn more.
How Can I Create a Time-history File from a PSD?
In VibrationVIEW, the simplest method to produce a time-history file from a PSD is to use the Random Import function. Import the PSD, run the test, and record the Ch1 time waveform. You can use demonstration mode or loop the drive to Ch1 with a short BNC cable. Connection to a shaker is unnecessary because a PSD is not unique to any time waveform. The FDS is a time-based algorithm; if you run the same PSD repeatedly, you will not produce the same FDS but a good approximation.
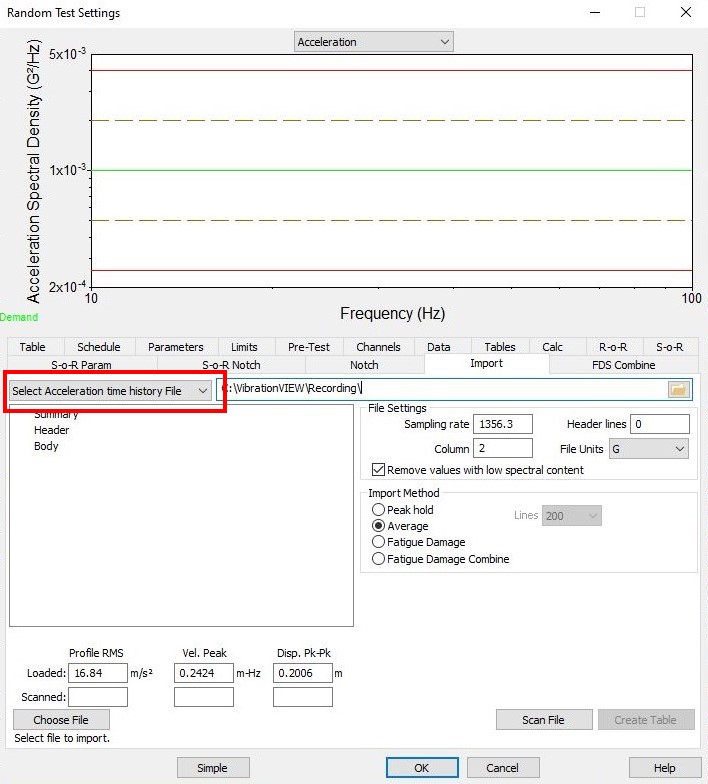
Random Import settings in VibrationVIEW.
A second option is to assume random phases using a tool like MATLAB, but the results would not be significantly different.
Is it Possible to Determine How Much Damage a PSD Causes?
Not by itself. A PSD is only associated with a time waveform. The FDS also requires the product’s material properties. You can generate an FDS with a time-history file and the product’s m and Q values.
Can the FDS Determine Which PSD Causes More Damage?
To compare two PSDs using the FDS, the m and Q value must be the same. From this perspective, the FDS is an identical transformation applied to both PSDs, and the FDS generation process does not provide any new information. The comparison would provide a direct comparison of the PSDs in the frequency domain.
An example of a useful FDS comparison uses recorded time-history data and a PSD based on a test specification. The two FDS should align closely if the standard PSD accurately reflects the combination of field environments. This comparison can validate a PSD and assure the engineer that a product is not being over-tested or under-tested.
What m and Q Values should I Use? Is it Possible to Determine a Product’s m and Q?
See the m and Q Values for FDS technical note for more information.
How Does Kurtosis Factor into PSD Import?
Measuring a time-history waveform in the field includes the measurement of kurtosis. When the FDS is calculated from the recorded time-history, an increased kurtosis will result in more damage at nearly all frequencies (if performed correctly). However, if the FDS is converted back into acceleration spectral density (ASD), the ASD will be Gaussian, where the kurtosis equals 3. The damage due to the time-history’s kurtosis is calculated into the FDS but spread throughout the ASD during PSD import.
The Kurtosion® software can output an FDS with a higher kurtosis. A higher value may be useful for lowering the GRMS requirement of the test. The GRMS will be decreased, but the peak requirement will increase. Lowering the GRMS may be beneficial when a system cannot handle the sustained load of the test but can reach higher peaks.
A higher kurtosis FDS can also create peaks equal to the input waveform. With or without added kurtosis, the output PSD from the FDS will be the damage equivalent to the combined input time-history files.
Learn More
If you still have questions after browsing these fatigue damage spectrum FAQs, please reach out to the Vibration Research support team.