A spectrogram is a graph that displays the strength of a signal over time for a given frequency range. Using a color spectrum, it points to the frequencies where the signal’s energy is highest and shows the energy variation over time.
Article Overview
- Introduction to spectrograms and their role in analyzing vibration signals
- How spectrograms are generated using the fast Fourier transform (FFT)
- Differences between spectrograms and traditional time- or frequency-domain analyses
- Practical applications for identifying transients, monitoring dynamic systems, and detecting anomalies
- Use of spectrograms in order analysis to track rotational frequencies
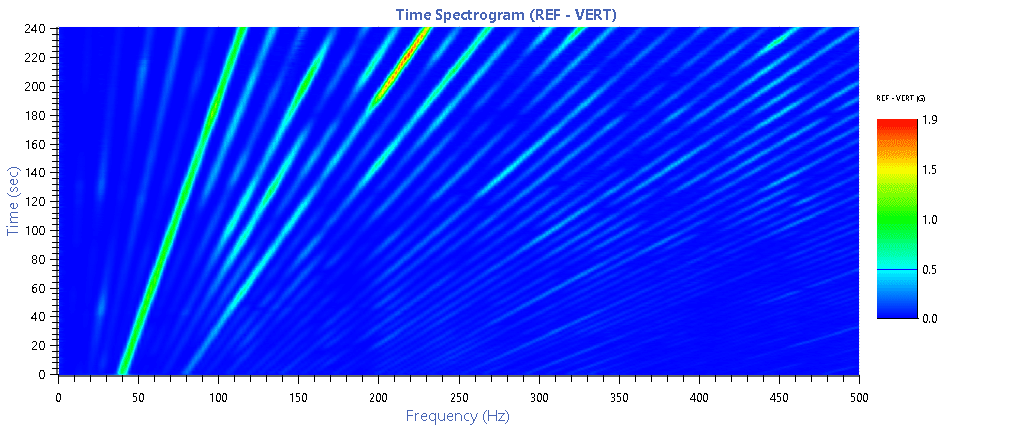
For a vibration signal, a spectrogram’s color scale identifies the frequencies of a waveform’s amplitude peaks over time. Unlike a time or frequency graph, a spectrogram correlates peak values to time and frequency. Vibration test engineers use spectrograms to analyze the frequency content of a continuous waveform, locating strong signals and determining how the vibration behavior changes over time.

A time spectrogram graph of a vibration signal.
Generating a Spectrogram
To generate a spectrogram, a signal analysis software program divides a time-domain signal into segments of equal length. Then, it applies the fast Fourier transform (FFT) to each segment, transforming the data from the time domain to the frequency domain. The spectrogram is a plot of each segment’s FFT. The Frame Count parameter determines the number of FFTs the program uses to create the spectrogram and, as a result, the amount of the overall time signal that it splits into independent FFTs.

A vertical and horizontal cross section of a time spectrogram.
For instance, it is possible to define a spectrogram that covers 10 hours with only 10 FFT frames. However, there would be many gaps between the FFT analyses. Conversely, a 1-minute spectrogram with 1,000 FFTs would cover all time samples with some overlap between the analyses.
The spectrograms below are from the same data set, but the frame count is reduced from 500 to 50. The result is a jagged spectrogram with many gaps in the data.
500 frame count

50 frame count
Comparing the Spectrogram to Other Signal Analyses
A time-domain analysis can point out a defect in a device under test (DUT) but does not specify its location or nature. As the spectrogram is a collection of time-frequency analyses, engineers can use it to identify characteristics of nonstationary or nonlinear signals, such as transient excitation, intermittent vibration, or dynamic changes in the system’s vibration patterns. A spectrogram is a helpful tool for analyzing real-world data with various frequency components and/or mechanical and electrical noise.
A spectrogram is most helpful for vibration analysis in a changing environment because it helps define the dynamic behavior of the system. It illustrates the patterns of energy change, such as varying operating conditions, load changes, or time-varying excitation that may not be visible in an FFT or PSD. A spectrogram provides more information about the time-varying nature of vibration, while frequency domain analyses provide information at a specific moment or as an average over time.
In a spectrogram, there are many indicators of damage, and they can be complex. Still, atypical bands can offer information regarding potential damage. Characteristics such as frequency shifts and changes in energy distribution can point to potential damage mechanisms.
Order Analysis and Spectrograms
Spectrograms can also help identify and analyze orders. Orders are frequency measurements (Hz) that correspond to a reference RPM and its harmonics. Order analysis is a powerful signal analysis tool for machines with rotational or reciprocating components. It helps differentiate the rotational sources of vibration from random vibration. Engineers use a spectrogram to visualize order lines, allowing them to assess the performance of rotating machinery.
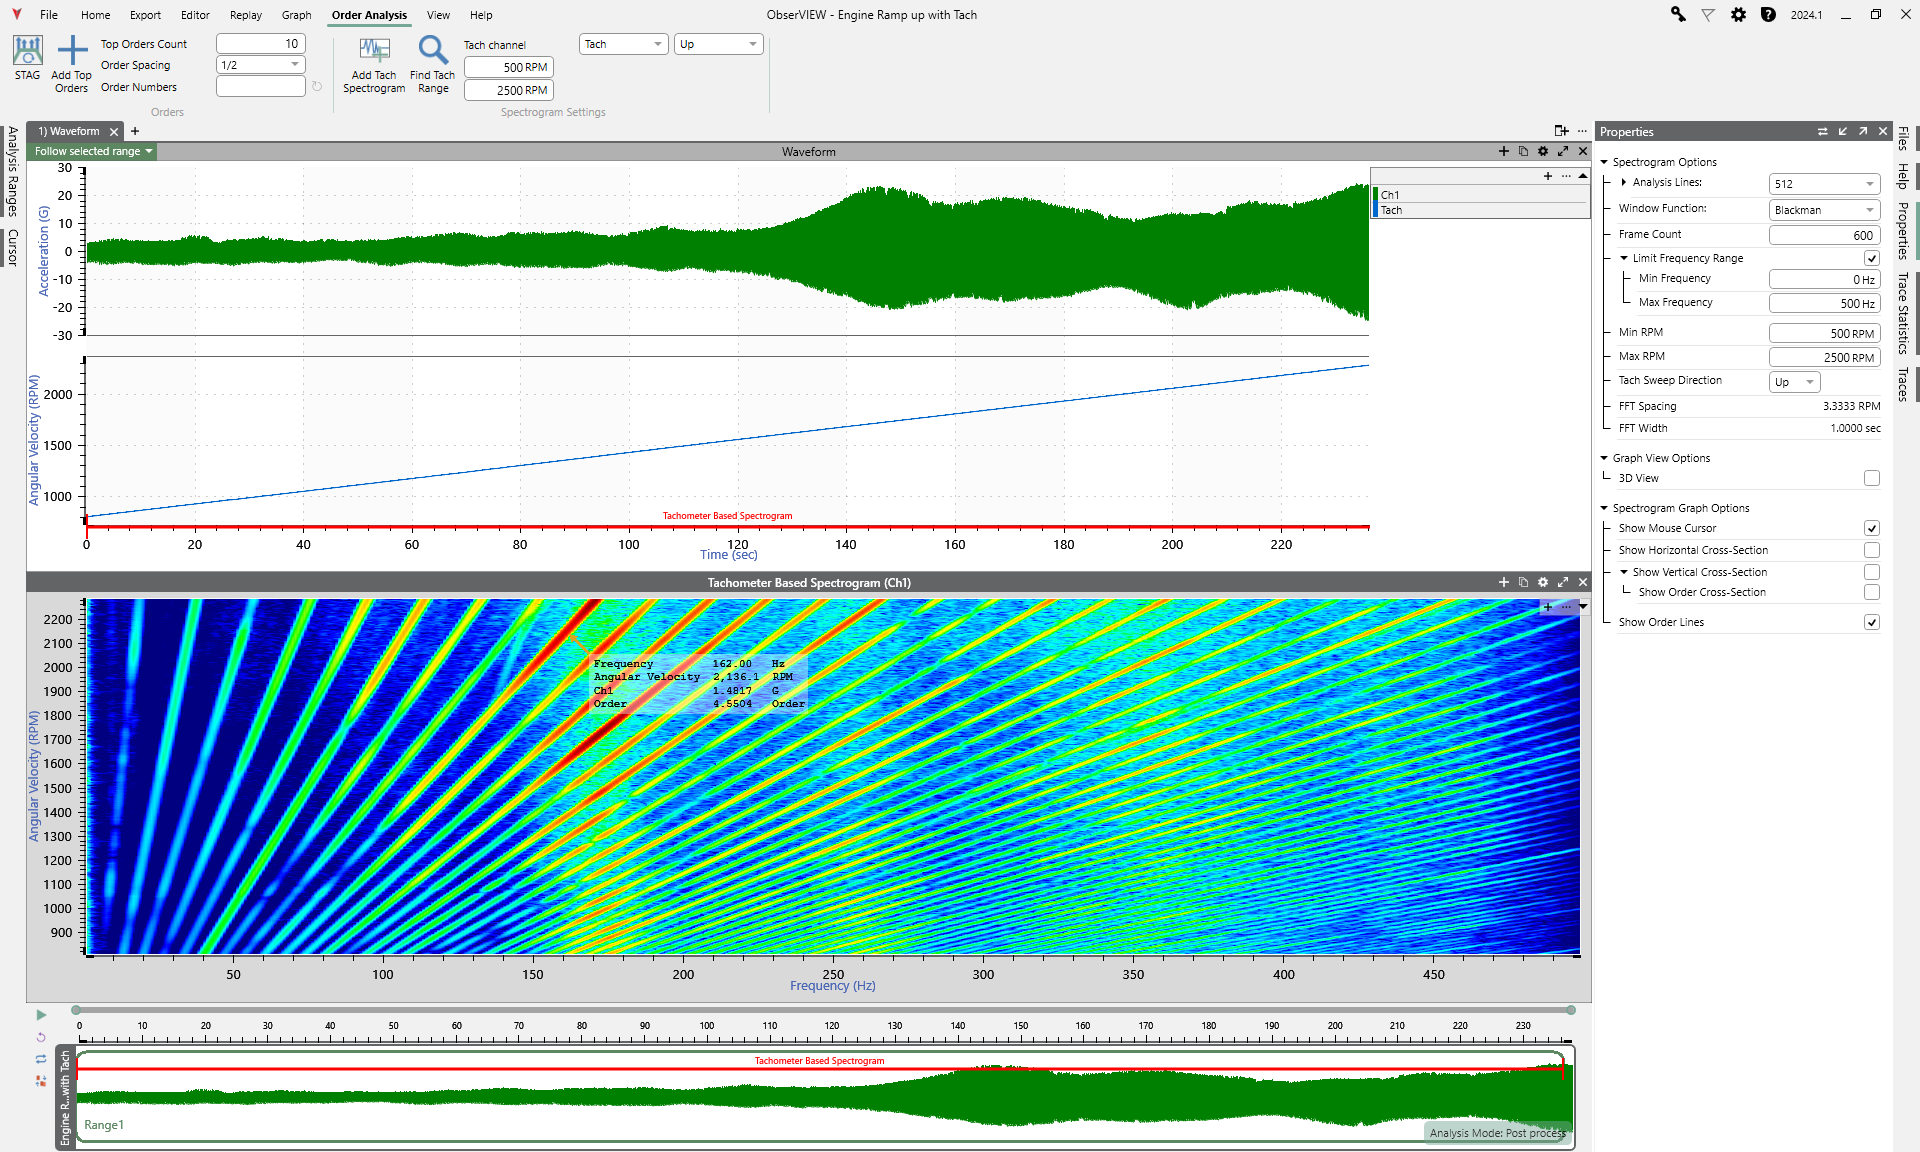
An engine ramp-up tachometer recording and corresponding tach spectrogram.
Spectrogram Analysis in ObserVIEW
The ObserVIEW analysis software has time spectrogram and tachometer spectrogram graph options. Spectrograms can be viewed as a three-dimensional plot for an interactive display.

A 3D graph of a tachometer-based spectrogram.
ObserVIEW has several graph options that are useful for analysis. These options can be found under Spectrogram Graph Options.
- The mouse cursor displays time and frequency data
- The vertical and horizontal cross-sections display a graph under the spectrogram with the data for a vertical/horizontal slice across the spectrogram. The slice can be moved by dragging the horizontal crossbar up and down on the spectrogram.
Both the horizontal and vertical cross-sections can be used to examine a slice of all data at a specific time or frequency. In addition to these options, the tach spectrogram includes the option to enable an order cross-section graph.
Conclusion
Spectrograms provide engineers with a dynamic view of vibration signals, displaying how frequency content evolves over time. Spectrograms reveal transients, resonances, and shifts in order lines that might be missed in standard analyses. Their ability to correlate frequency behavior with operational events makes them a helpful tool for diagnosing machinery, monitoring system health, and optimizing vibration testing strategies.
To learn more, visit our ObserVIEW analysis software page or download a free demo of the software.