 Modal analysis helps define a structure’s response to a vibration event. It takes the frequency response of a complex structure and derives simple shapes, or modes, that describe the structure’s output. The modes and corresponding parameters help engineers identify natural vibration frequencies and validate the structure’s design.
Experimental modal testing is a method of collecting data for modal analysis.
Why Is This Important?
Modal analysis is necessary when designing complex structures. Engineers must identify a system’s natural frequencies to make sure they do not coincide with any potential excitation frequencies. Resonance occurs when an external vibration is the same frequency as a structure’s natural vibration. If an engineer does not account for resonance, the vibration will amplify and cause structural fatigue or damage.
If an external force excites a structure’s natural frequency, the engineer can modify the structure to shift the natural frequency. They may add an element to adjust the stiffness or mass or change the material to adjust the damping. Engineers can also use modal analysis during post-production monitoring to:
- Determine if a change or shift occurred due to fatigue
- Identify other potential failure mechanisms
Modal Analysis Basics
When a structure is excited at its natural frequency, its vibration creates different shapes (Figure 1). These “mode” shapes help describe the vibration generated by the structure. Engineers derive the mode shapes and corresponding parameters from the structure’s frequency response.
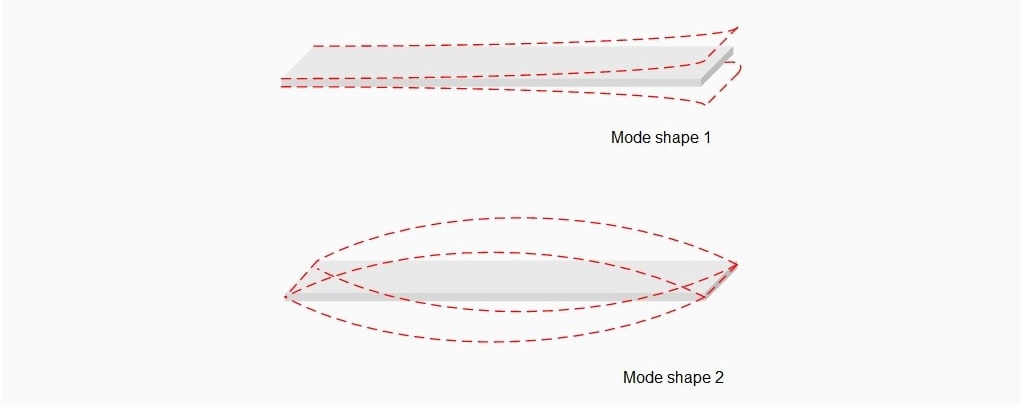
Figure 1. Example of the first two mode shapes for a basic structure.
Most complex structures are multiple degrees of freedom (MDOF) systems. They generate a combination of responses and have multiple natural frequencies that may interact. Generally, engineers can simplify their analysis by separating the structure into single-degree-of-freedom substructures. They can estimate the mode shapes and corresponding parameters of the substructures from the MDOF response to describe the complete structure.
Modal Test Setup
Modal analysis can be experimental or operational. Engineers most often use experimental analysis where they excite the structure with a mechanical device and record the response. Operational analysis is more common for long-term observation.
A modal test setup includes a device to generate the excitation, transducer(s), and data recording hardware. The structure is subject to an impact, the transducers attached to the structure record the response, and the output signal is sent to a dynamic signal analyzer such as the ObserVR1000.
Impact Hammer Tool
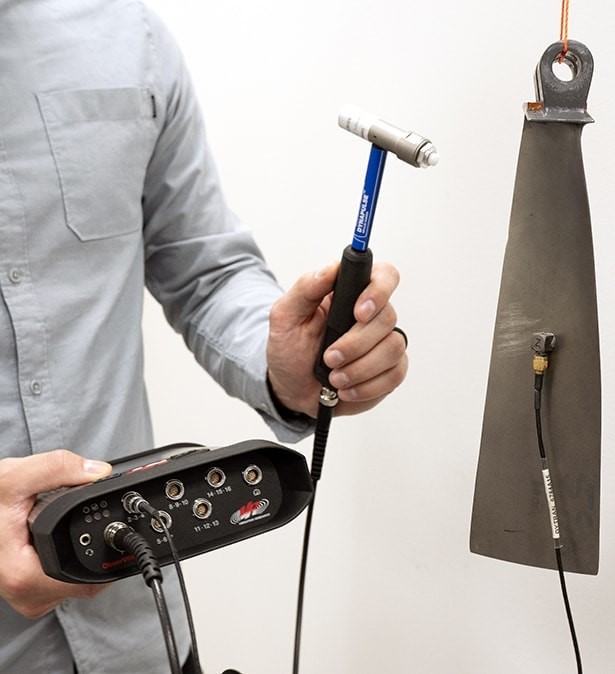
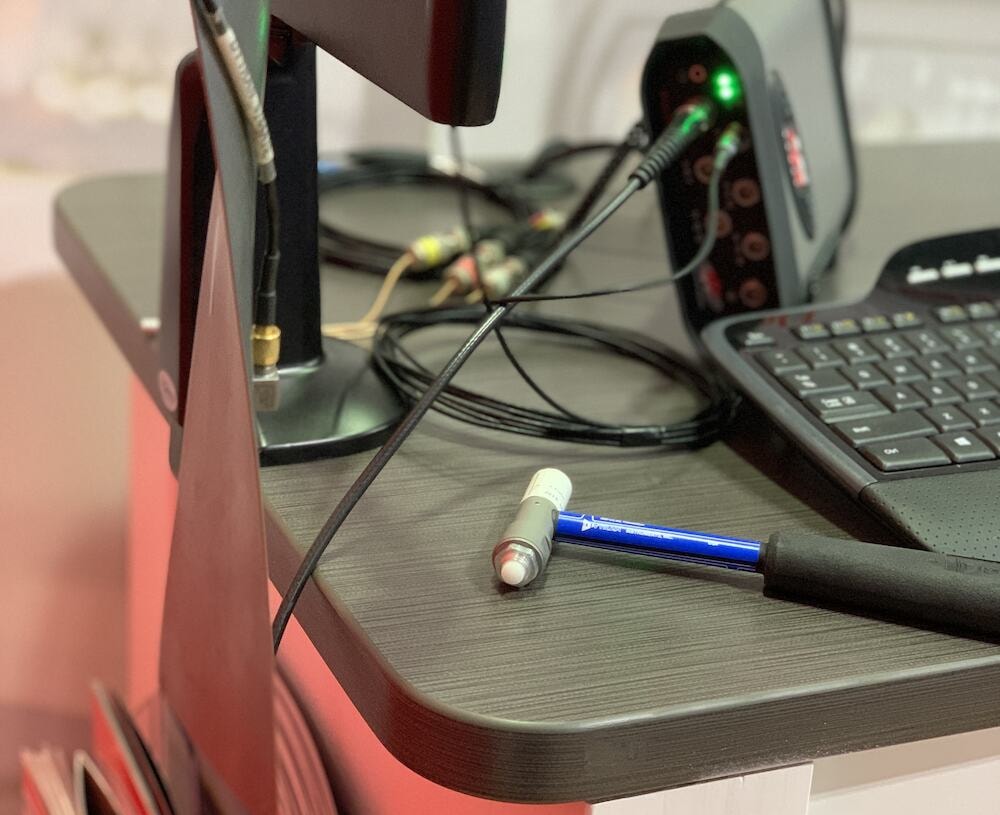
The ObserVIEW Modal Testing module is compatible with a modal impact hammer for excitation. An impact hammer is a measurement tool that produces short-duration excitation upon impact with a structure. The ObserVR1000 records the impulse via the hammer’s force sensor and the structure’s output via the response accelerometers.
The excitation setup must be correct for accurate data/results as it is used as the reference measurement for later calculations. The ideal impact is rapid so that all modes of vibration are excited with equal energy. A hammer cannot strike for an infinitely brief duration but has a known contact time. A longer contact time equates to a smaller range of bandwidth.
Most modal hammers include a variety of tips. A softer tip will result in a smaller bandwidth of frequencies excited; a harder tip will excite a wider bandwidth of frequencies. A softer tip is easier to use and therefore results in fewer double hits.
A double hit occurs when there are multiple impulses after one hit due to structure rebound. The ObserVIEW software employs automatic double-hit detection. If there is a second peak in the input that is a certain percentage of the main peak value, it is considered a double hit and rejected automatically. The user defines the percentage value per their own requirements.
Roving Method
When using an impact hammer, the user can capture data using the roving hammer or roving accelerometer method. In modal testing, the term “roving” refers to the device being moved during the test. With the roving hammer method, the accelerometer stays in place and the hammer impacts the structure at different points. Alternatively, with the roving accelerometer method, the accelerometer is moved to different points and the hammer impacts the structure at the same location.
The Modal Testing software includes an advanced project type that allows the user to define the number of response and reference locations and select different response locations/directions for each reference. Essentially, it allows them to combine the roving hammer and roving accelerometer methods in one project. The user can collect fewer responses and generate mode shapes quicker with the ease of roving the hammer.
Shaker-driven Modal Analysis
Engineers can generate modal excitation with a shaker. There are two methods of doing so with an ObserVIEW system:
- Create an open-loop output from the ObserVR1000 to the amplifier
- Use a separate controller with sensors connected to Live Analyzer inputs
The engineer must define the modal location and axes in the input configuration and create the appropriate analysis graphs: transfer function with phase and coherence. As the test runs, the data will be captured in Live Analyzer.
The traces can be exported as a UFF. This export will include the transfer function data, sensor locations, and axis descriptions for use with modal simulation software.
For more information about a shaker modal setup, please contact support or your VR sales representative.
DOF in Modal Testing
During experimental modal analysis, a structure is excited at pre-determined points called degrees-of-freedom (DOF). It is important to note that the use of DOF in modal testing is not the same as DOF in other vibration analysis processes such as the power spectral density. In modal testing, the DOF value indicates a contact point on the structure in reference to the transducer.
Figure 2 displays a basic structure labeled with contact points 1 through 9, where the transducer is positioned on the value of 5. The DOF is defined by two points: the contact point and the location of the transducer (1:5, 2:5, 3:5, etc.).
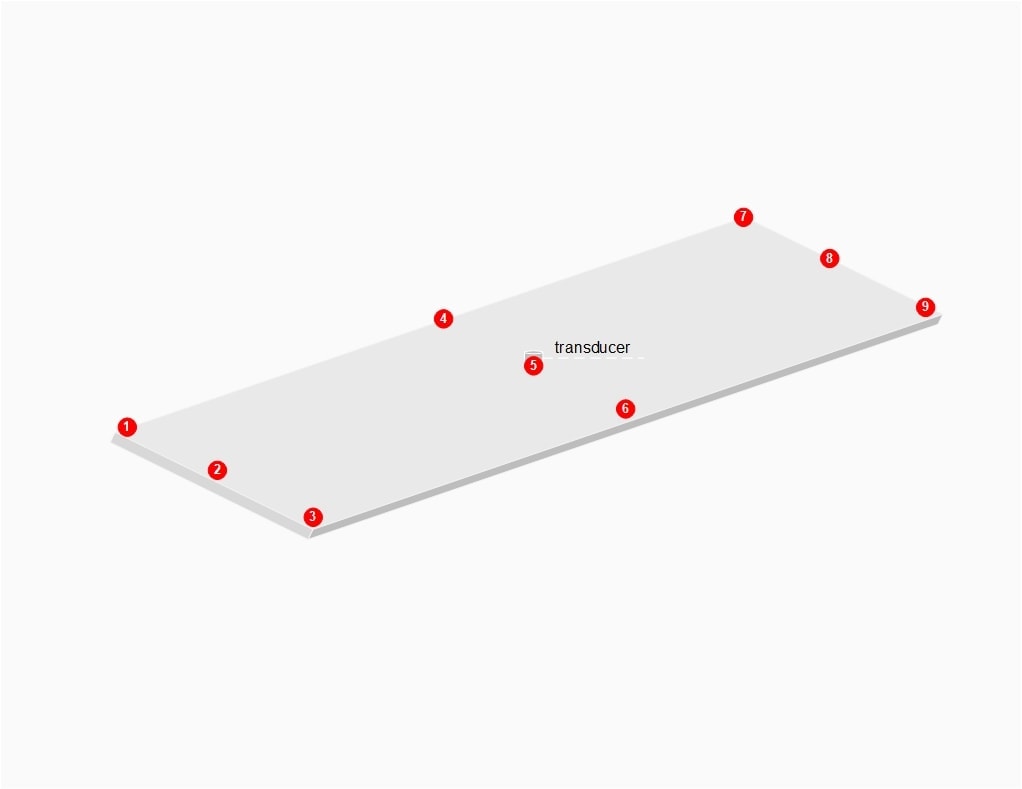
Figure 2. A basic structure with nine modal degrees of freedom.
The impact hammer is used to strike each DOF location a defined number of times. The software accepts or rejects each hit until the pre-determined number of hits is reached. Then, the software averages the response for each DOF to generate the individual frequency response functions.
Adjusting the Response
The response signal is displayed in an exponential window. If the signal has low damping, it will fade out slowly and can introduce noise at low amplitudes as a result. In the force-exponential window, the length of the response can be adjusted to reduce potential noise after the impact. To do so, the noise level is defined to determine the window length. Defining the response length also reduces measurement time.
Frequency Response Function (FRF)
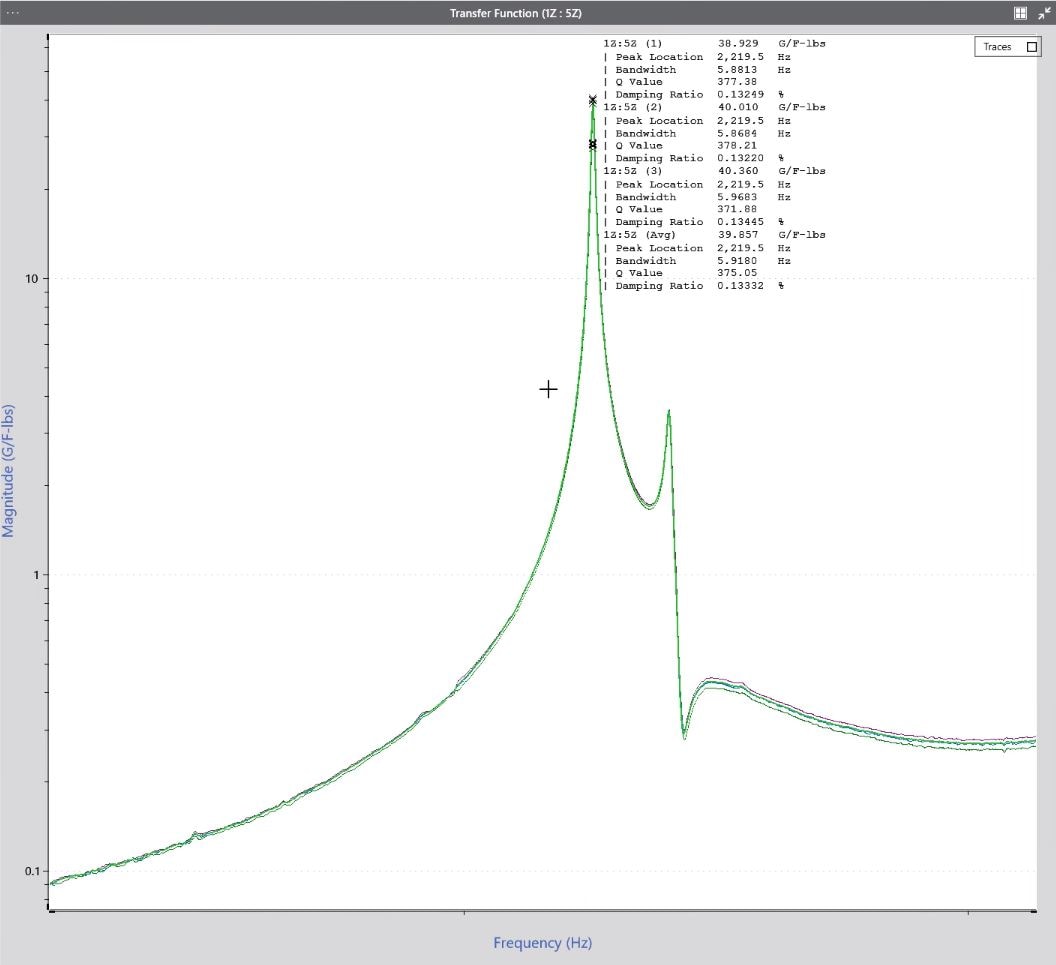
Following modal testing, engineers analyze the data to identify the structure’s mode shapes, natural frequencies, and damping coefficients. Often, this process involves generating a frequency response function (FRF). The FRF is a transfer function that describes the structure’s response to applied force as a function of frequency (Figure 3).
For a linear and time-invariant system, a transfer function defines some ratio of the input force and output response over a set frequency range. The output response can be in acceleration, displacement, or velocity units and act as the numerator or denominator, depending on what the engineer wants to calculate. FRFs are complex transfer functions with real and imaginary parts, which can be represented by the structure’s magnitude and phase response.
FRFs are a function of frequency, and software programs often use the fast Fourier transform to move the time data to the frequency domain. When engineers parse a structure into a set of SDOF substructures, they can determine the FRF for each DOF system and then combine them to form the overall FRF.
Engineers use the FRF to identify the frequencies most sensitive to excitation. These dominant frequencies are the basis of the structure’s individual modes. The parameters for each mode—shape, natural frequency, and damping ratio—can be determined by applying a curve fit to the FRF measurements. The algorithm to do so is dependent upon the testing situation.
FRF Validation
Engineers can use the coherence plot to validate the transfer function. Coherence functions as a measure of confidence that a peak observed in a transfer function is a resonant frequency of the device under test and not a spike due to measurement noise.
Learn more about coherence mathematics.
Modal Testing in ObserVIEW
The ObserVIEW Modal Testing software collects a set number of responses from each DOF. It calculates the average response at each DOF to generate a smooth transfer function (FRF). Engineers can export the collection of FRFs to a modal analysis software such as MEscope. ObserVIEW exports organized FRF data to a UFF file or another modal data format.
With Modal Testing in ObserVIEW, the user can:
- Manage table of hits per location and review hits
- Average multiple data recordings
- Calculate decay rate from transient ring-down events
- Manage the recording channel using a large, interactive display
- View transfer function as a Nyquist plot
- And more
To learn more about the features of Modal Testing in ObserVIEW, please visit the software page.
Last updated: June 10, 2025.

