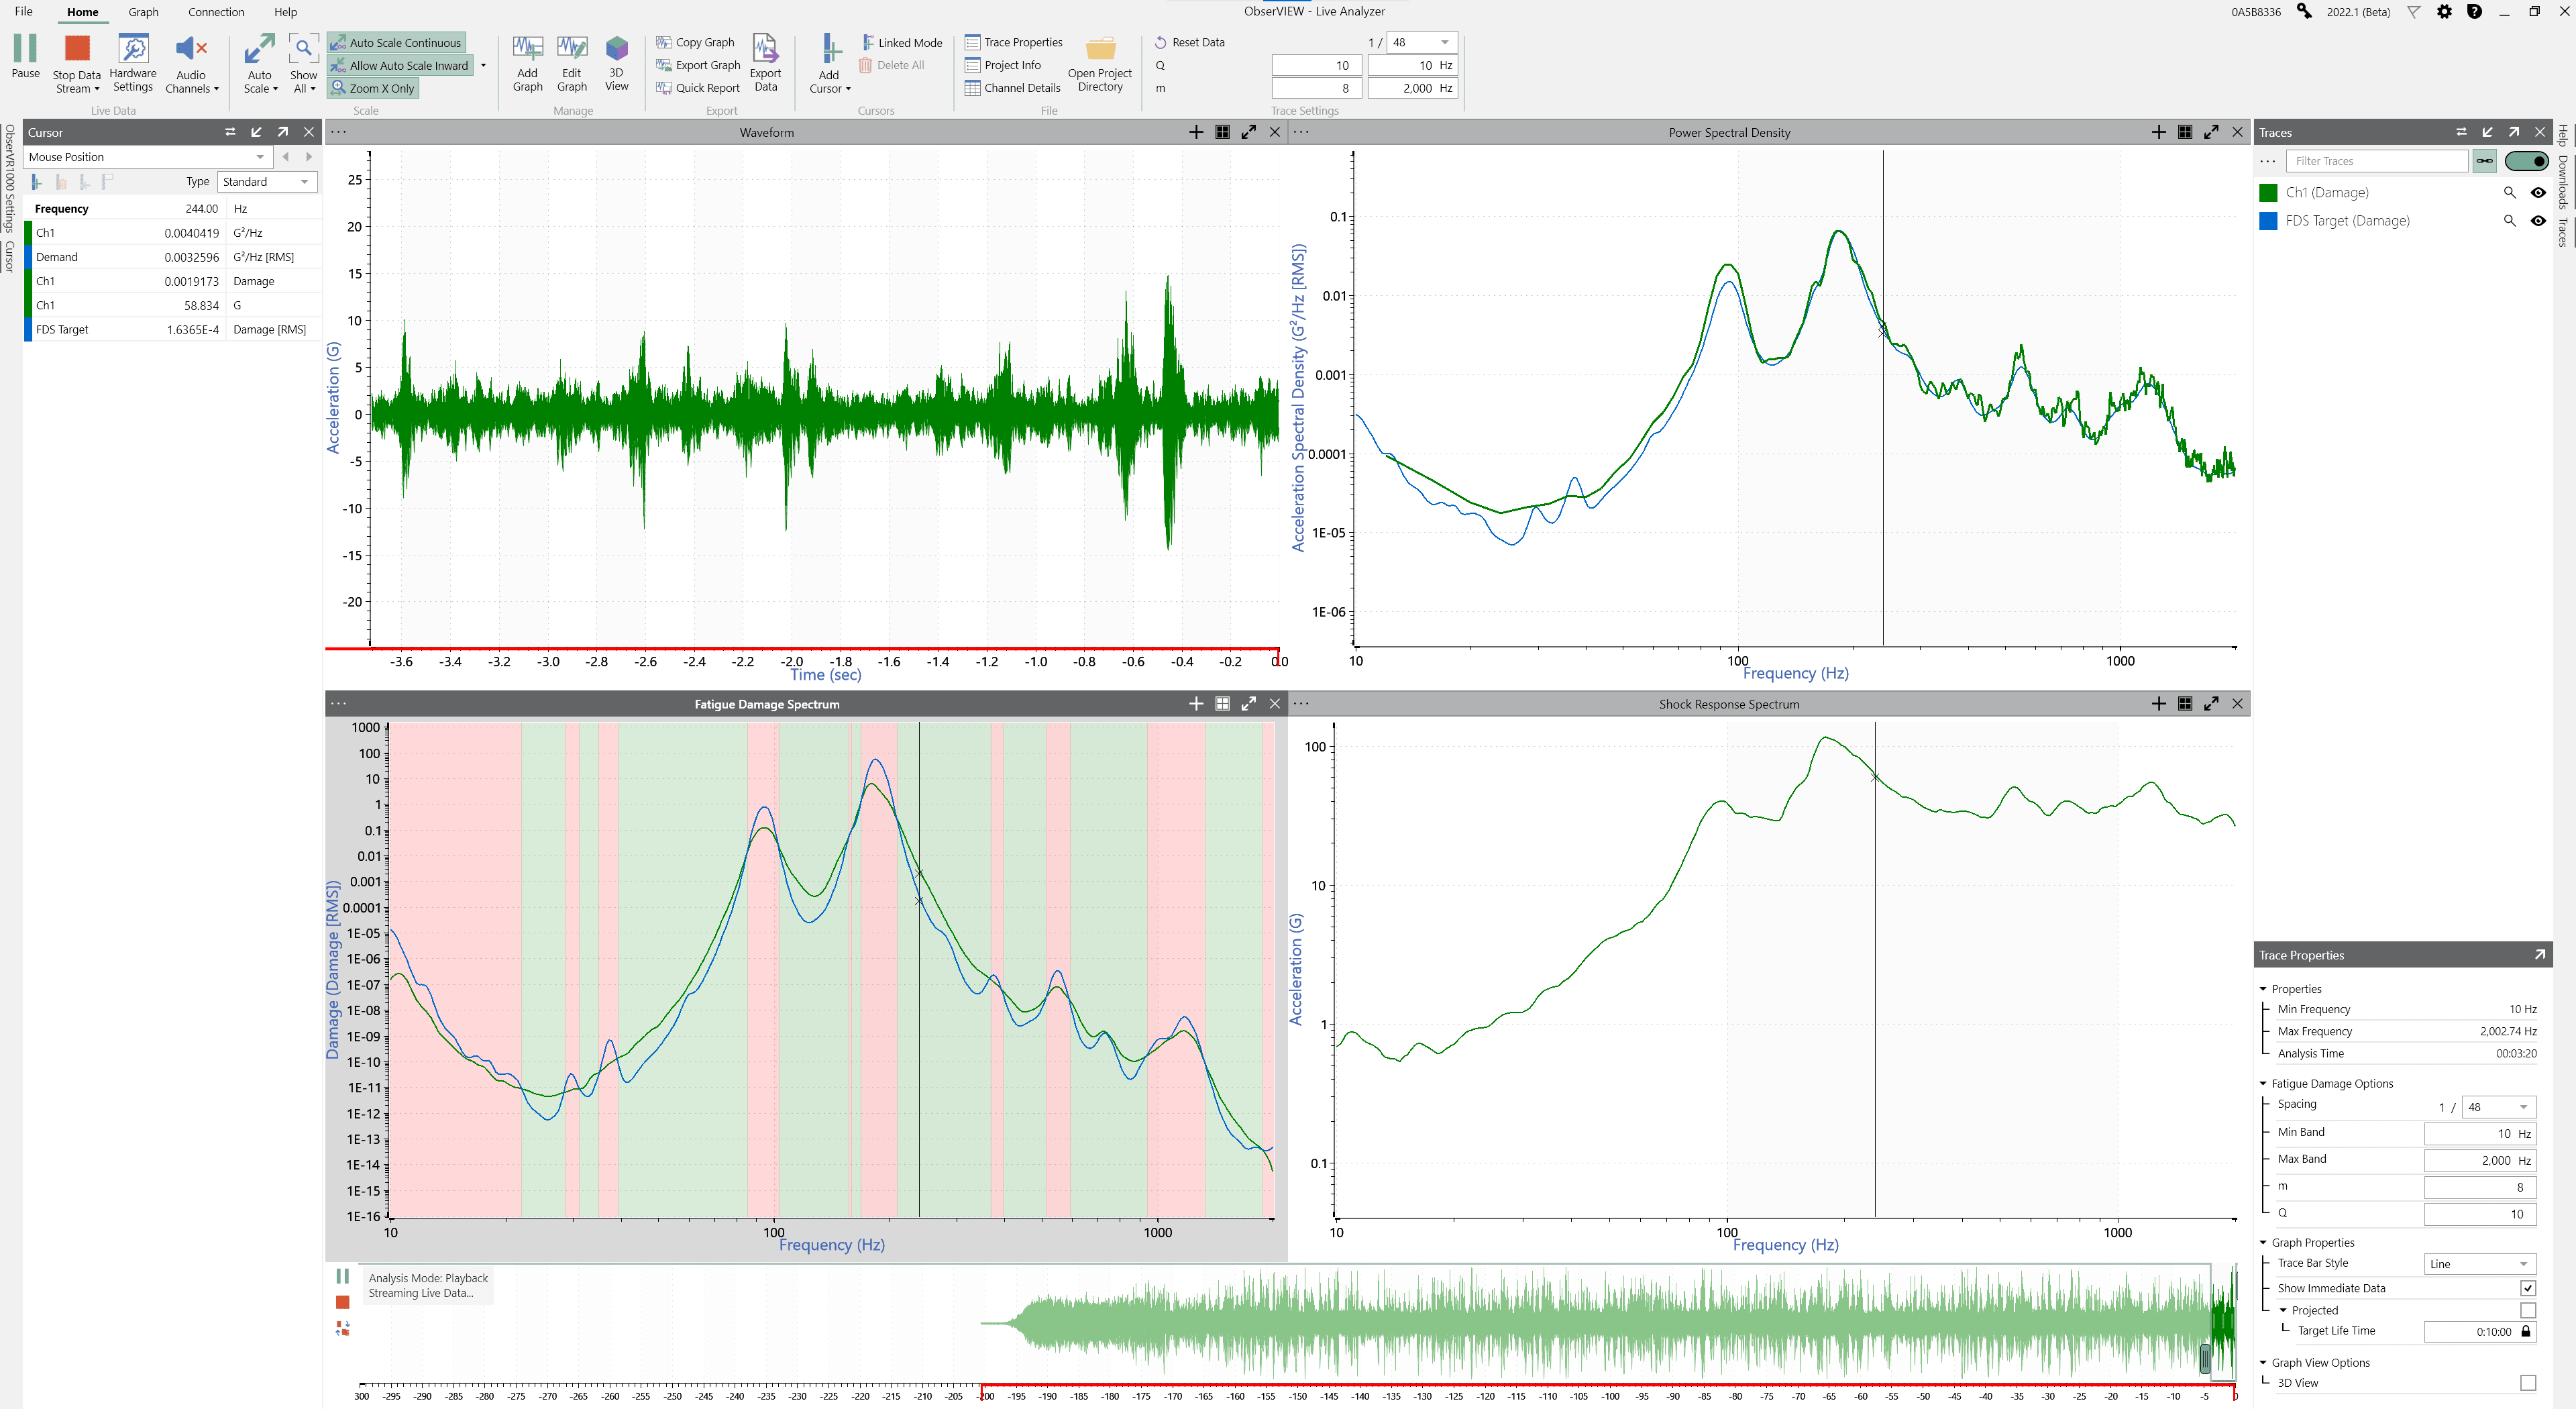
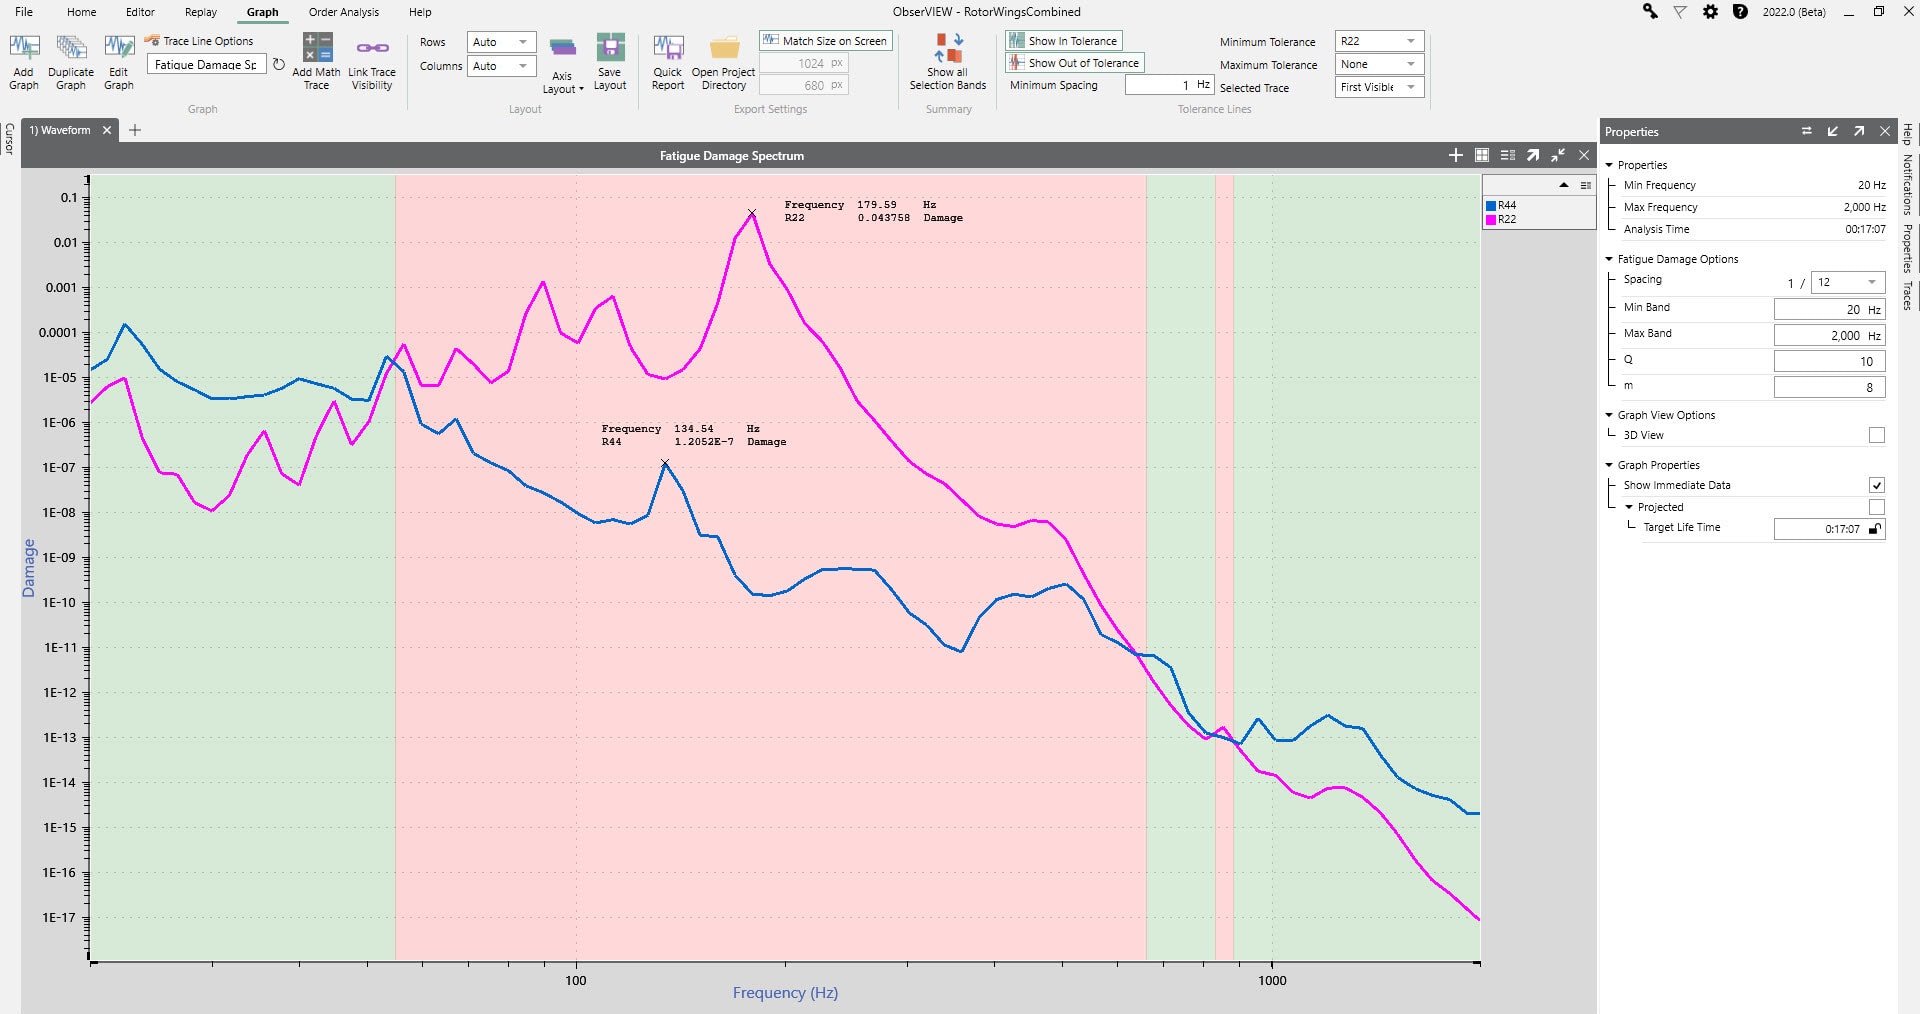
Fatigue Damage Spectrum (FDS)
Test Profile Development and Real-time Fatigue Measurement
In Live Analyzer or post-process, assess a product’s relative fatigue damage and perform a real-time measurement to indicate when a test achieves desired levels. Advanced tools allow you to generate a random test (PSD) with recorded data or projected fatigue damage.
- Analyze fatigue damage of a test profile and compare it to a reference
- Generate a fatigue damage spectrum (FDS) from a time waveform
- Generate an accelerated FDS test spectrum
- Generate a random PSD test profile using projected fatigue damage
Convert Time Data to Velocity and Displacement
Perform a unit conversion from acceleration to velocity or displacement on time, FFT, PSD, and STAG graphs.
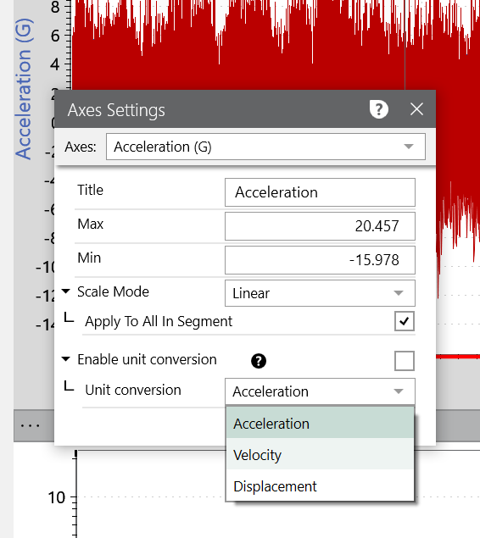 Automatically performs integration/differentiation
- Allows for a user-specified integration corner frequency
- Includes the option to add a low pass or high pass filter after conversion
- Takes seconds to process gigabyte-sized recordings
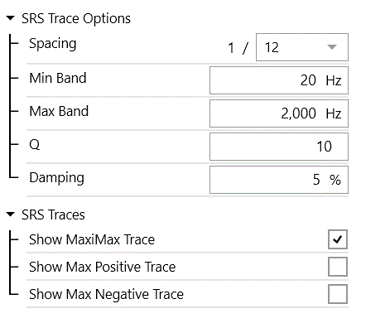
Shock Response Spectrum (SRS)
Add an SRS trace to a graph to analyze complex transient shocks. The SRS can be copied over to VibrationVIEW to generate an SRS shaker test profile.
Overlay Recordings
New updates make it easier to overlay recordings, so they start and finish at relatively the same time. Now, you can automatically overlay recordings within the software. Version 2022.1 uses a command-line GUI tool to do so.
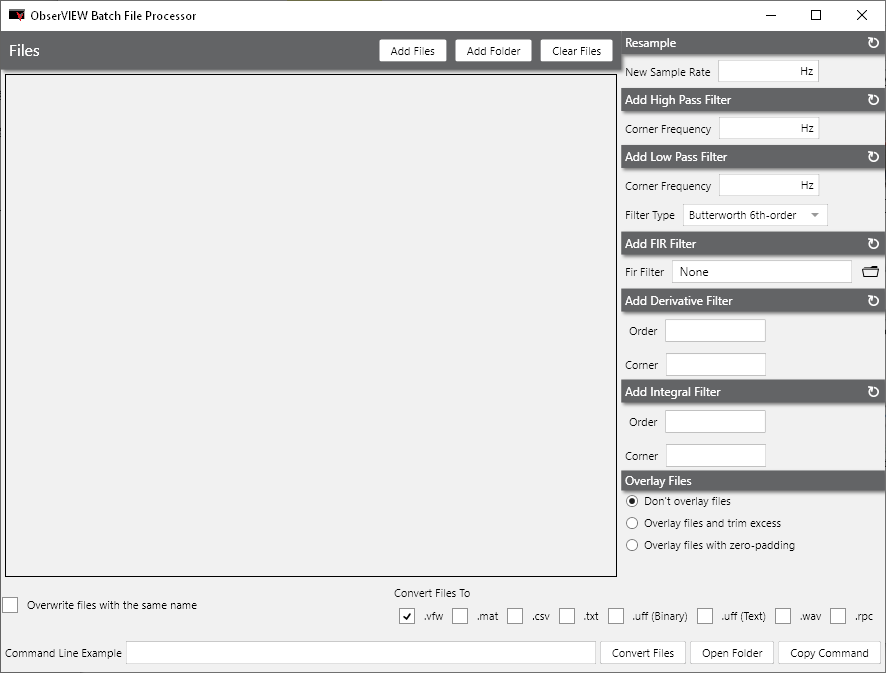
Batch File Processor Interface
Explore ObserVIEW’s command-line capabilities through a new user interface. Modify multiple files with filtering or resampling, select the conversion file type, and more.
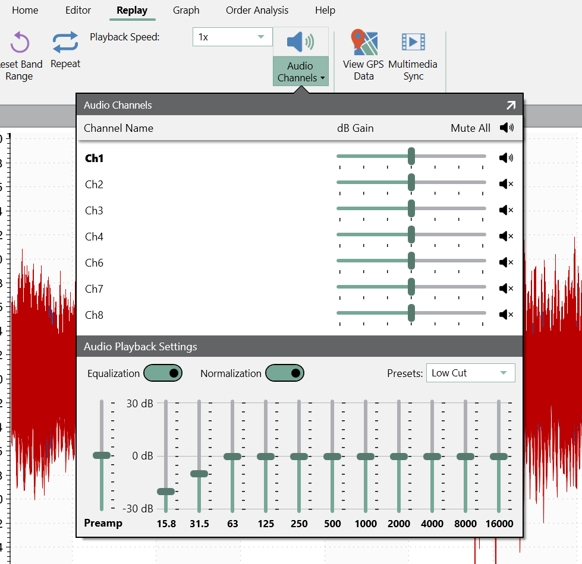
Audio Channels
Data in ObserVIEW can be played back as audibly from the computer speakers as an additional tool for analysis. It also works with a Live Analyzer connection. The sound of vibration data can help engineers validate a test profile or identify significant events.
Tolerance Line
Compare trace(s) to a tolerance line to determine when a recording exceeds its levels. The software uses a red/green color indicator for easy identification.
Technology Previews
Test out features in development before the next release.
3D Graph Options: Waterfall, Line Style, Color Styles
ObserVIEW version 2022.1 and later includes a three-dimensional (3D) view of all graph types. New line styles for 3D spectrogram plots include waterfall, lines, wireframe, and dots.
Math Traces
In ObserVIEW, you can now create a math trace to display the result of a math function. The math function is a free entry field that builds a trace using existing trace data operated on by functions and operators.
Additional Previews
- Linear average of overlapped FFTs over the desired time range
- In-place high/low-pass time filtering
Start using ObserVIEW 2022
VR users with a valid Upgrades and Support Agreement can upgrade to the latest version for free. Anyone can download a free demo version.