University and vocational students nationwide are partnering to take on the three-year Battery Workforce Challenge collegiate competition. Sponsored by the U.S. Department of Energy, this challenge gives students the opportunity to gain hands-on experience in battery design outside of the traditional engineering curriculum. Vibration Research is committed to supporting the next generation of engineers by providing participants with testing solutions that ensure battery durability and safety in real-world conditions.
The following is the culmination of the students’ first year of work, which is provided here for educational purposes only.
Vibration Test Setup
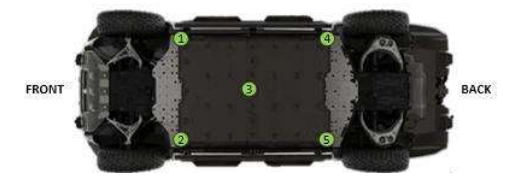
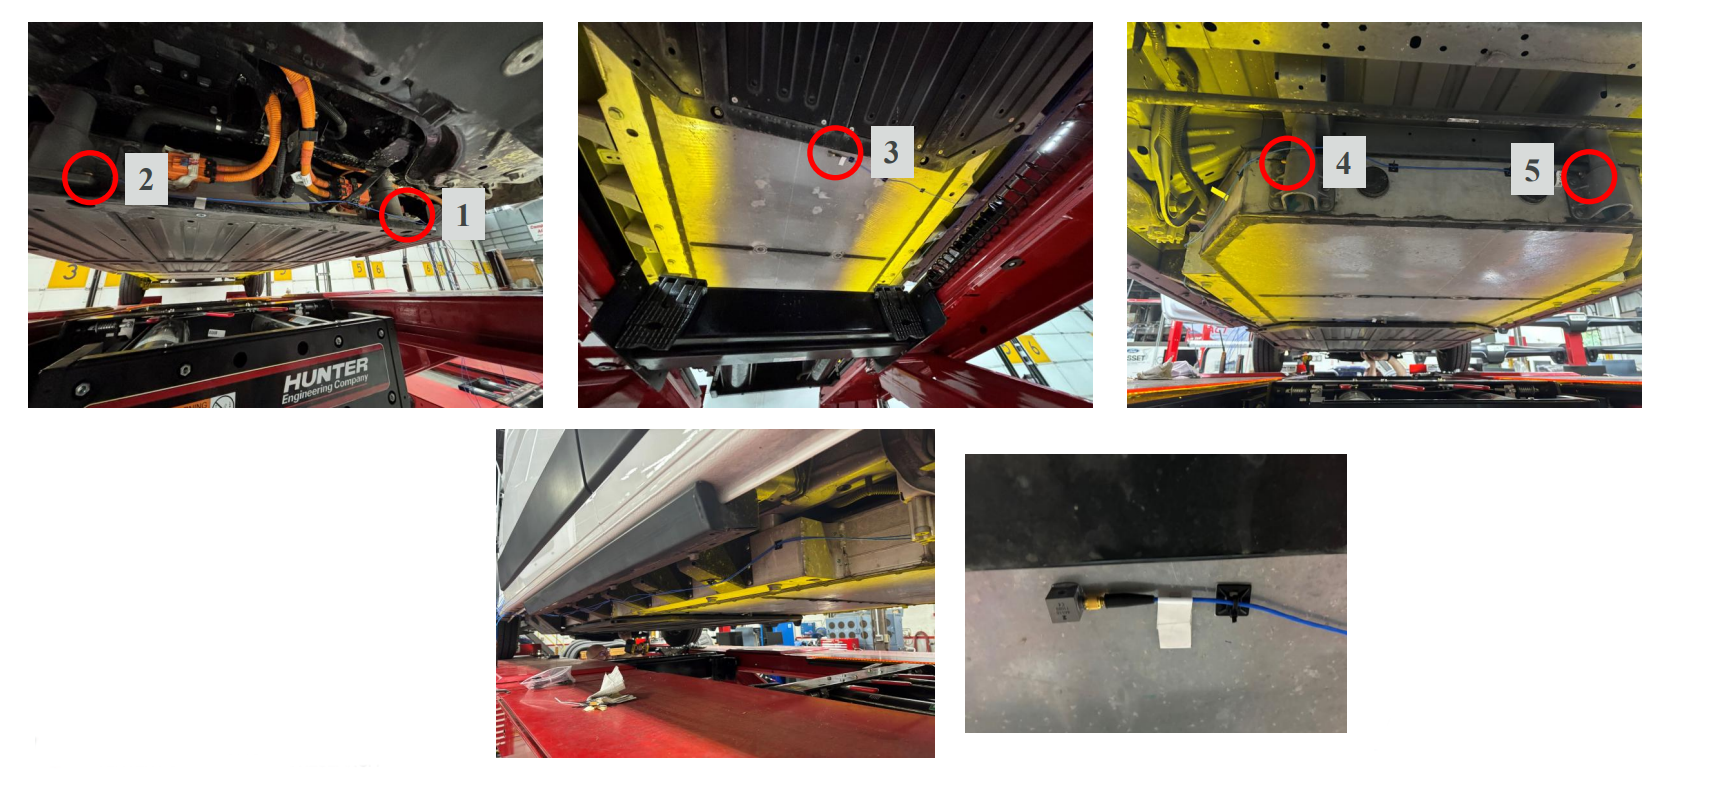
• Shown below is the accelerometer positioning on the vehicle
• Accelerometers 1, 2, 4, 5 are placed on the bolt connections from the pack to the vehicle frame in the same order/side of vehicle as the image below. 3 is placed on the center of the pack.
• Accelerometers were attached using Loctite 401 Glue
Underbody Car Images
Drive Plan
Our team was able to visit the Transportation Research Center (TRC) to conduct our vibration research. TRC Ohio is the most comprehensive independent vehicle testing facility and proving grounds in the United States.
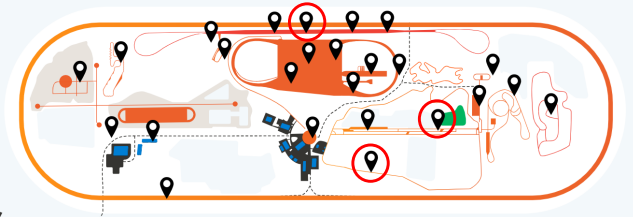
Our team spoke with test engineers from TRC and chose three of their facilities to use for our vibration testing. These facilities were chosen due to their unique and aggressive vibration characteristics when it comes to testing vehicle durability.
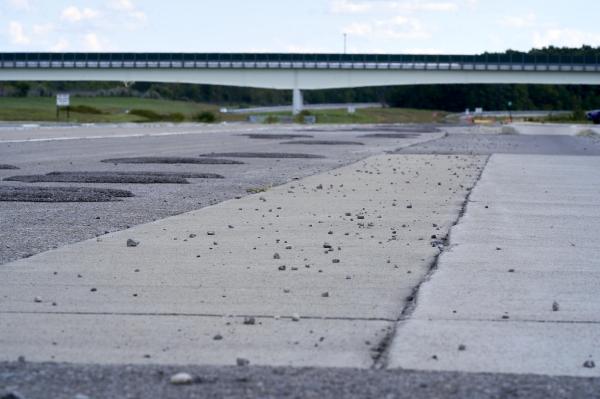
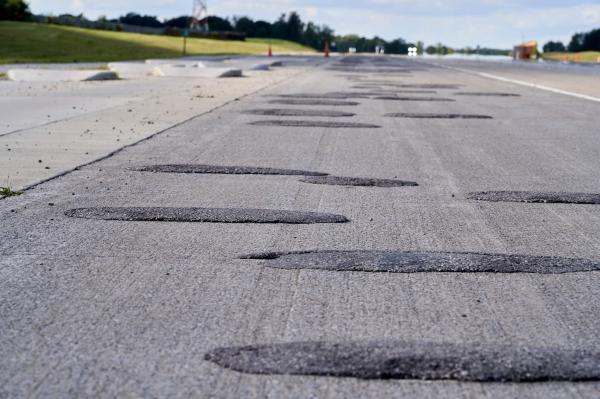
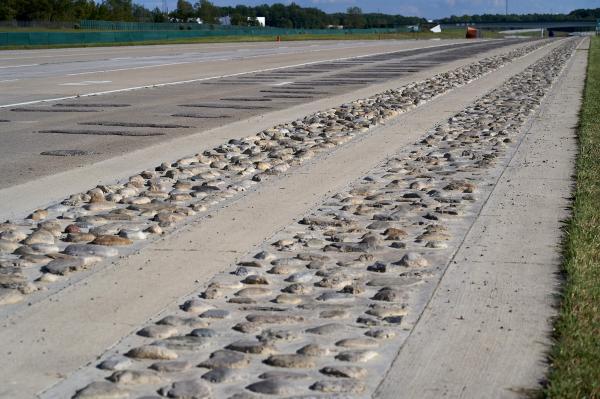
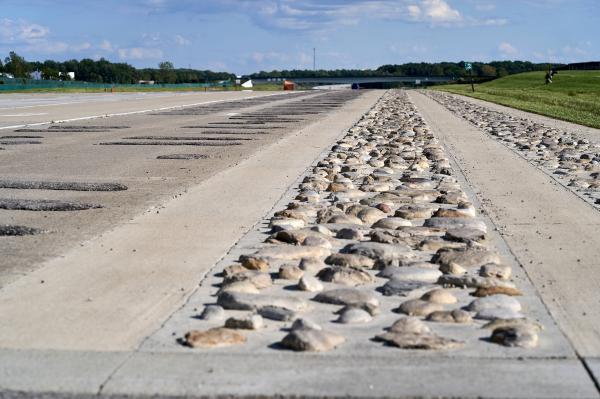
The skid pad courses were designed to replicate some of the harshest real road conditions a vehicle could experience during everyday driving. We decided to do the most amount of runs here to simulate the worst-case scenario of a vibration the vehicle battery pack could experience.
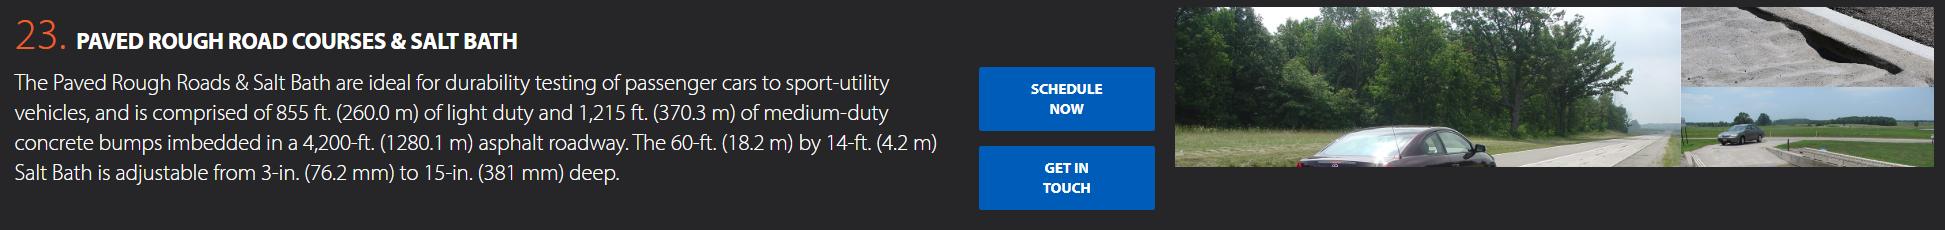
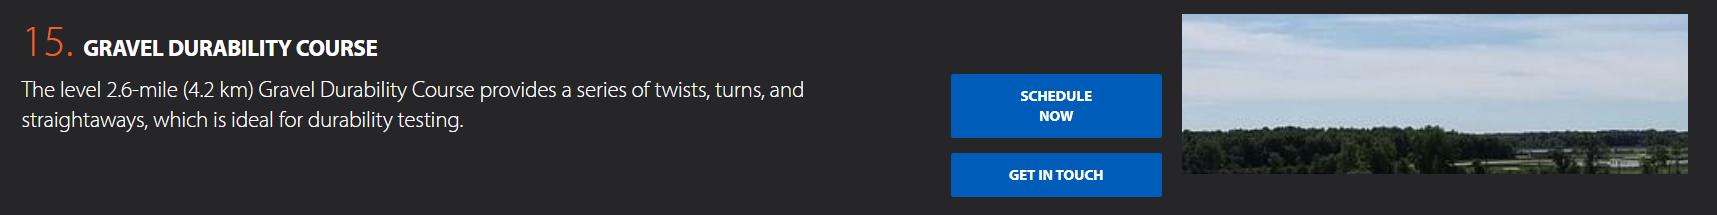
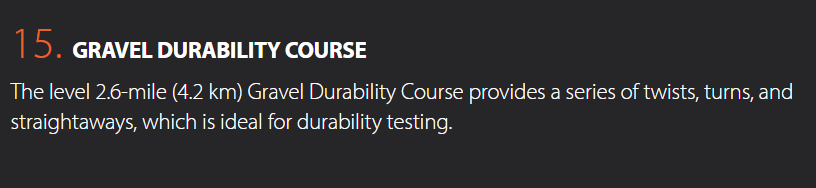
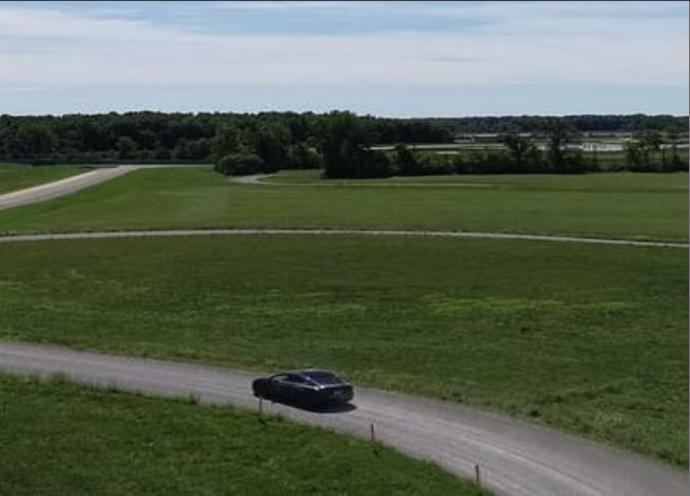
The gravel durability course and paved rough road are designed to emulate real roads in different environments. We chose to do a few runs on each of these courses, and recorded data during the runs that were most consistent with the driving conditions being replicated.
Drive Plan/Test Standard
After speaking to the TRC test engineers, they recommended doing 4 runs on the skid pad; two on the cobblestone lane, and two on the bump course. They also recommended doing two runs on both the gravel durability course and the paved rough road. They are familiar with the SAE J2380 PSD profile and they advised us that these are the optimal routes to create an equivalent profile to the SAE J2380 PSD profile.
| TRC Facility | Number of Runs | Speeds Achieved | Sampling Rate *Recommended by Vibration Research directly |
| Skid Pad Durability Course | 4 | 5-10 MPH | 65,536 Hz |
| Gravel Durability Course | 2 | 15-35 MPH | 65,536 Hz |
| Paved Rough Road | 2 | 5-10 MPH | 65,536 Hz |
To recreate the team’s test plan, you would need to follow these drive cycles exactly:
Skid Pad Runs
Run 1
• Cobblestone Lane – 5mph
• Smooth – 10 mph
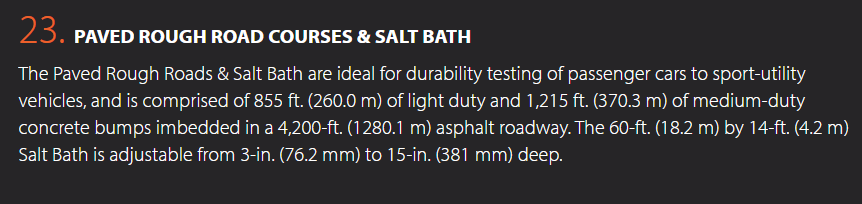
• Sinusoidal bumps (angle) – 5mph
• Big bump – 5mph
• Sinusoidal (straight) – 5mph
• Frame twister – 5mph
• Back down skid pad – 40mph
• Loop around – 35mph
Run 2
• Cobblestone Lane – 10mph
• Smooth – 20mph
• Sinusoidal (angle) – 10mph
• Big Bumps – 10mph
• Sinusoidal (straight) – 10mph
• Frame twister – 7mph
• Back down skid pad – 50mph
• Loop around – 35mph
Run 3
• Lane 1 Bump Course – 10mph
• Back down skid pad – 50mph
• Loop around – 35mph
Run 4
• Lane 1 Bump Course – 5mph
• Back down skid pad – 50mph
• Loop around – 35mph
To recreate the team’s test plan, you would need to follow these drive cycles exactly:
Gravel Durability Runs
Run 1
Full lap around gravel road 1 – 15mph base speed / 25mph top speed
Run 2
Full lap around gravel road 1 – 20mph base speed / 35mph top speed
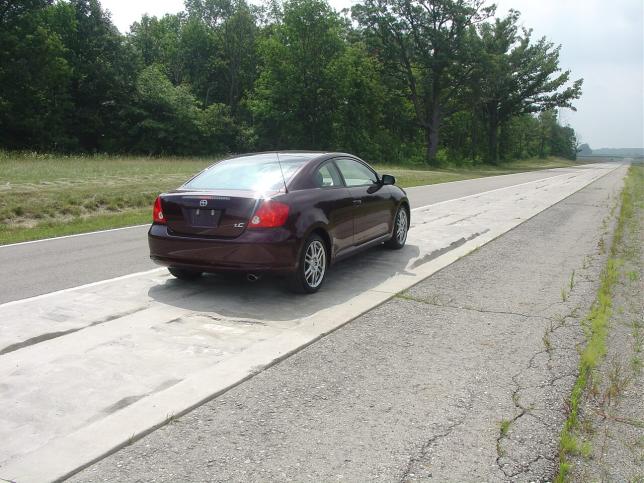
Paved Rough Road Runs
Run 1
Full lap down paved rough road lane 1 – 5 mph speed
Run 2
Full lap down paved rough road lane 1 – 10 mph speed
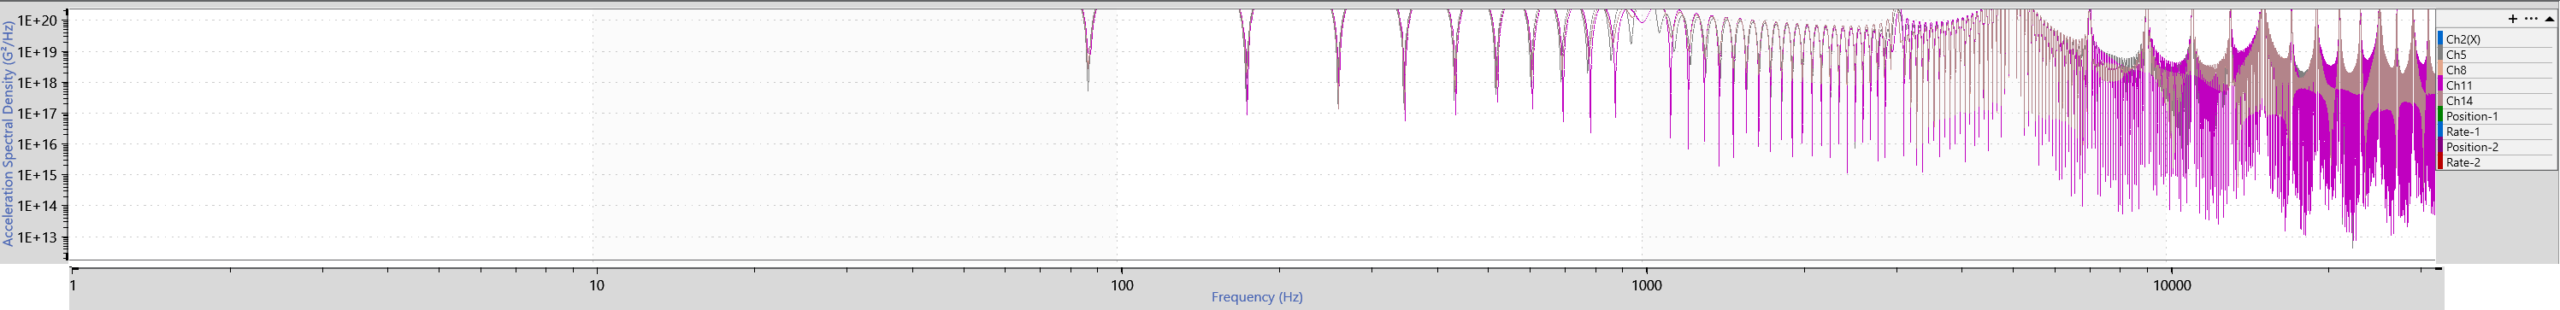
Team Profile – Skid Pad Run (Cobble)
X
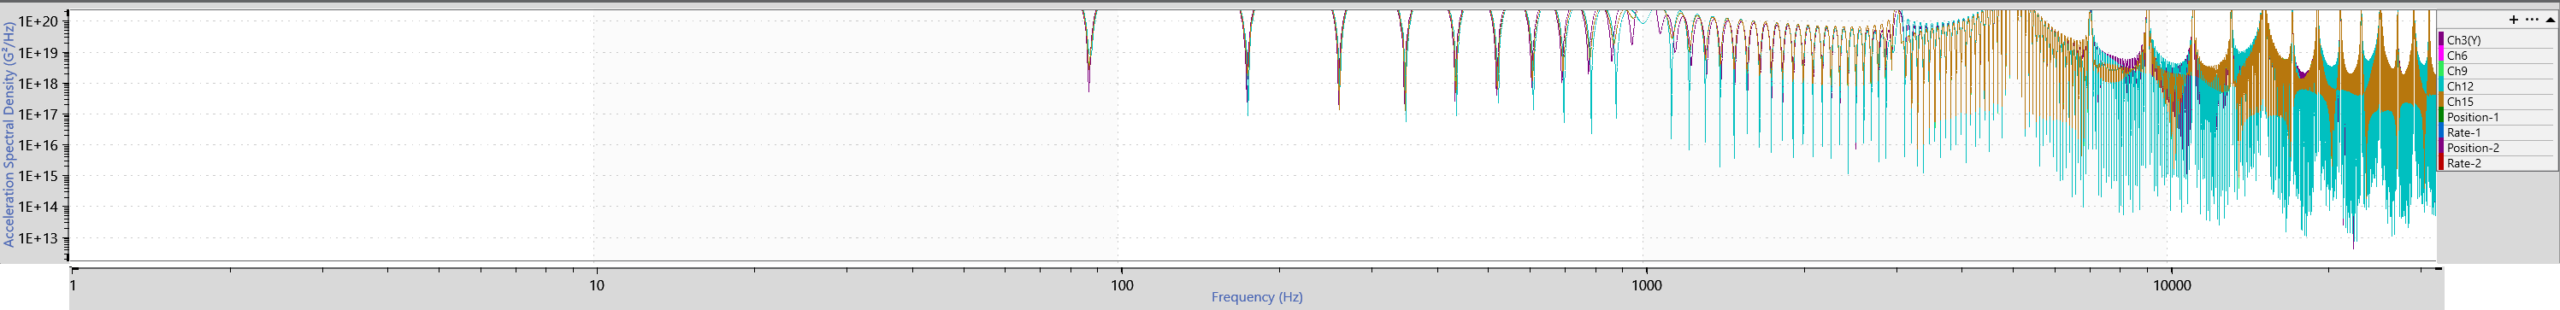
Y
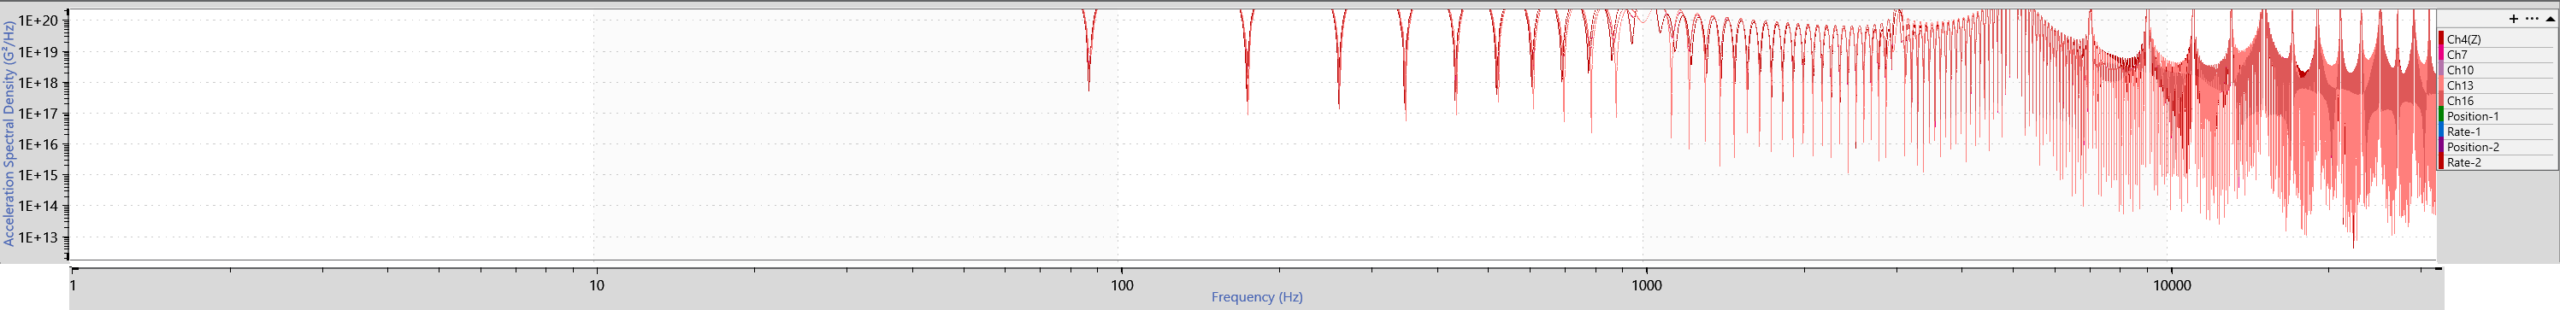
Z
Team Profile– Skid Pad Run (Bumps)
X
Y
Z
Team Profile– Gravel Durability
X
Y
Z
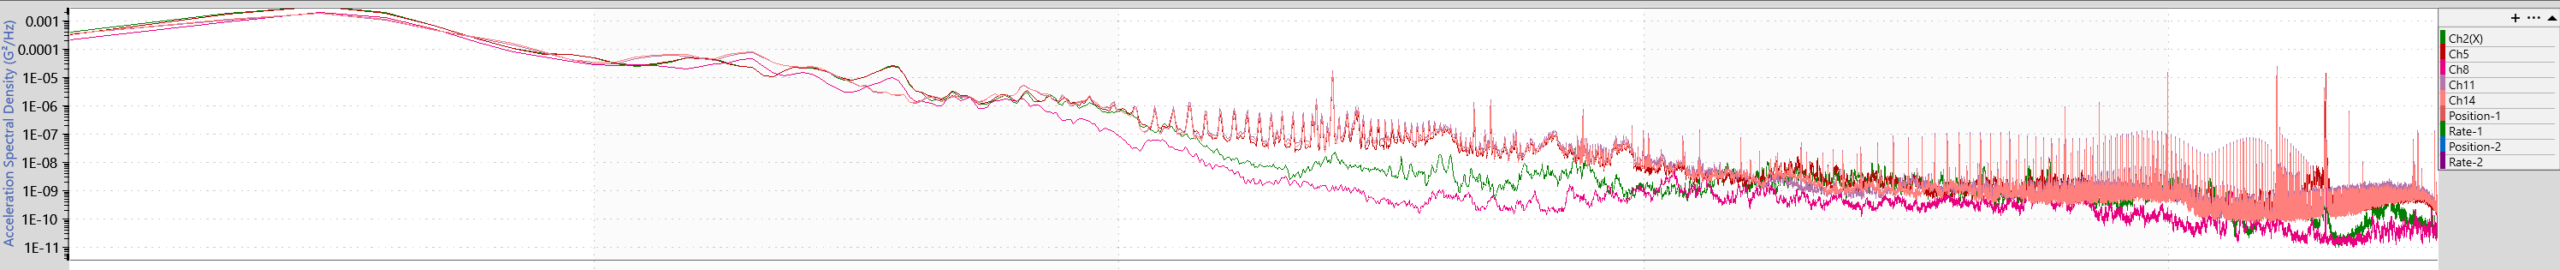
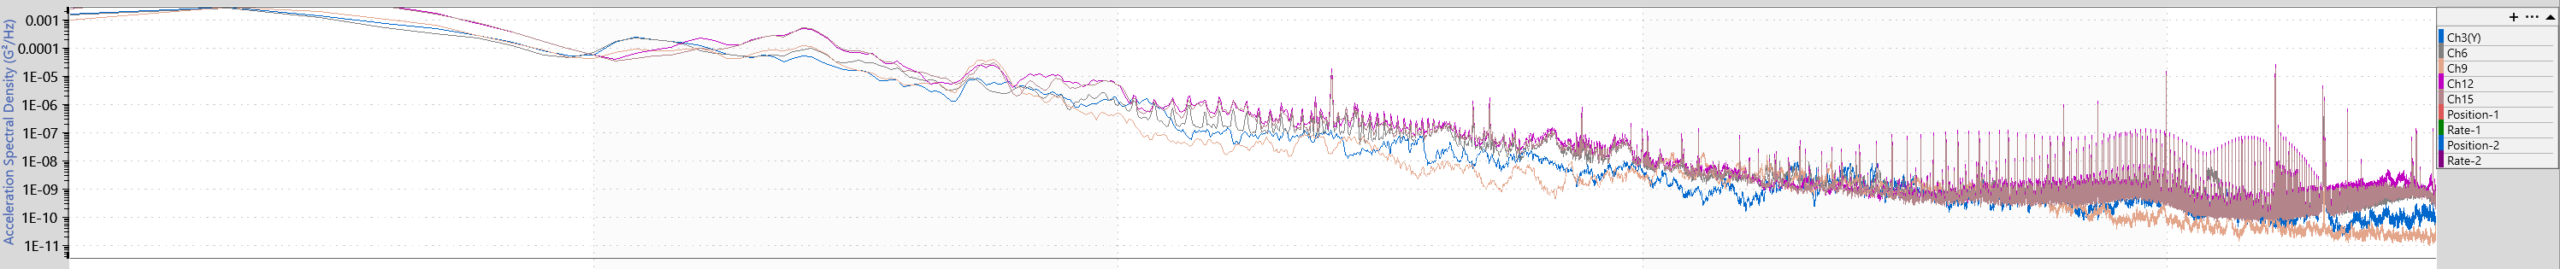
Team Profile– Paved Rough Road
X
Y
Z
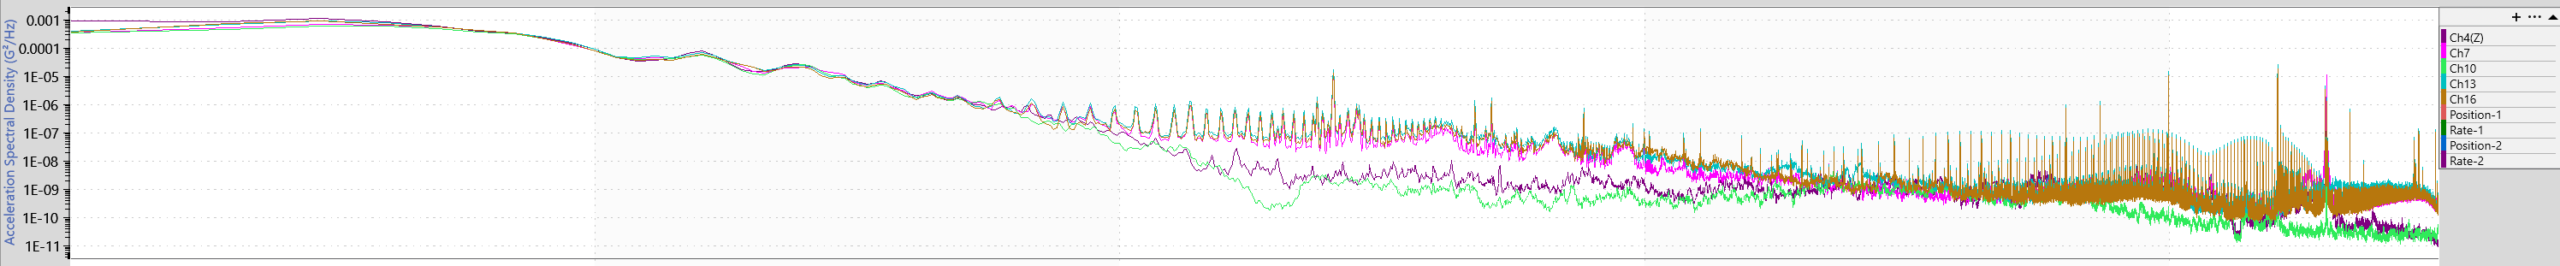
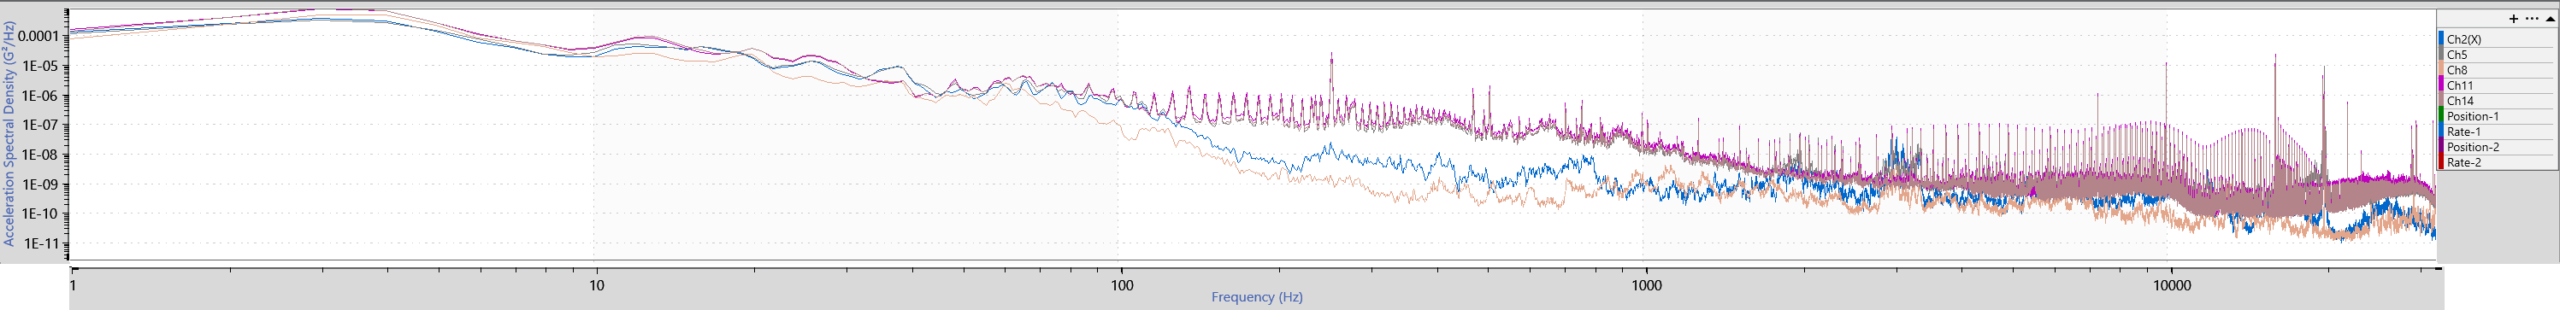
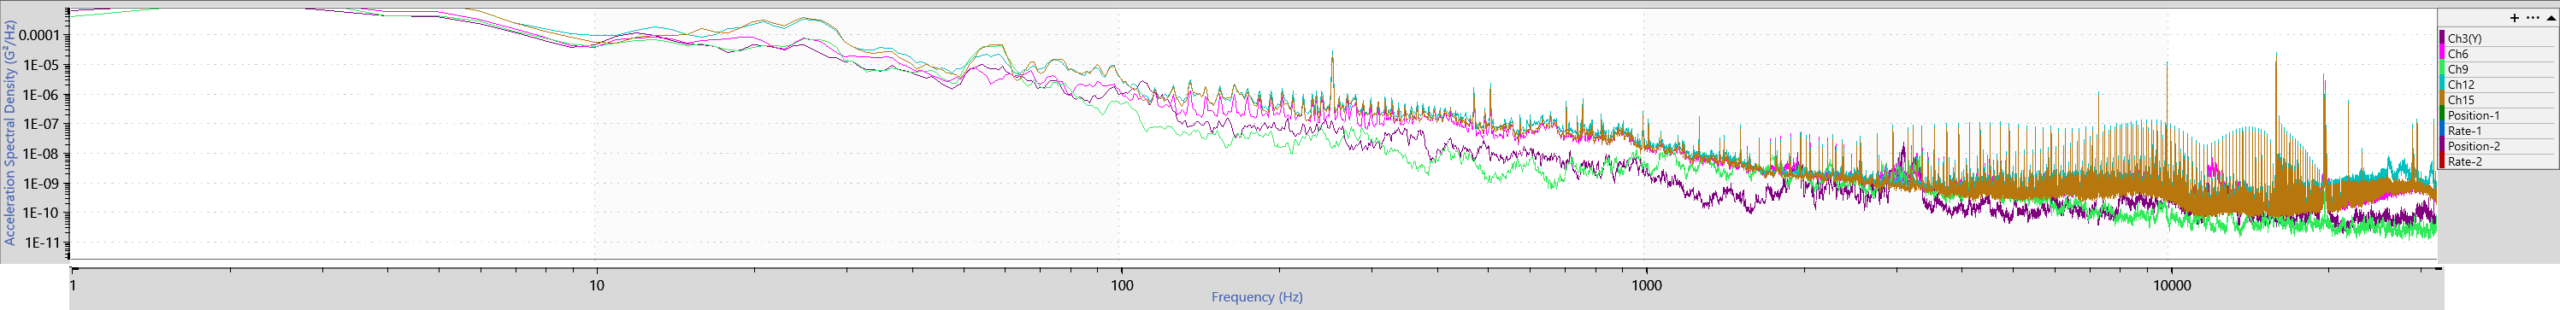
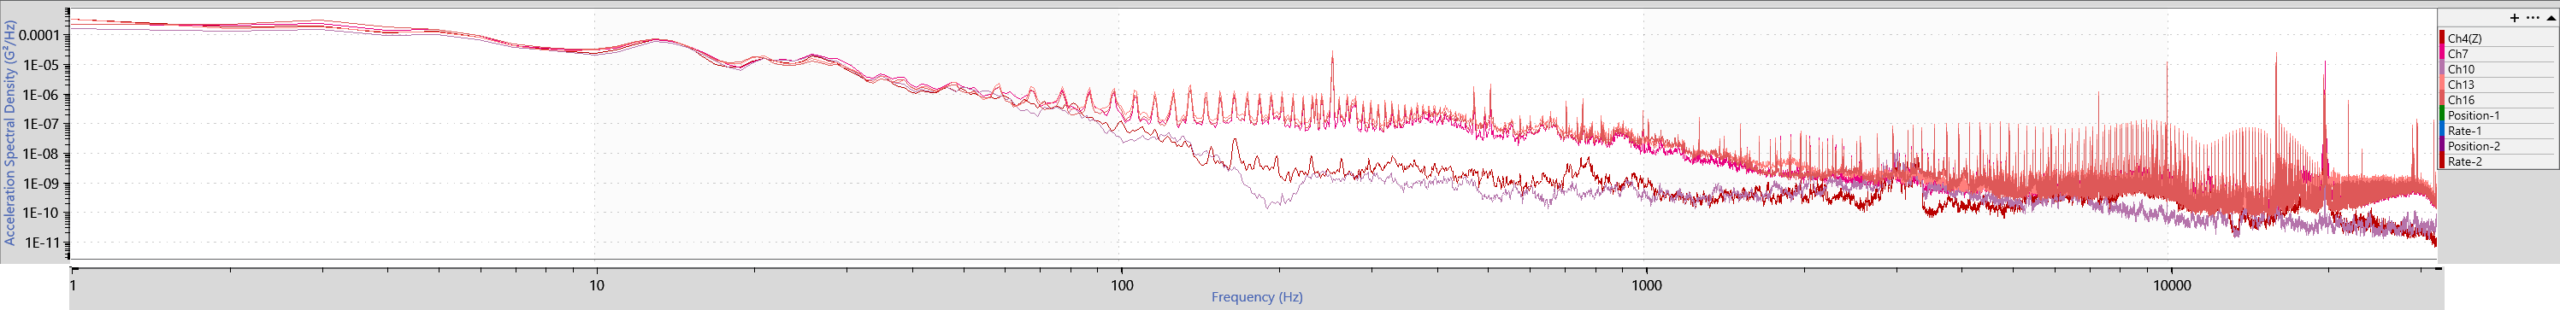
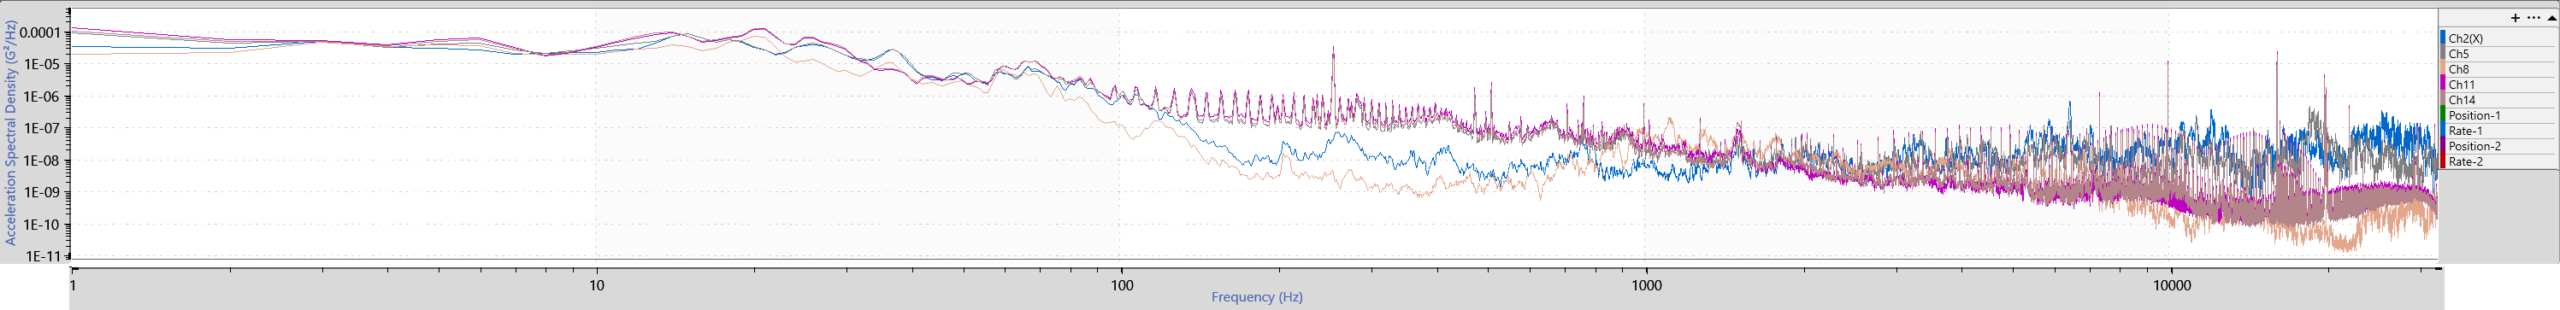
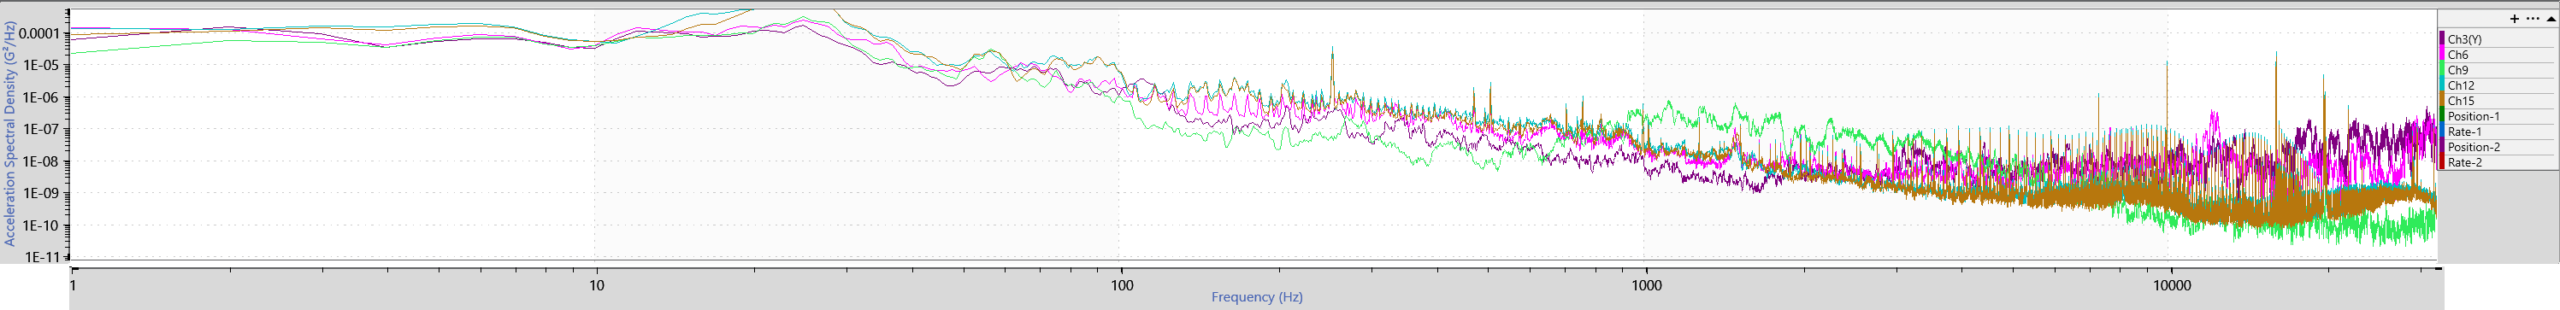
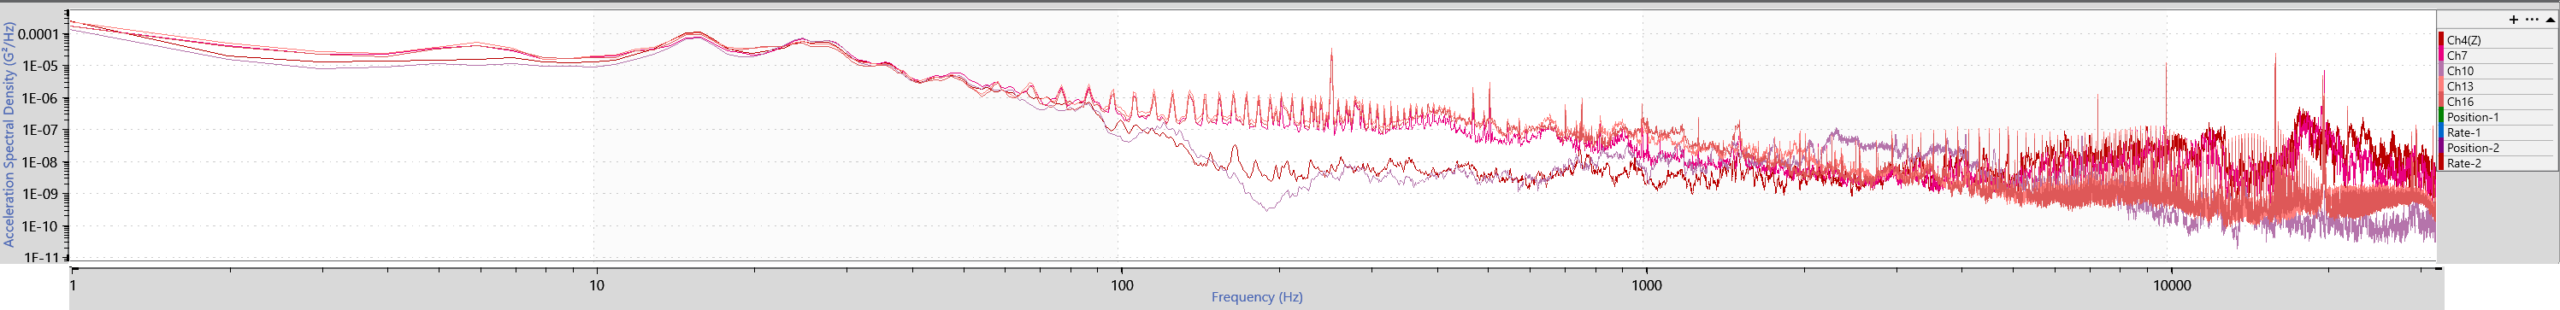
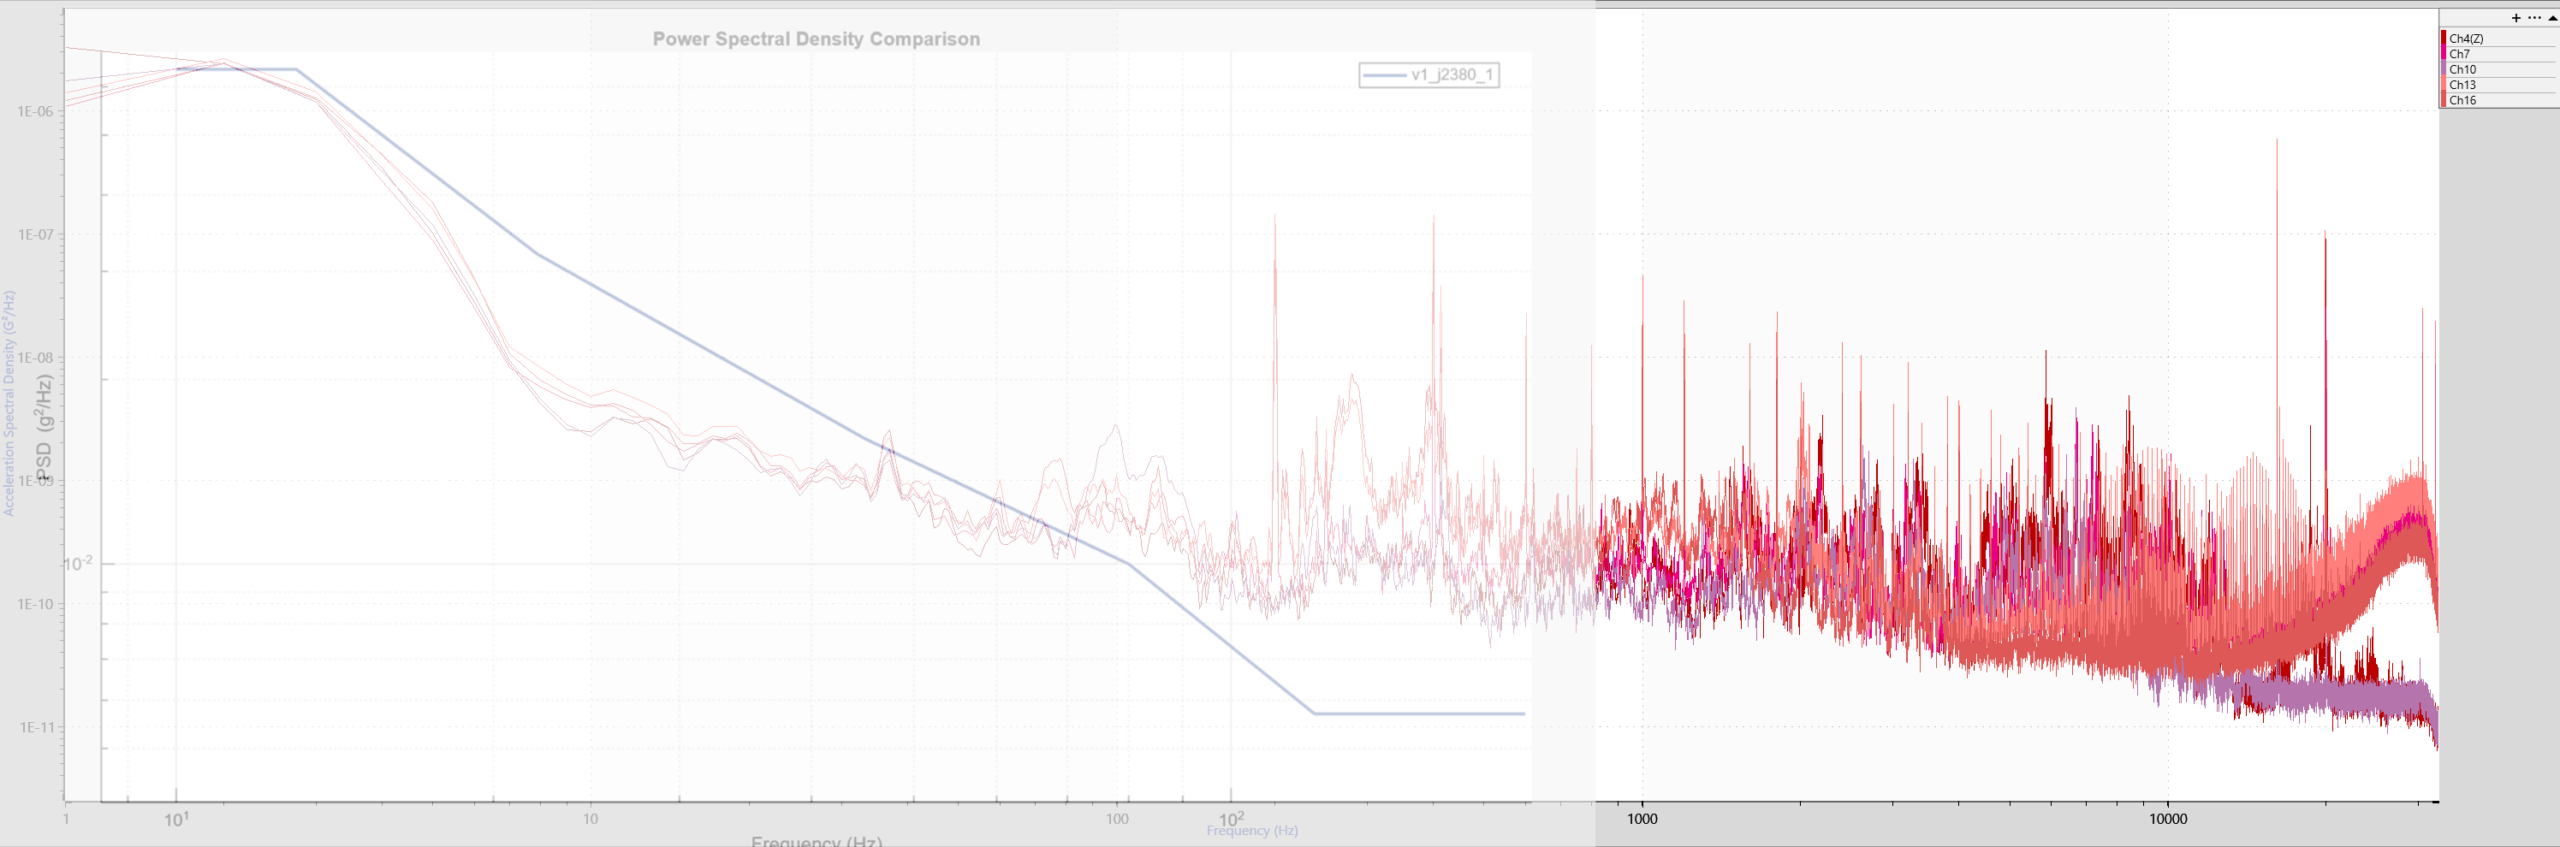
Team Profile– J2380 Comparable Profile
Our team developed a testing profile based on the combination of the data we collected during our runs at TRC.
This profile is meant to replicate the SAE J2380 standard for testing purposes of the vehicle up to 10 years / 150K miles of use.
The aspects of these profiles were chosen based on road conditions that a delivery van could experience in the real world, combining paved surfaces around a city environment, and rougher gravel and bumpy dirt roads in rural areas. This combination gives the most thorough replication of the conditions being tested in SAE J2380.
X
Y
Z
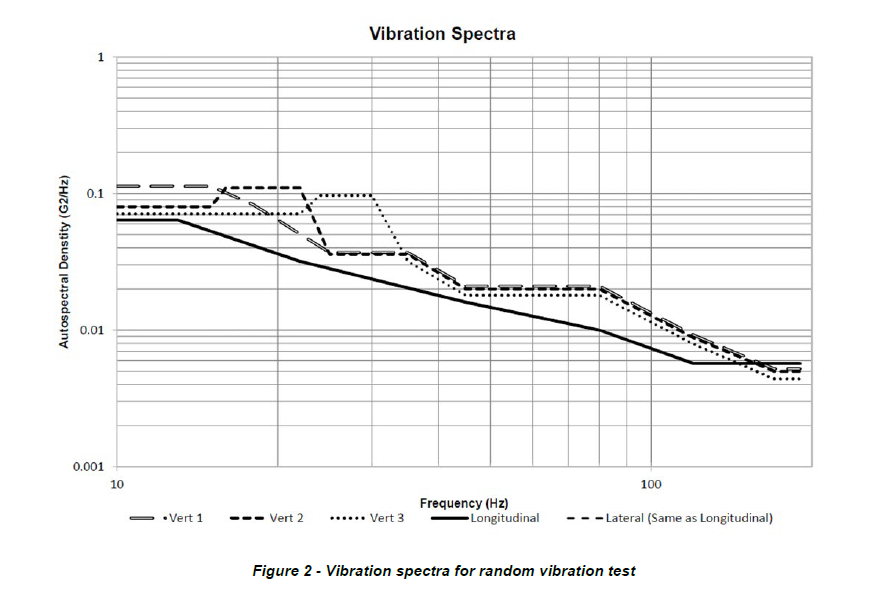
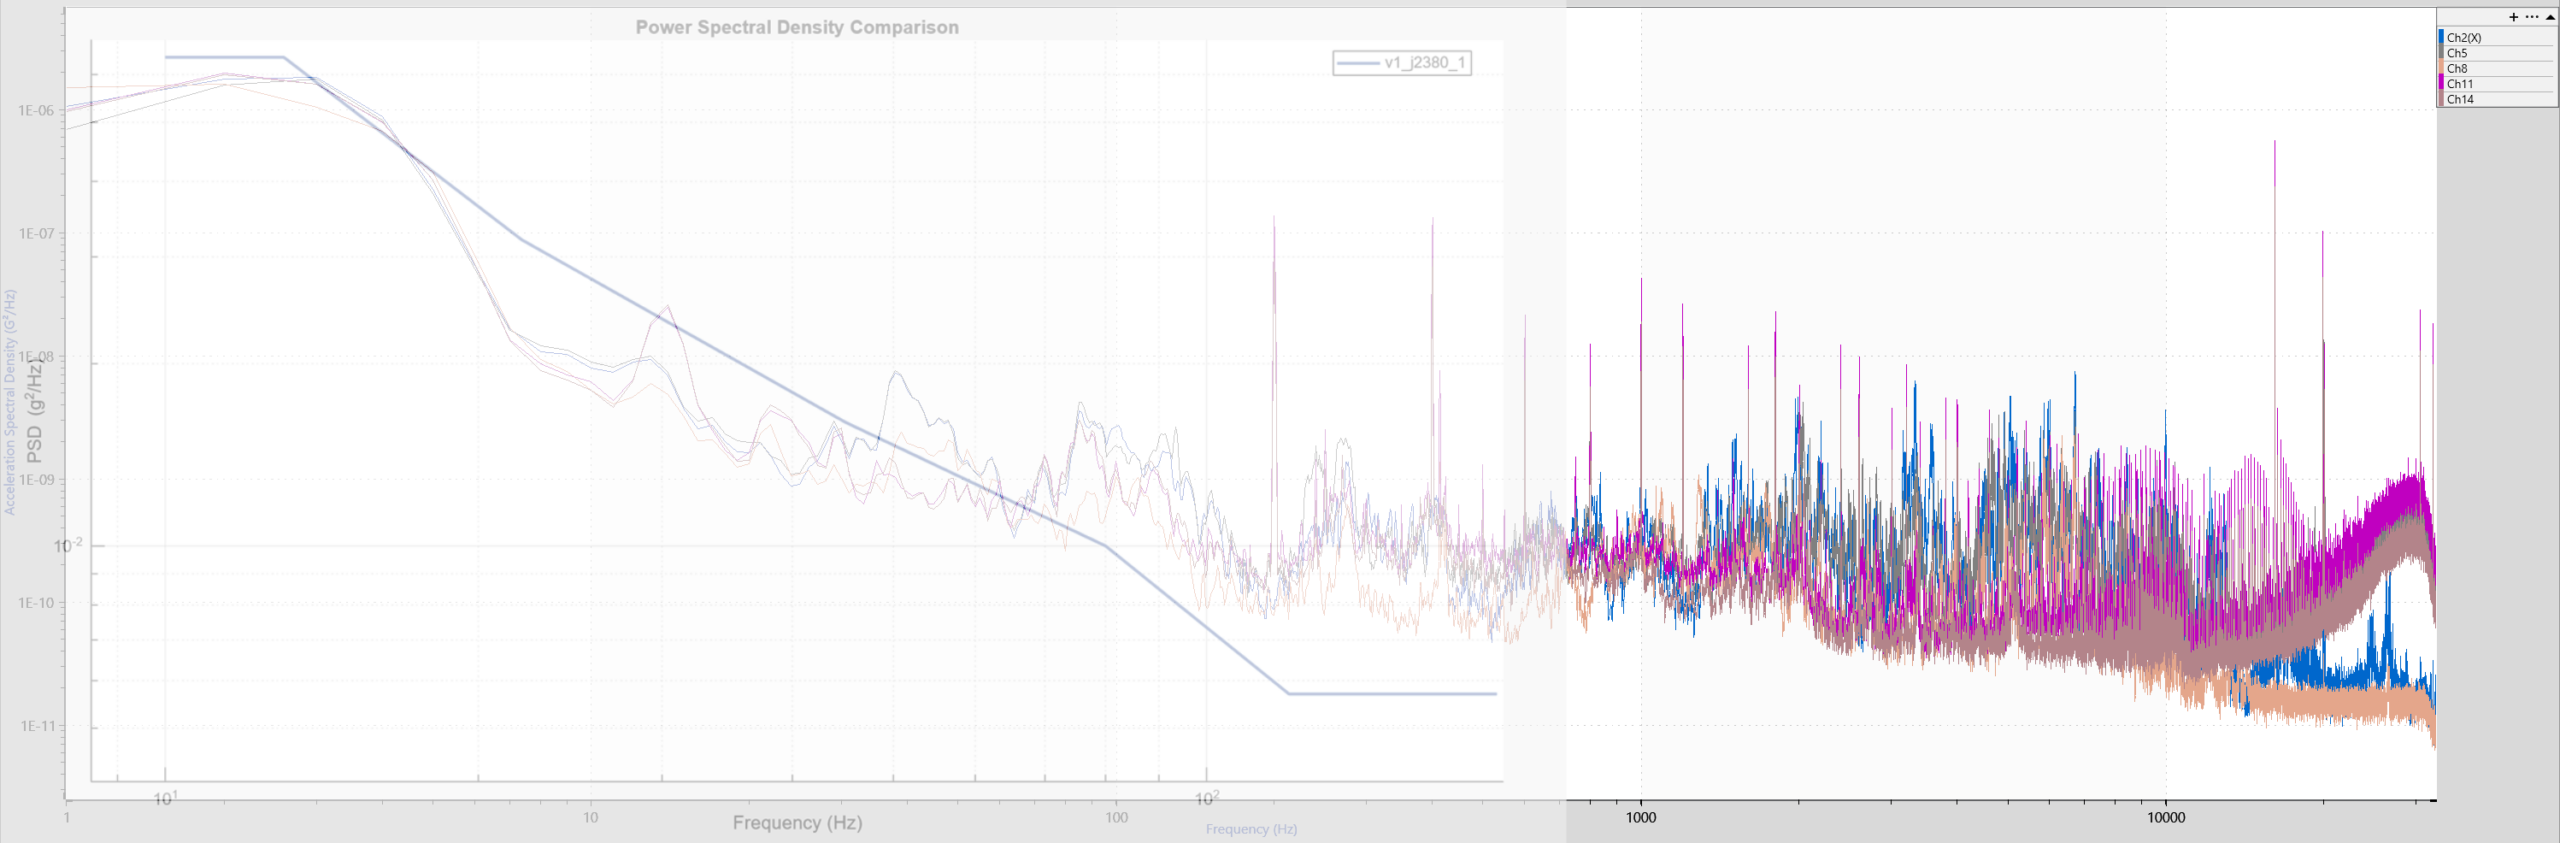
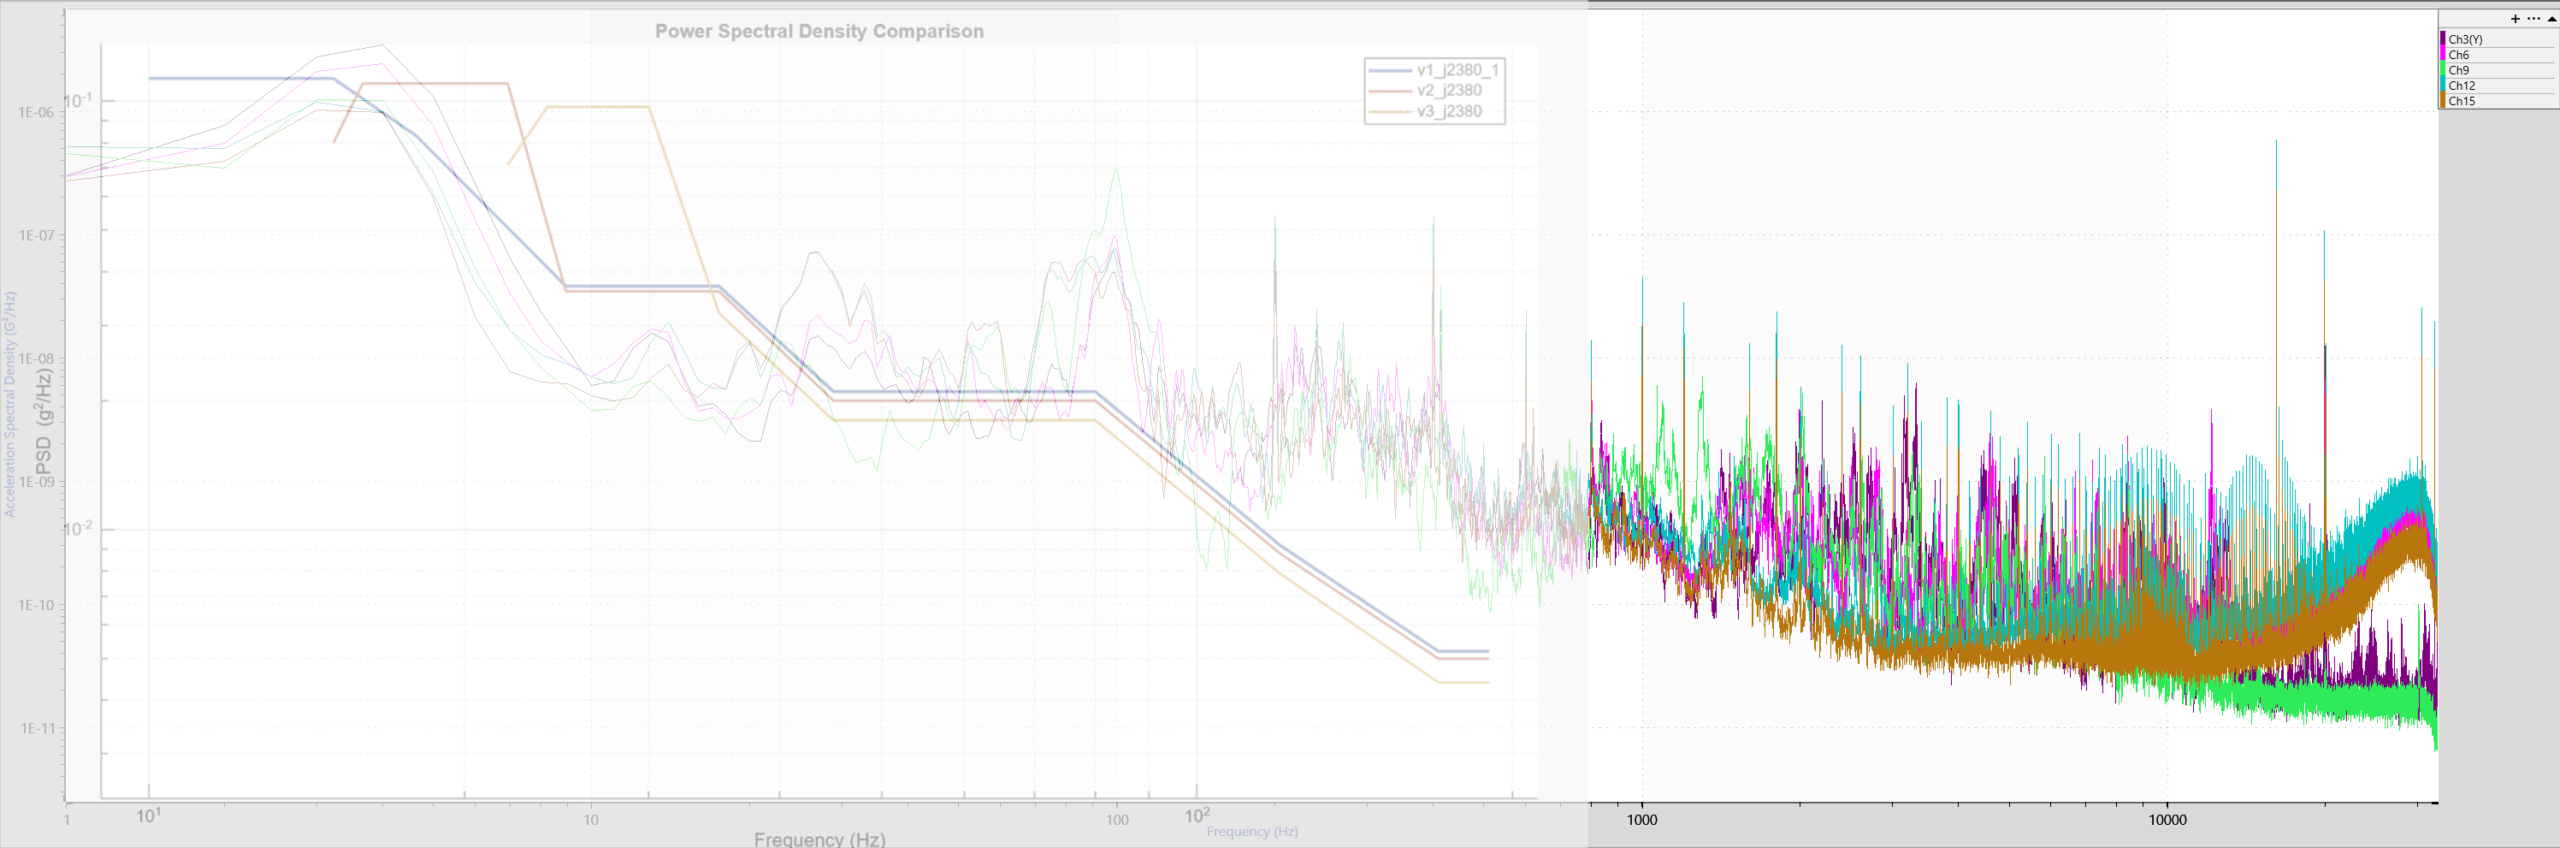
SAE J2380 PSD Profile
• Shown here is the spectral density vs frequency chart for SAE J2380
• A similar trend is observed between the trend of the SAE J2380 and the team-defined profile, however, differences in the PSD scaling between the two are due to the vehicle being subject to different magnitudes of power under different road conditions