University and vocational students nationwide are partnering to take on the three-year Battery Workforce Challenge collegiate competition. Sponsored by the U.S. Department of Energy, this challenge gives students the opportunity to gain hands-on experience in battery design outside of the traditional engineering curriculum. Vibration Research is committed to supporting the next generation of engineers by providing participants with testing solutions that ensure battery durability and safety in real-world conditions.
The following is the culmination of the students’ first year of work, which is provided here for educational purposes only.
Sensor Location
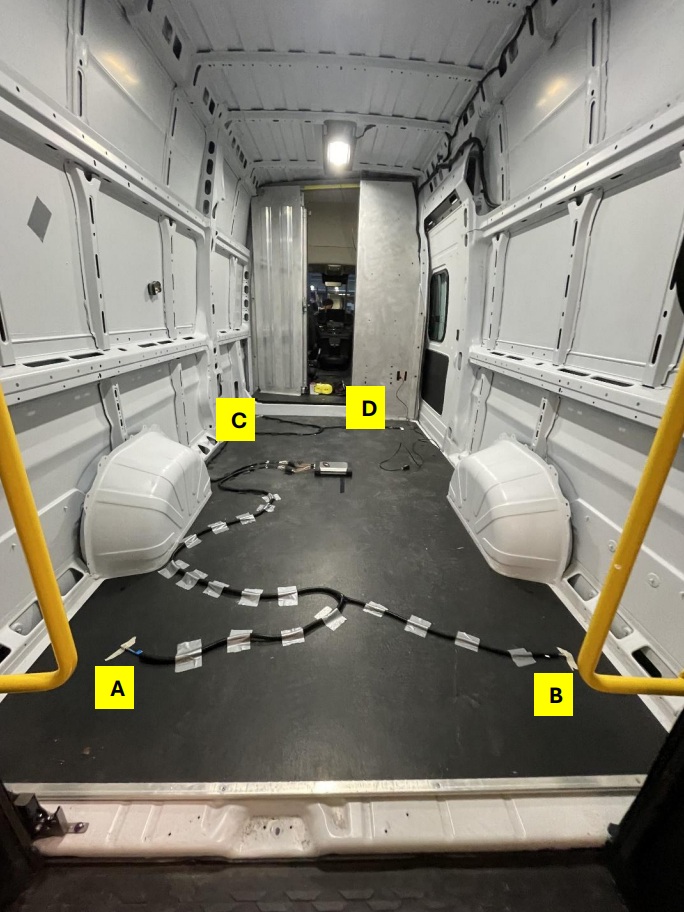
Figure 1. Sensor locations in the van, where A, B, C, and D represent each sensor. All sensors
are super glued (Gorilla Brand) to the van. Surfaces were cleaned with 99% acetone prior to
adhesion. Additionally, the cable harnesses were duct taped to the floor of the cargo area to make
sure the cables did not move. Sensor A corresponds to channel three in the test data. Sensor B
corresponds to channel four in the data. Sensor C corresponds to channel two in the data, and
sensor D corresponds to channel one in the data.
Figure 2. Gorilla super glue used in the project.
Drive Plans
Drive plans were categorized into three groups, bumpy city roads with lots of potholes, muddy dirt roads, and normal daily commute mixed city and highway road. The bumpy road test represents the harshest condition in the vertical axis, muddy dirt road test represent mixed lateral and vertical movements, and the mixed city and highway road test represents normal driving with high lateral forces during high speed corners, hard brakes, and wide open throttle (WOT) scenarios. The sampling rate was 65.5 kHz.
Test Setup
Due to the limited cable length, cables could not be routed under the vehicle. Therefore, our sensors were super glued (Gorilla brand) to the floor of the cargo area in the back of the van on all four corners, as shown in Figure 1. The data acquisition (DAQ) hardware was mounted in the center of the cargo area using Velcro. The cables were then routed along one side of the cargo area to the DAQ and secured in place with duct tape. Corrugated plastic tubes were used to make cable assemblies to protect the cables during operation.
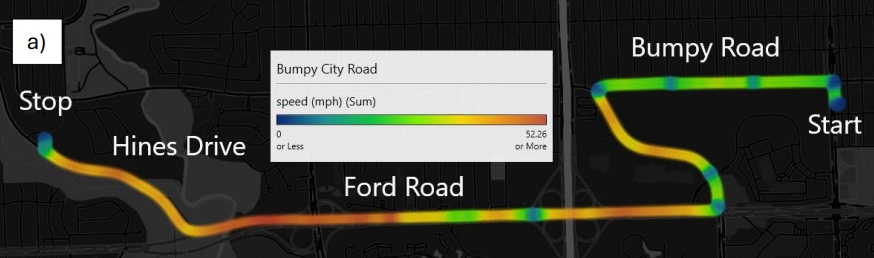
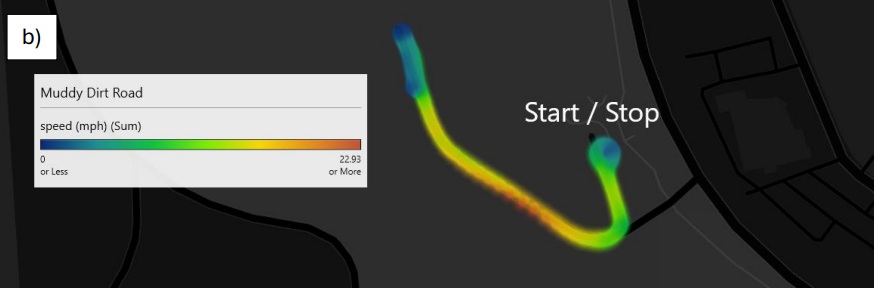
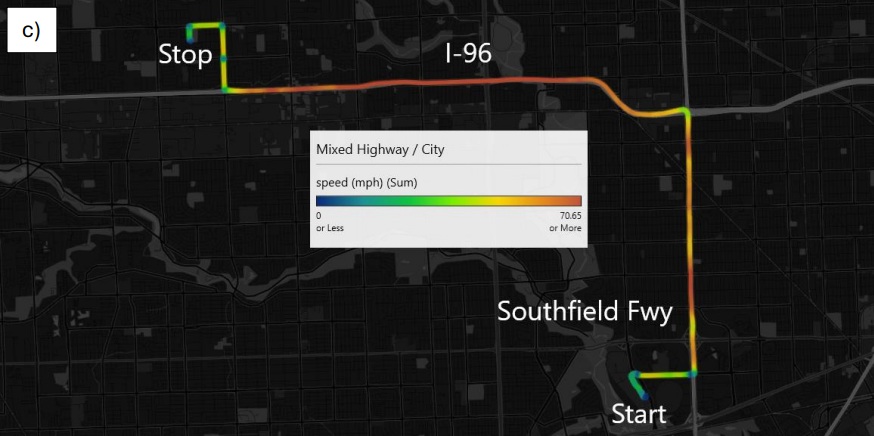
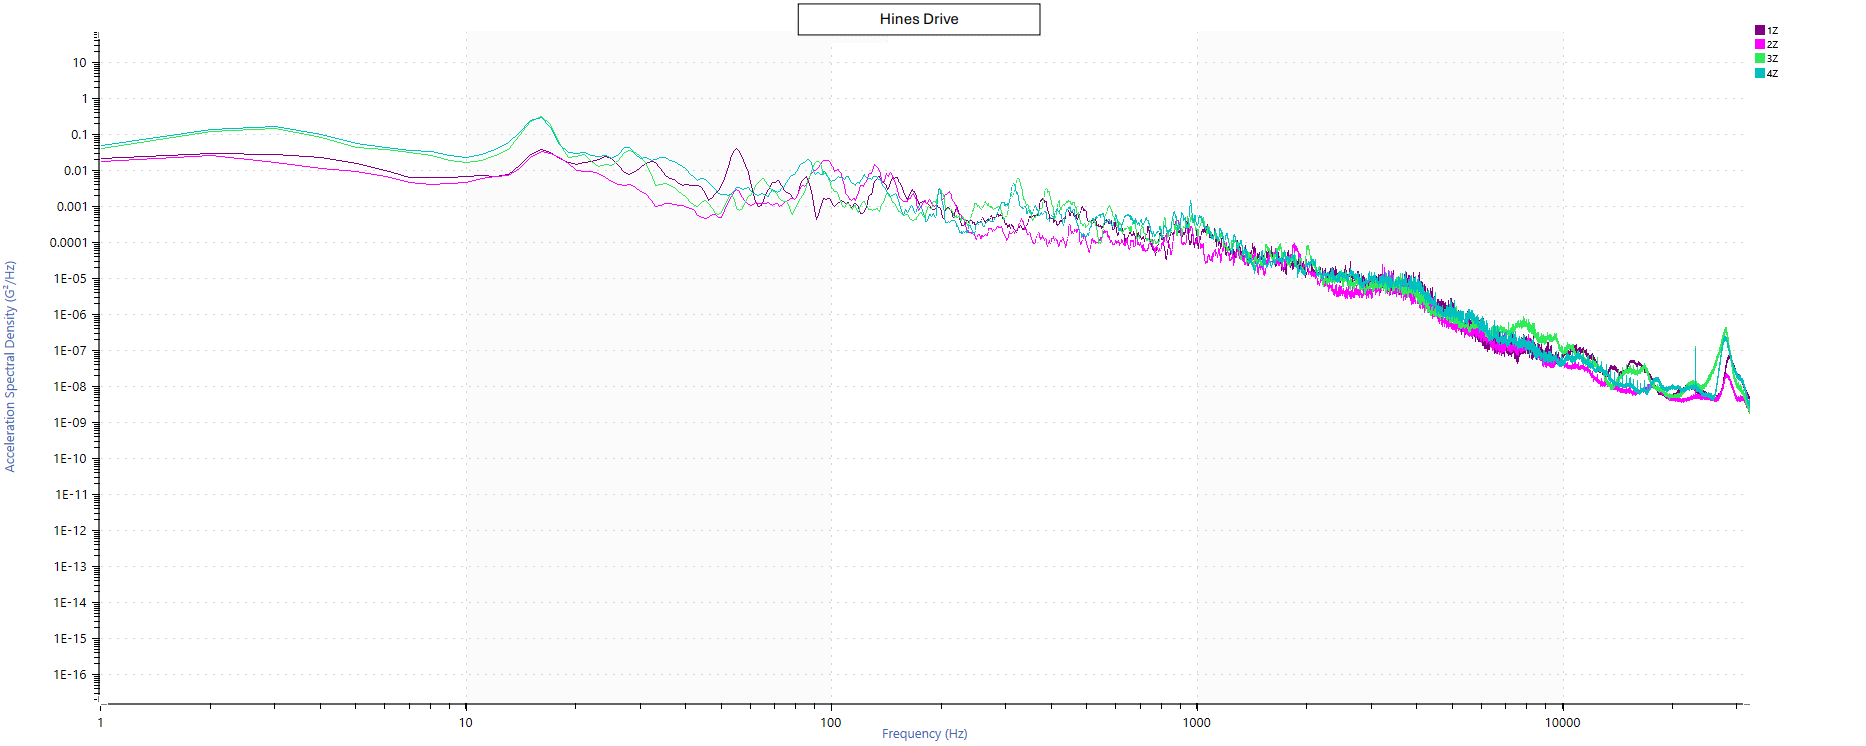
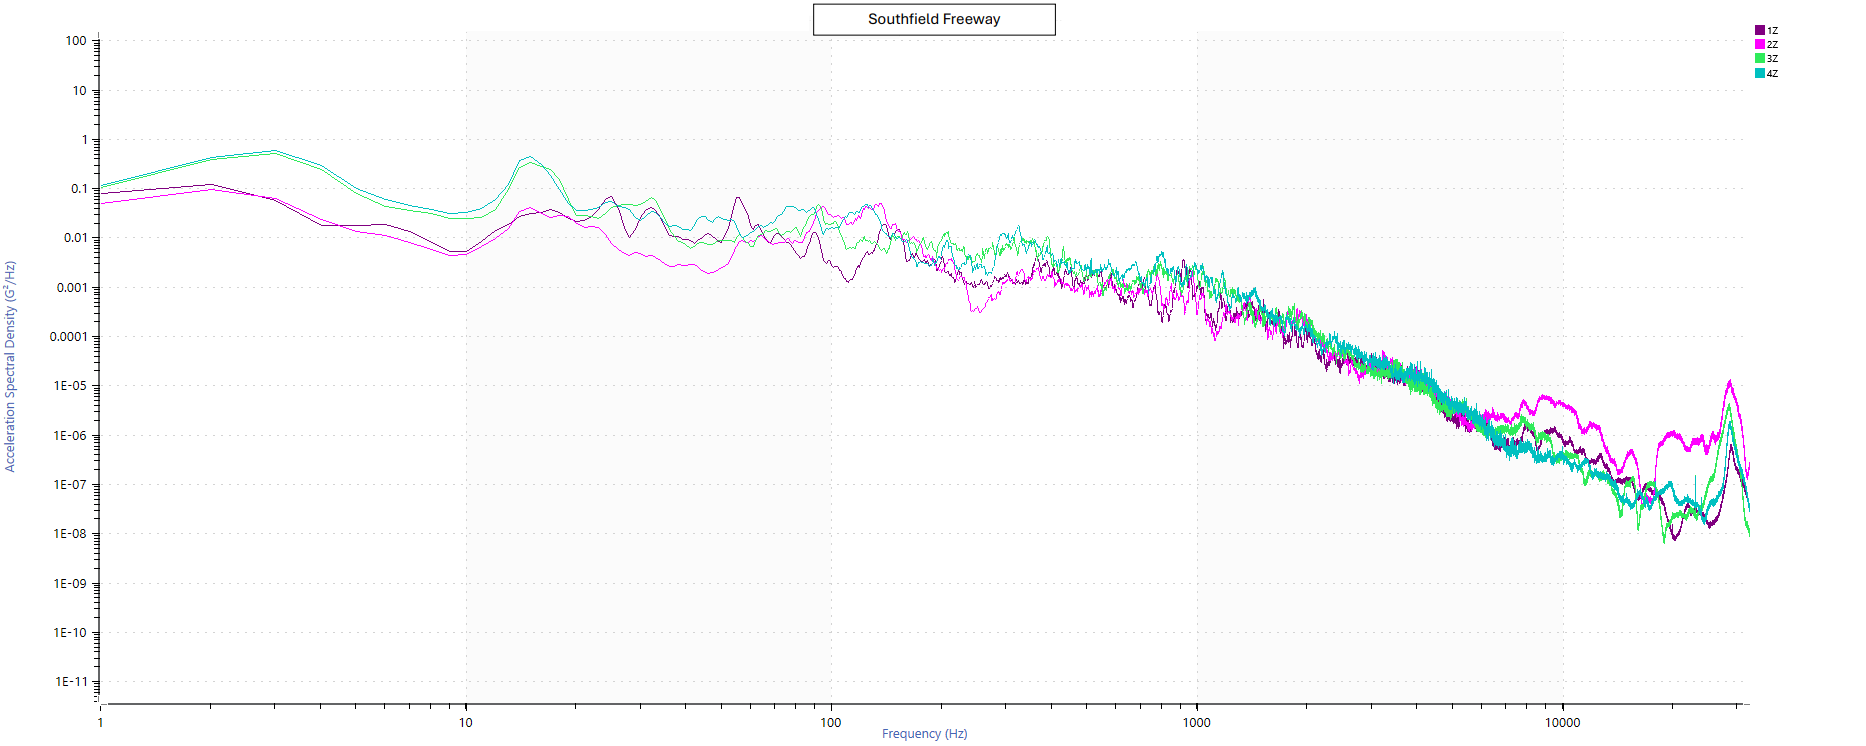
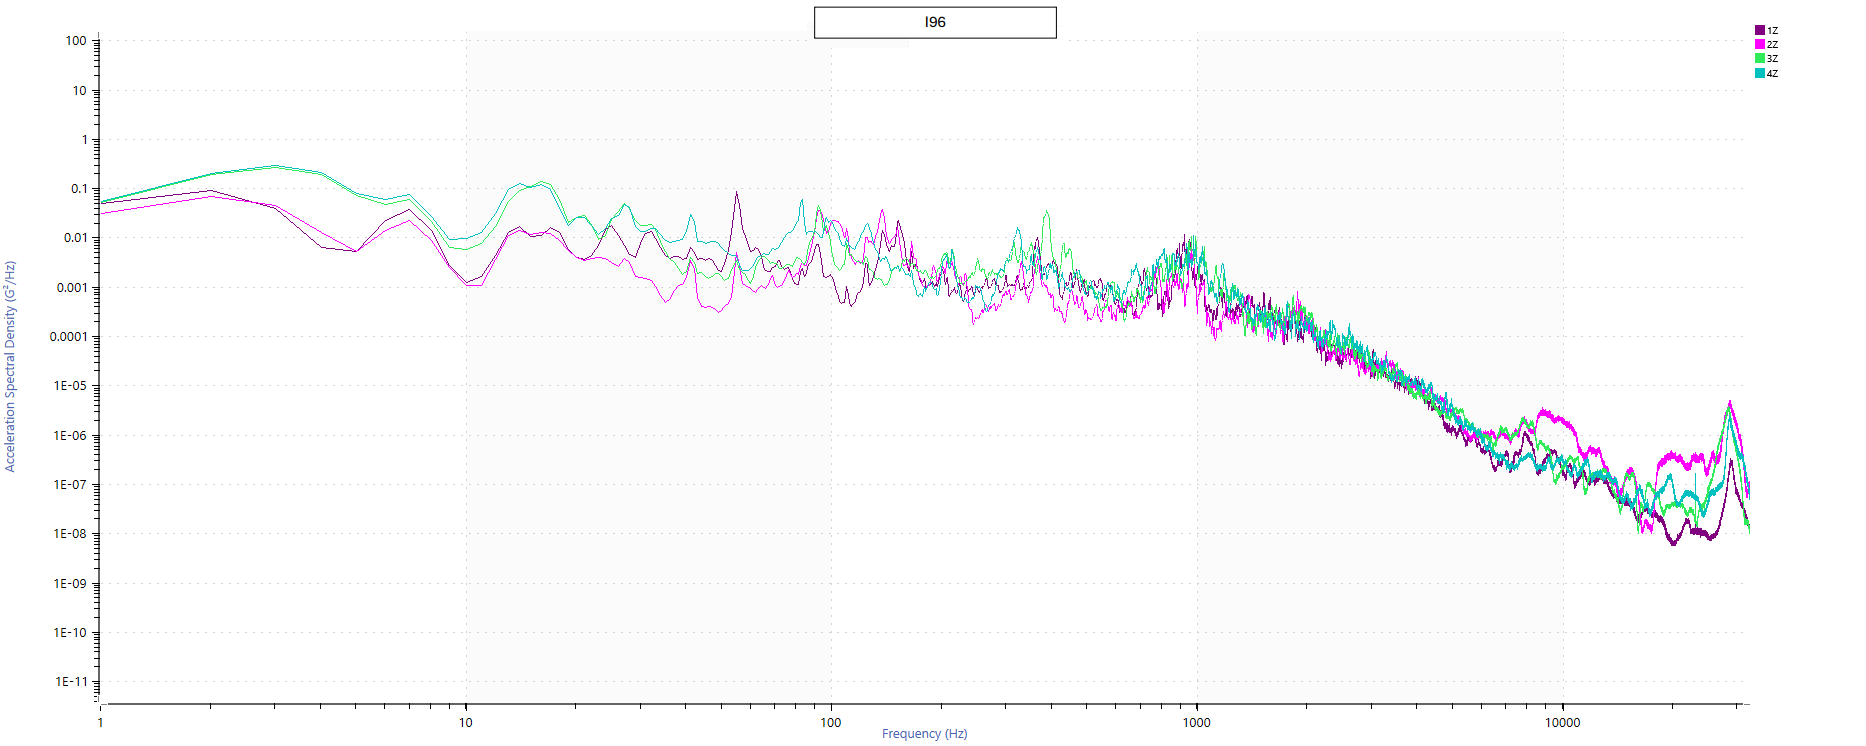
Figure 3. Heat maps showing the routes taken and speed during the routes. Subfigure (a) shows the bumpy city road
route, which has data from a residential neighborhood with lots of potholes, a major highway with bumps along the
way, and a smooth side street with several parks along thee way. Subfigure (b) shows the muddy dirt road route.
Subfigure (c) shows the last route taken which starts in Dearborn and ends in Livonia. The route consists of city
driving and freeway driving, with most data being on Southfield Freeway and I-96.
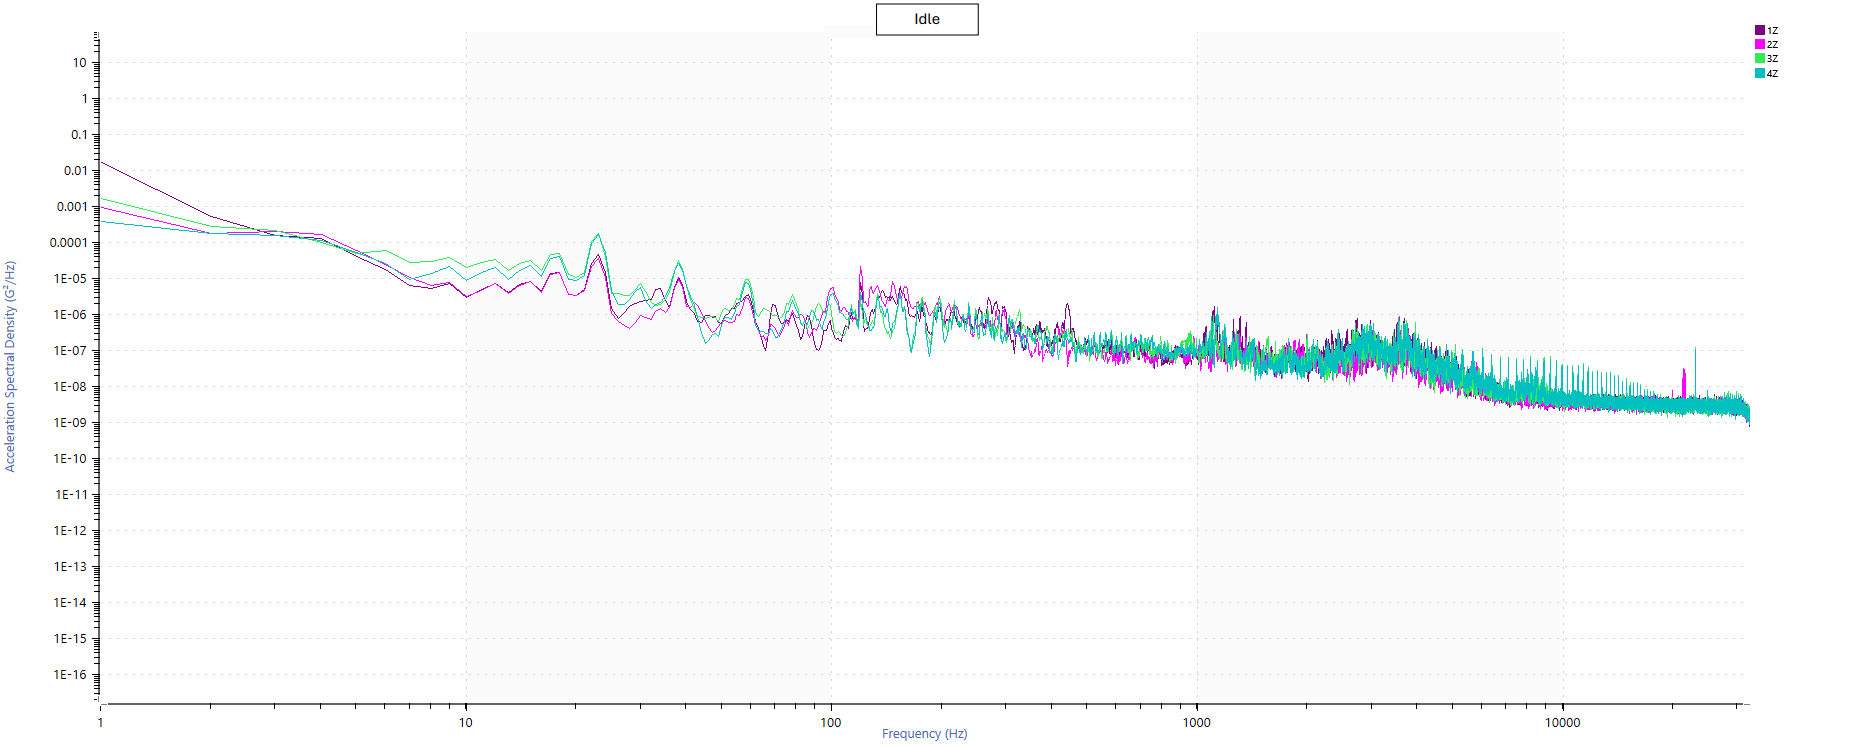
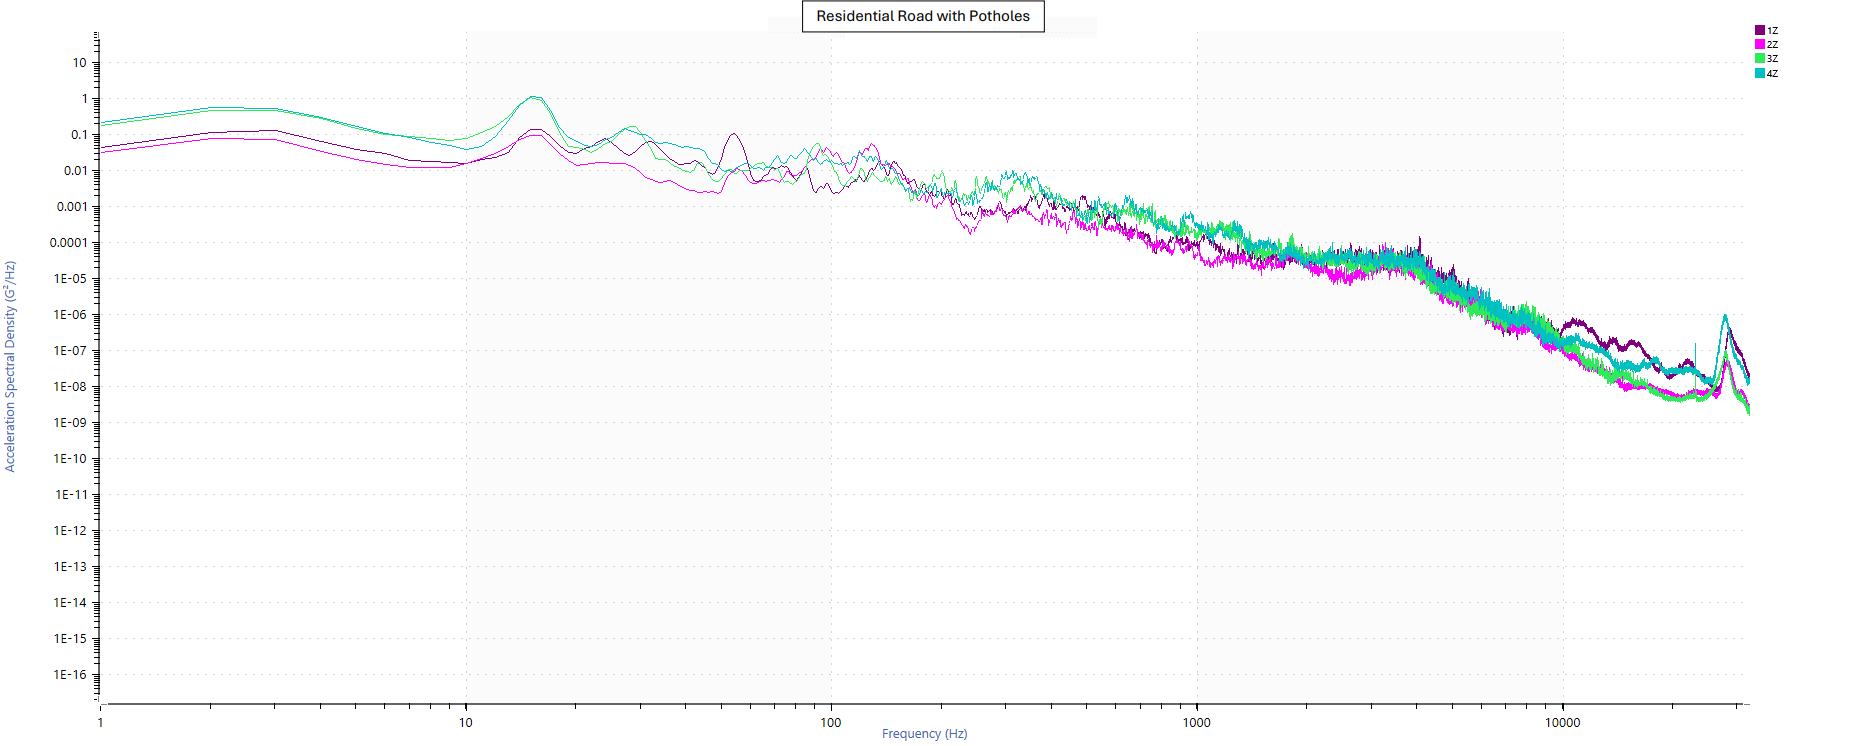
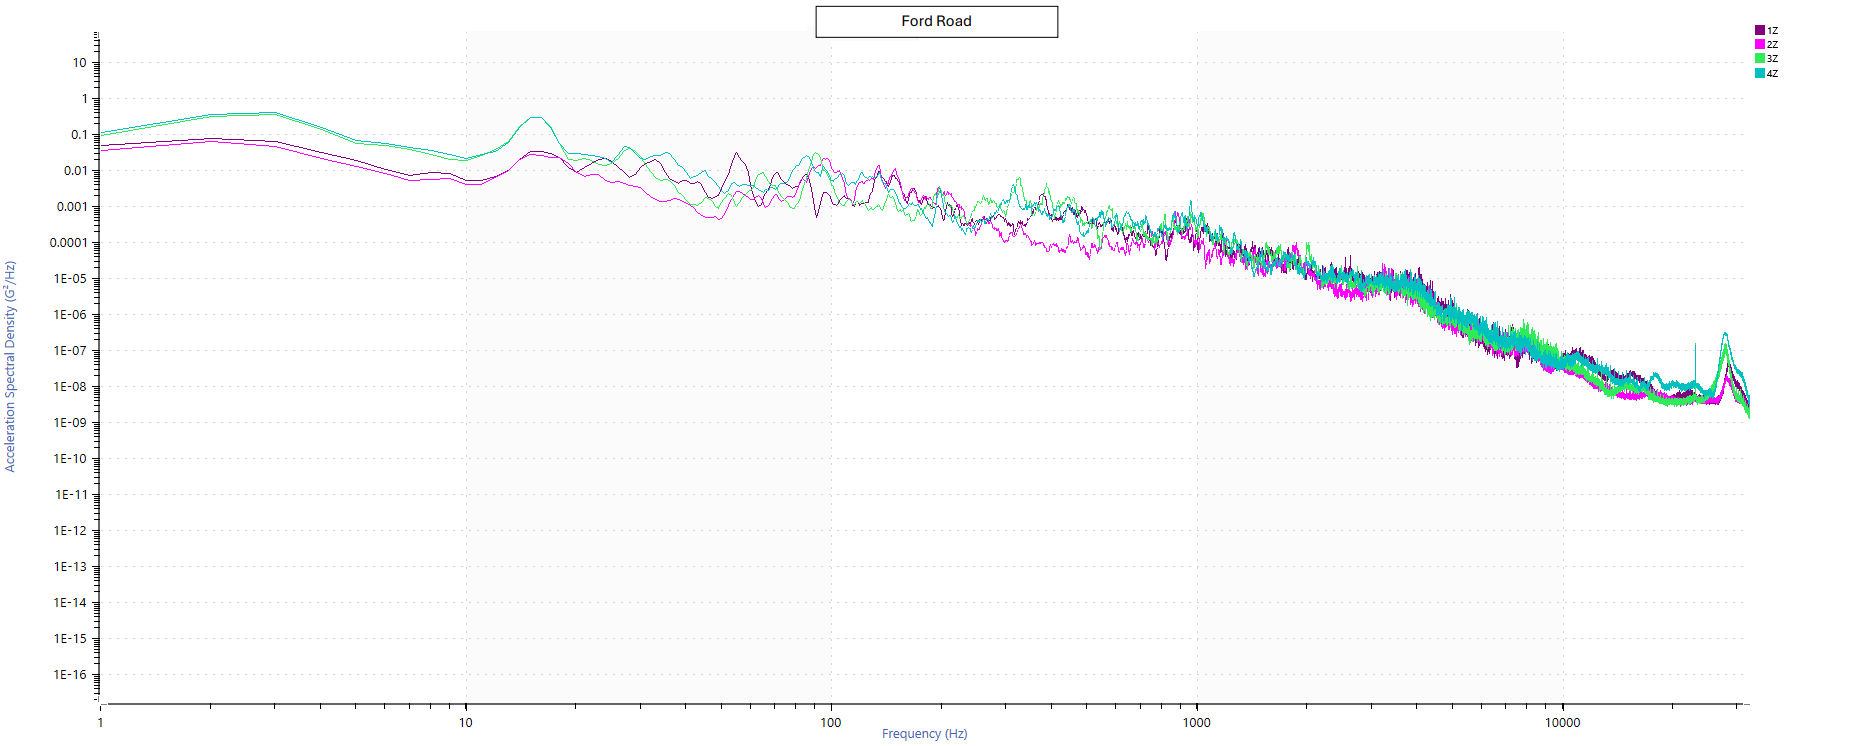
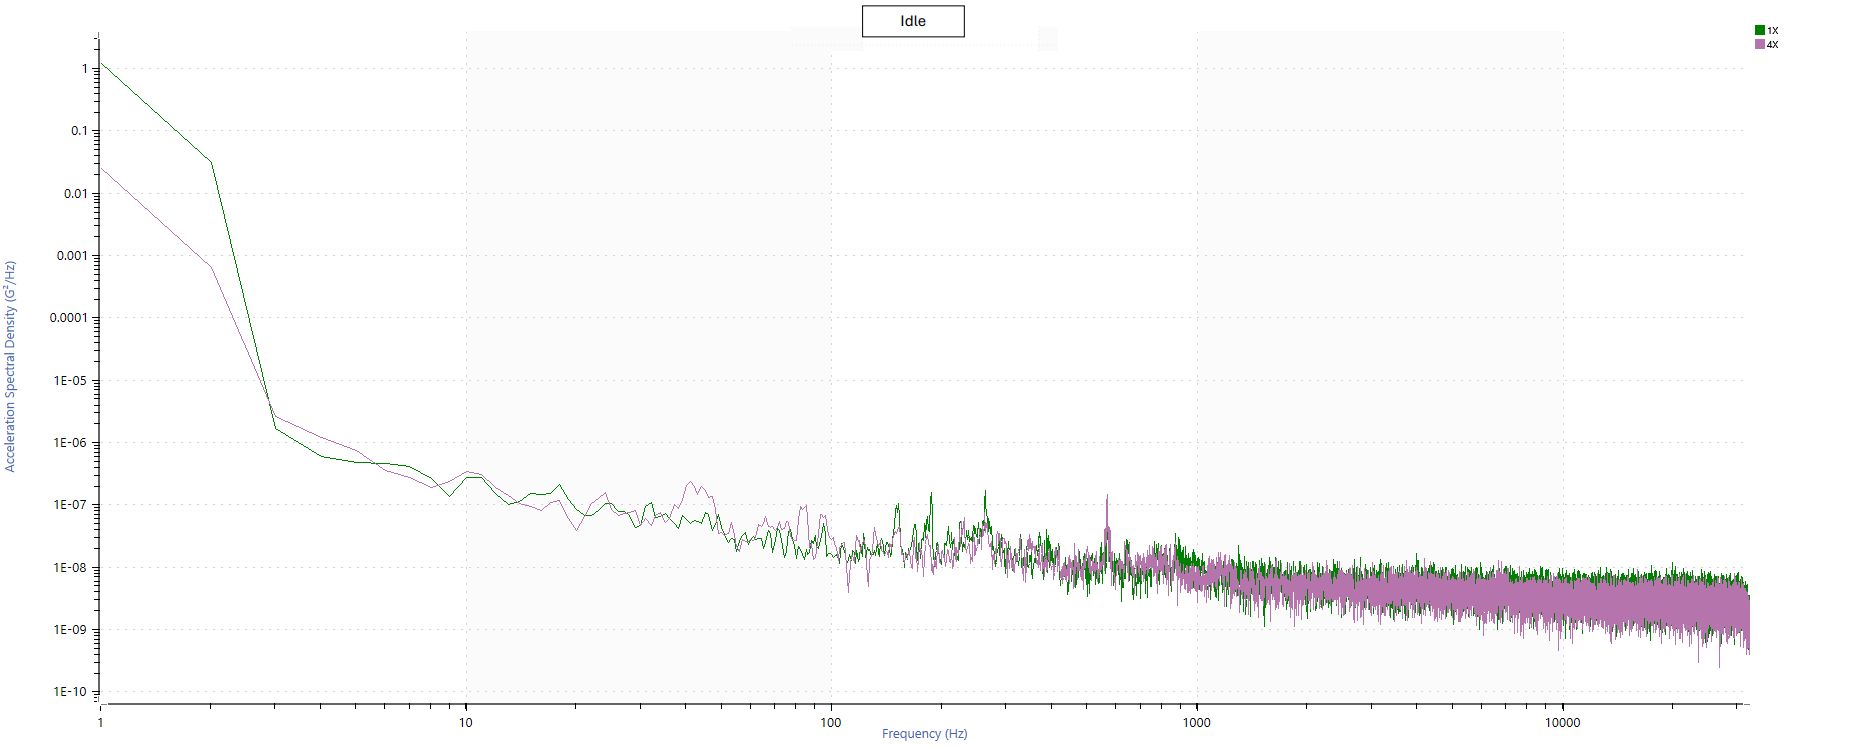
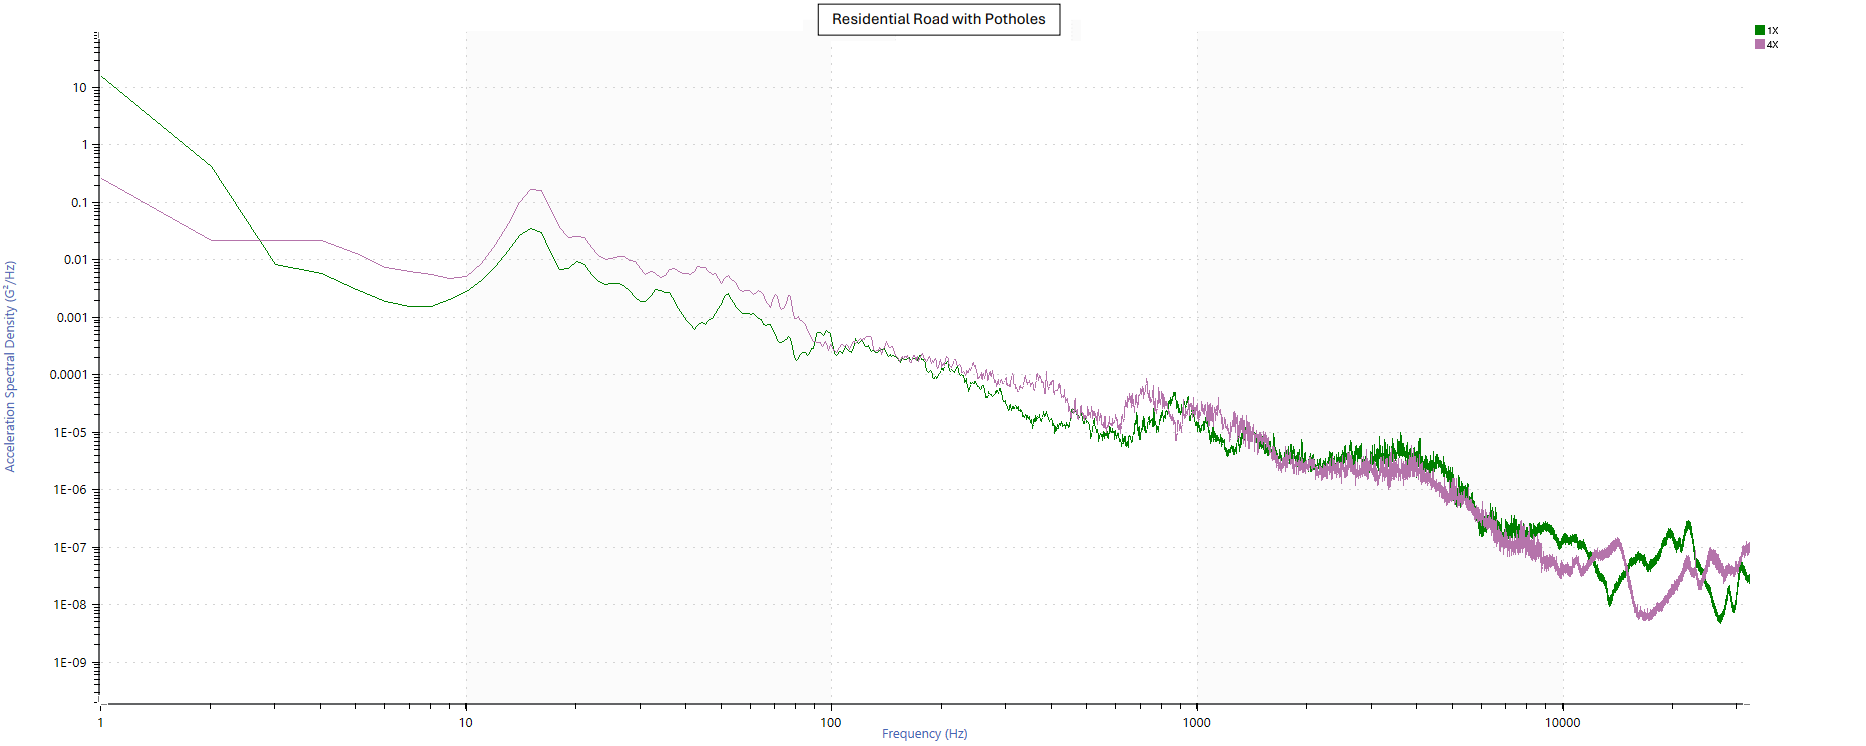
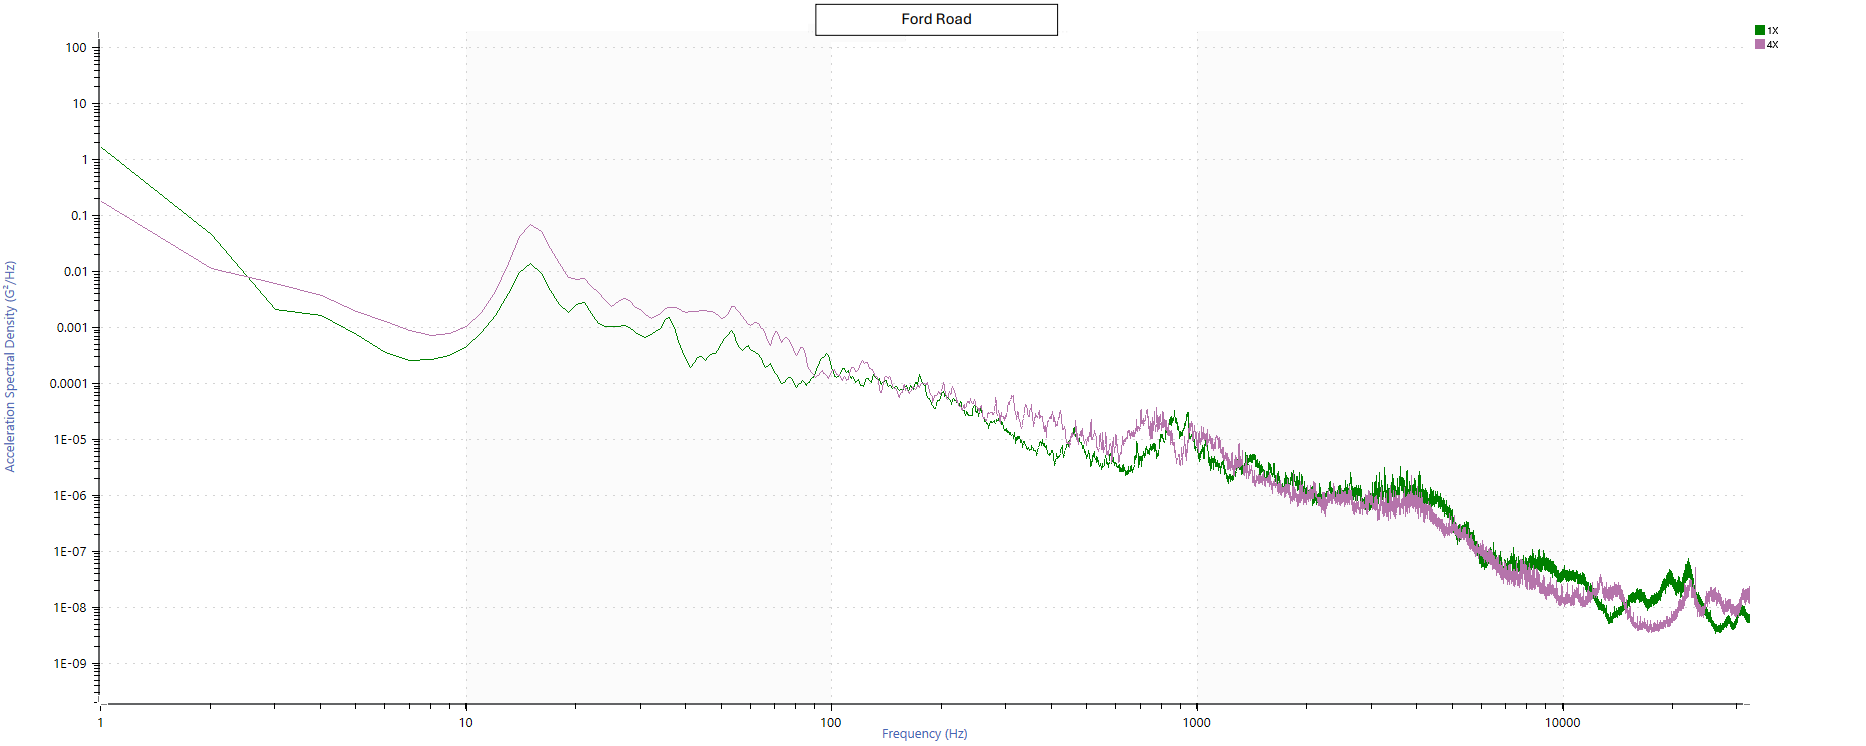
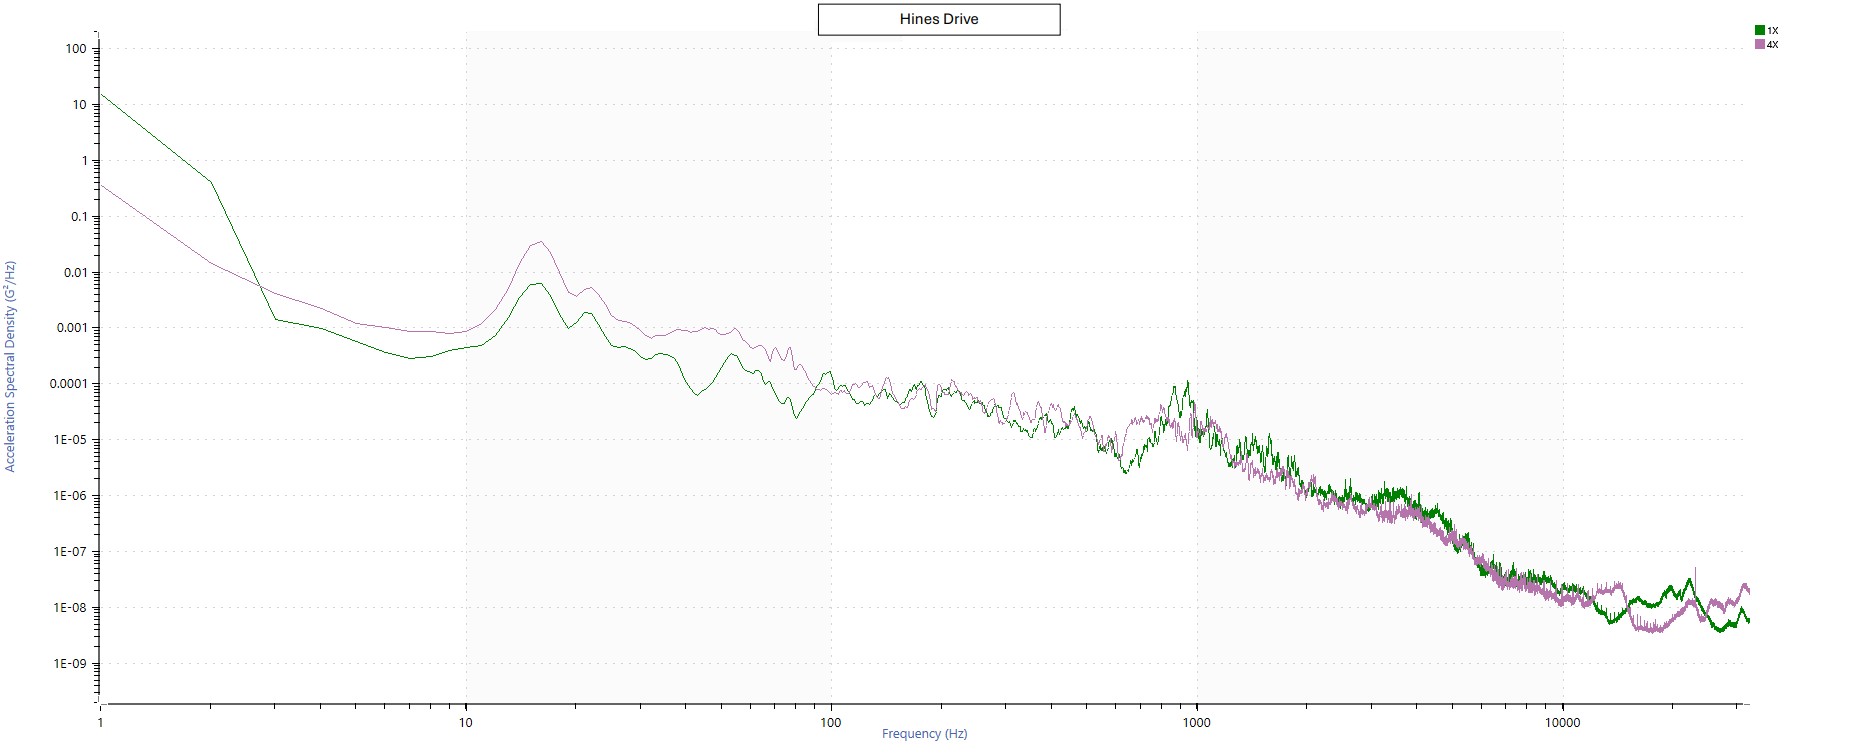
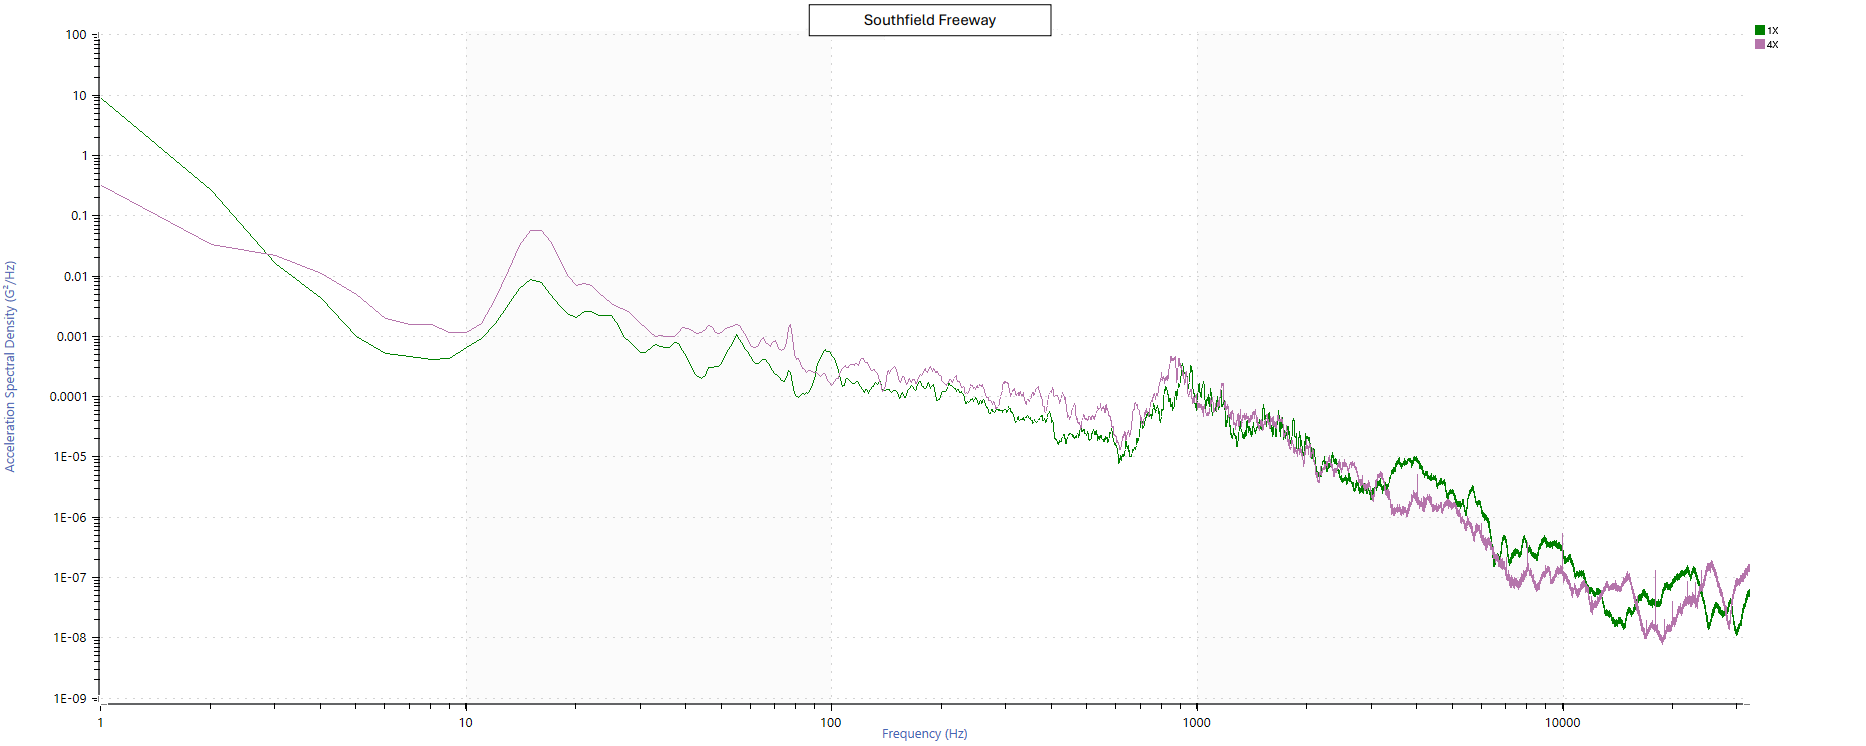
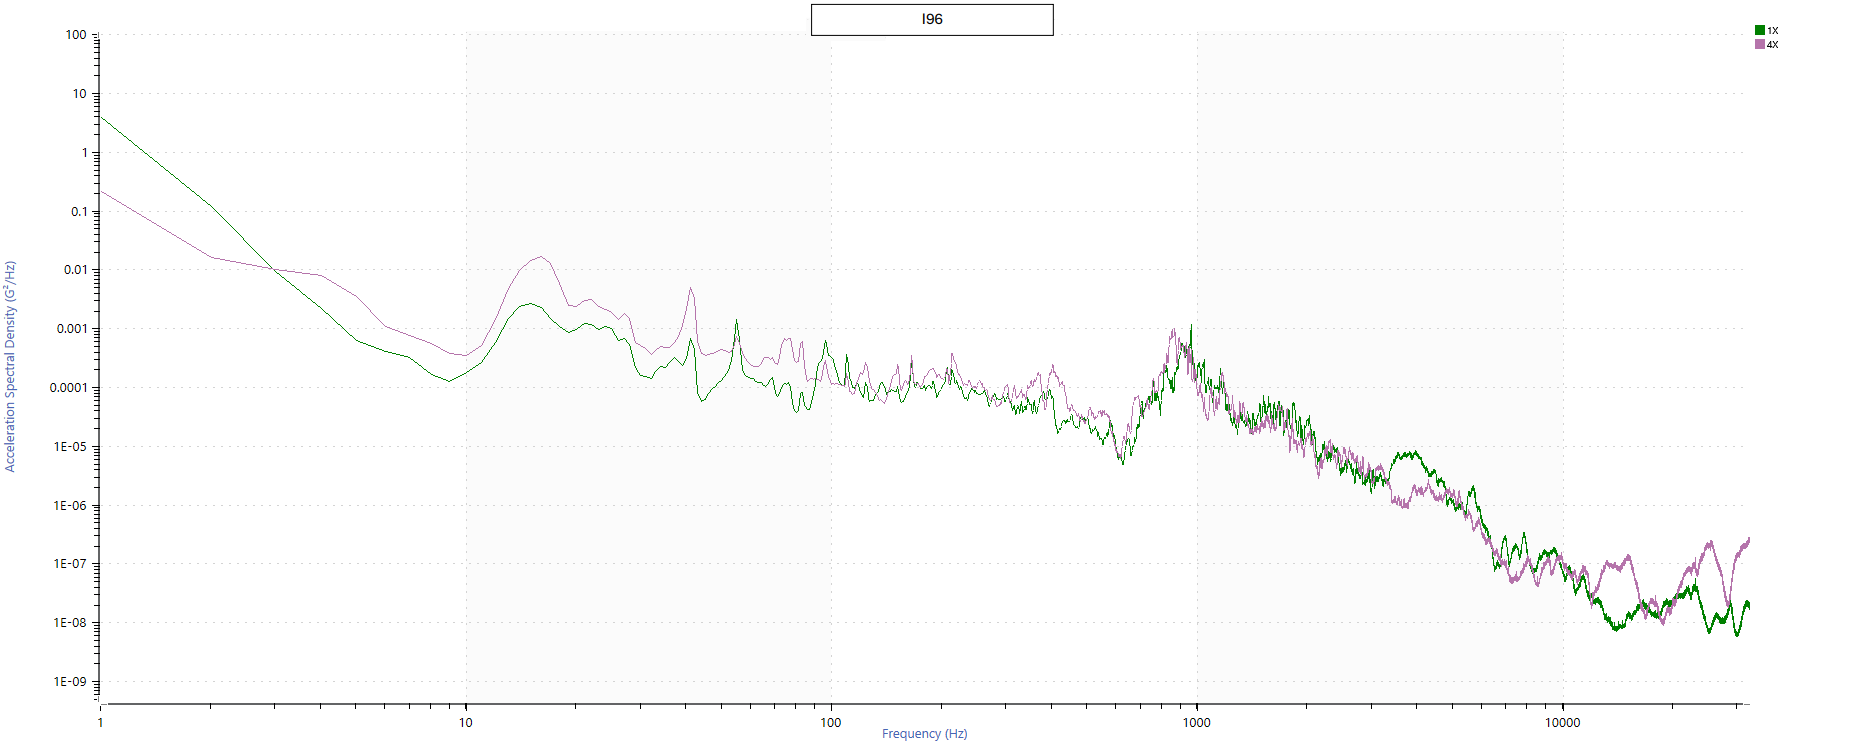
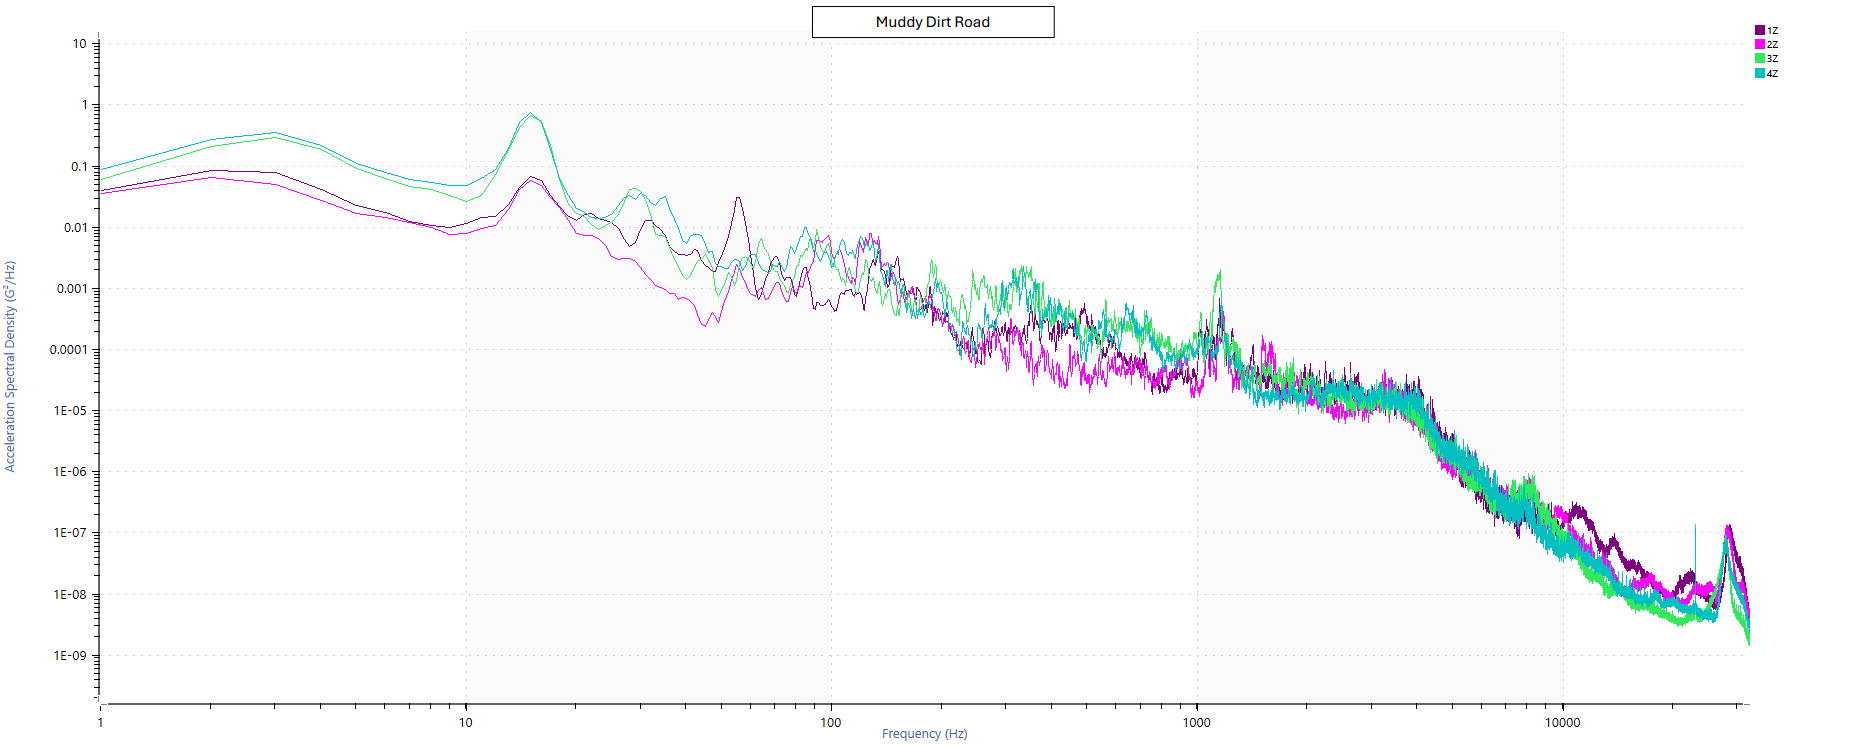
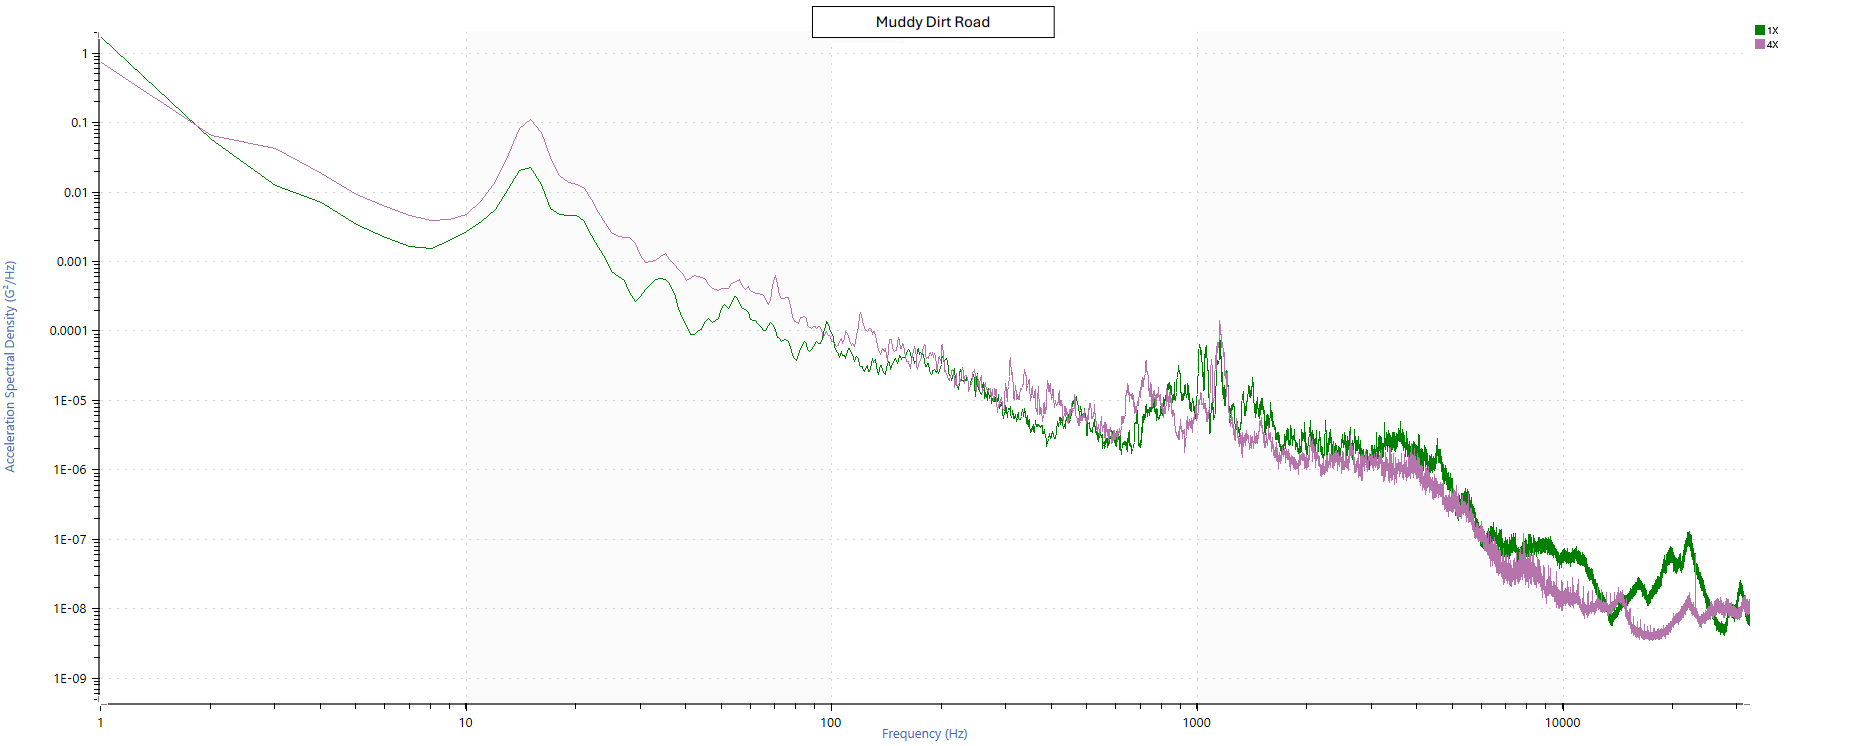
Discussion of Recorded Data
The 1X acceleration data is the for/aft direction, which is negative while increasing vehicle velocity. Channel 4X shows the lateral acceleration in which positive is acceleration to the left (left turn) and negative is acceleration to the right (right turn). The lateral acceleration values are fairly small compared to the for/aft values because most of the turns have a large turn radius. Our test data is similar to the SAE J2380 random vibration test profile, but it does not match exactly. This is likely due to the sensor placement within the cargo area instead of on the undercarriage as well as our selection of roads. We attempted to select a mixture of different types of roads, such as newly paved roads, roads with potholes, roads with older pavement, and muddy roads to make sure the data was representative of realistic driving conditions, but our selections may have led to some of the deviations from SAE J2380.