Introduction
A Vibration Research (VR) customer sought to create a repeatable test for a haptic feedback vibration motor. The motor manufacturer provided a recommended test method for measuring vibration strength, and the end-use customer required the test to meet a provided test specification. However, the peak-to-peak variation of the time-waveform vibration was often too high, and the values were inconsistent, even when the VR customer applied the same voltage and used the same test fixture and accelerometer.
The VR customer ran a pass/fail test for haptic vibration motor strength. They recorded the test data using the ObserVR1000 and analyzed the test results in ObserVIEW to improve repeatability.
Data Collection
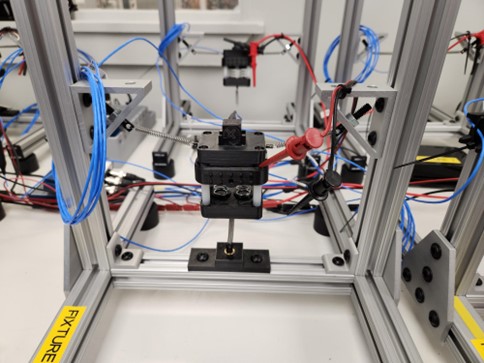
Figure 1. Test apparatus suspended by springs.
First, the VR customer ran the end-use customer-provided test with the motor in a test apparatus encased in a fixture suspended by springs (Figure 1).
They recorded test acceleration using a triaxial accelerometer, an ObserVR1000, and the ObserVIEW software (Figure 2).
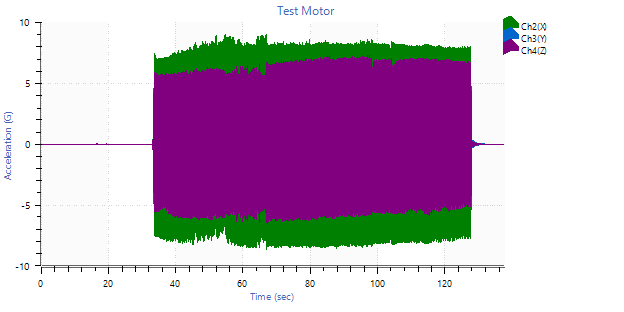
Figure 2. Test motor acceleration time waveform for the x, y, and z axes.
An analysis of a shorter time range showed high-frequency vibration in the system (Figure 3). The motor ran at a constant RPM, so VR anticipated the resulting waveform to be more sinusoidal.
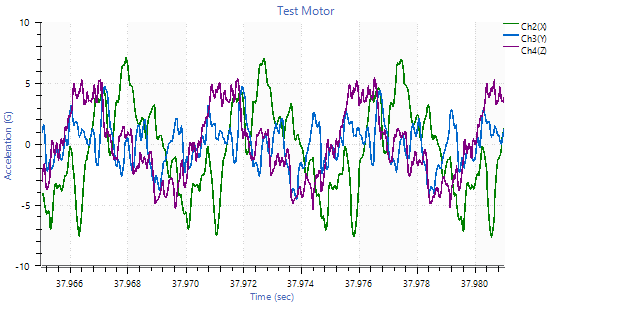
Figure 3. Close-up of Figure 2 time waveform.
Data Analysis
The end-use customer-provided test specification defined the required average RMS vibration of the vector sum over a specified time range. Figure 4 compares the motor’s average RMS and the test-specified minimum average RMS using ObserVIEW math channels.
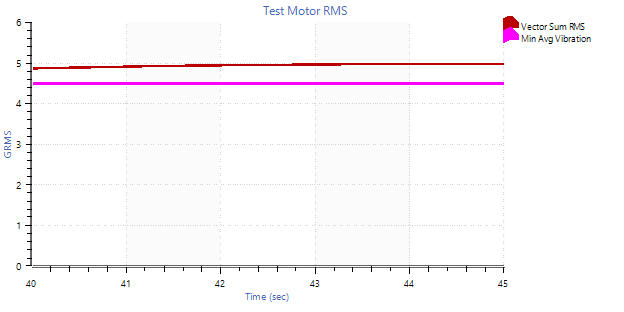
Figure 4. Motor’s average RMS (top trace, red) and minimum average RMS (bottom trace, pink).
The motor passed this specification; however, it did not pass the other test specifications, which placed maximum limits on the variation of the peak-to-peak values. The next step was to determine the cause of this variation.
Peak-to-Peak Variation
First, the VR customer reviewed the time spectrogram of the x-axis data (Figure 5).
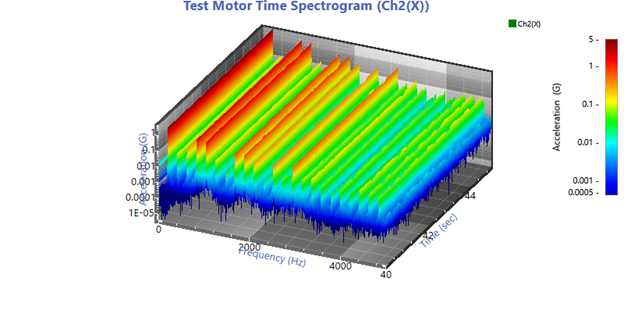
Figure 5. Time spectrogram of motor’s x-axis waveform.
Many harmonic frequencies were excited beyond the motor’s operating frequency, causing variation in the data. VR suggested that the harmonics’ high amplitudes were related to an under-damped system. The gradual increase in overall vibration during the first several seconds of the test also indicated that the system was under-damped.
Most likely, the springs holding up the motor under test stored energy from the motor and returned it to the system, causing high-frequency interference.
Solution
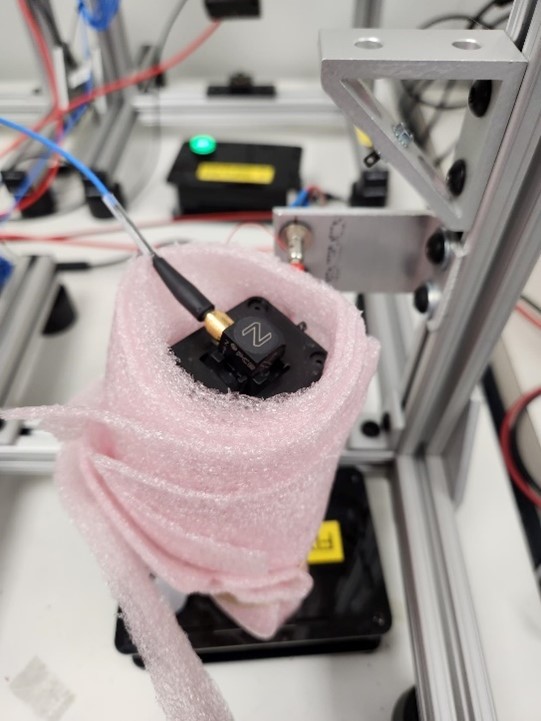
Figure 6. Foam-wrapped motor.
VR suggested adding more damping to the system. The VR customer tested this theory by wrapping the motor in foam rather than suspending it with springs and running the test again (Figure 6).
Compared to the un-damped waveform, the waveform of the foam-wrapped motor was more sinusoidal due to the reduction of high-frequency interference (Figure 7).
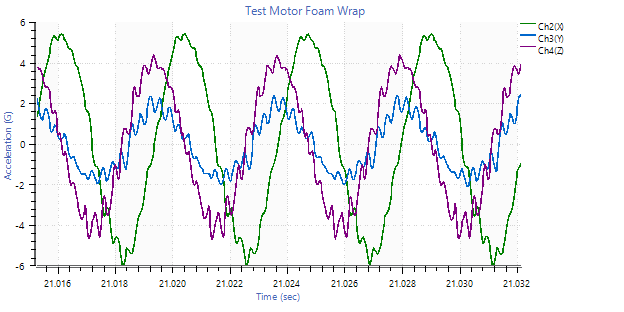
Figure 7. Close-up of foam-wrapped motor waveform.
The time spectrogram of the foam-wrapped motor supported the conclusion that the new test setup reduced the high-frequency interference (Figure 8).
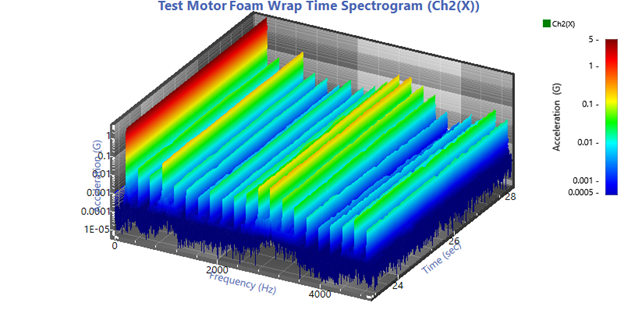
Figure 8. Time spectrogram of foam-wrapped motor.
The high-frequency harmonics beyond the base motor frequency were less prevalent than the under-damped system. Additionally, the damped system passed the test specifications provided by the customer (Figure 9). The Average RMS is above the minimum, thus passing the specification.
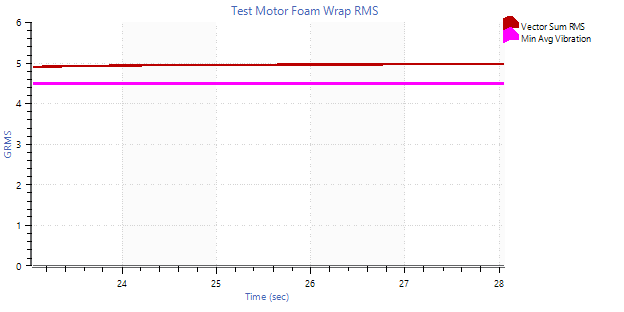
Figure 9. Motor’s average RMS (top trace, red) and minimum average RMS (bottom trace, pink).
VR concluded that the new test setup would lead to a more repeatable test.
Peak-to-peak Variation
VR also suggested that the peak-to-peak variation test was not the customer’s best option. Assuming the test’s purpose was to ensure that the motor’s operating RPM made up a sufficient amount of the waveform, VR recommended using a power spectral density (PSD) graph to inspect the vibration waveform.
PSD Graph
The current test method was prone to error because it attempted to quantify dynamic vibration exclusively with time-waveform sample readings. Transforming data to the frequency domain is the best practice for dynamic signal quantification. A PSD graph gives a more accurate picture of the frequency domain while preserving the data’s RMS.
Engineers can use two metrics to test the PSD:
- First peak’s frequency
- First peak’s RMS contribution to the total RMS
First Peak Frequency
The first peak’s frequency corresponds to the operating RPM of the haptic motor. Figure 10 displays the first peak frequency of the PSDs for the damped and undamped systems. A maximum (‘max’) cursor identified the frequencies of the first peaks.
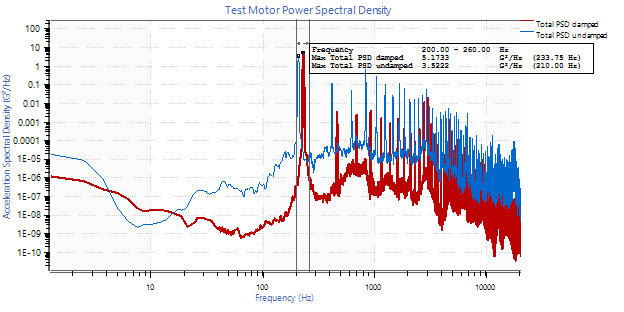
Figure 10. The sum of the three axes’ PSDs for the damped (red trace) and undamped (blue trace) systems.
A potential test for the first peak frequency could define the acceptable frequency range for the peak.
First Peak RMS Contribution
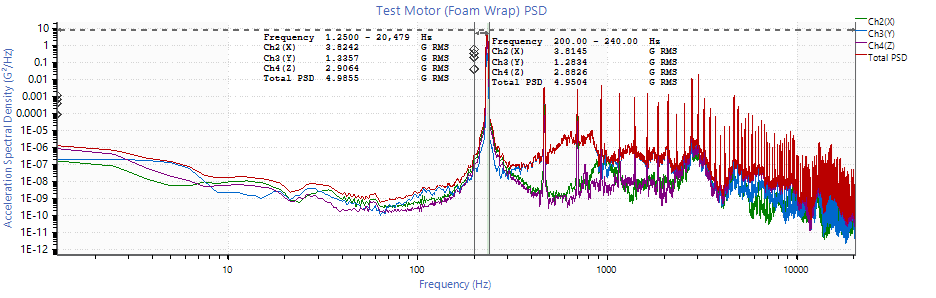
The first peak’s RMS contribution is significant because most of the system’s energy should come from the operating RPM of the haptic motor (Figure 11).
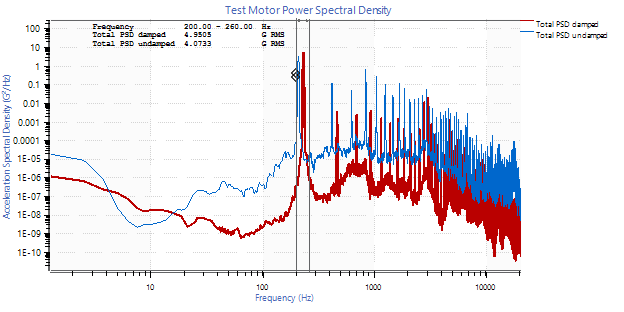
Figure 11. PSDs for the damped (red trace) and undamped (blue trace) systems. An RMS cursor indicates the total gRMS for the first peaks.
A potential test for the RMS contribution of the PSD’s first peak could define a minimum percentage that the first peak must make up of the total RMS.
Conclusion
The current test apparatus was underdamped. VR recommended that the customer encase and secure the motor in a damping material such as foam instead of using springs to suspend it in the test apparatus.
If the goal of the peak-to-peak variation test was to test the signal’s frequency content, then VR recommended using PSD data, specifically the first peak’s frequency and RMS contribution. These changes will result in a more repeatable test for the haptic motors. Additionally, by monitoring the motor’s operating frequency, the VR customer can require operation in the expected RPM range to produce a consistent tactile vibration feel.
Featured Software

Math Traces

Advanced Analysis