Predict a product’s life expectancy through accelerated testing
Use recorded data to create an accelerated random test that represents a lifetime of fatigue damage. You set the configurable parameters, and the FDS software handles the rest. With one click, you can control a new test profile on a shaker system.
Vibration Research’s innovative FDS software reduces test time from analysis to control.
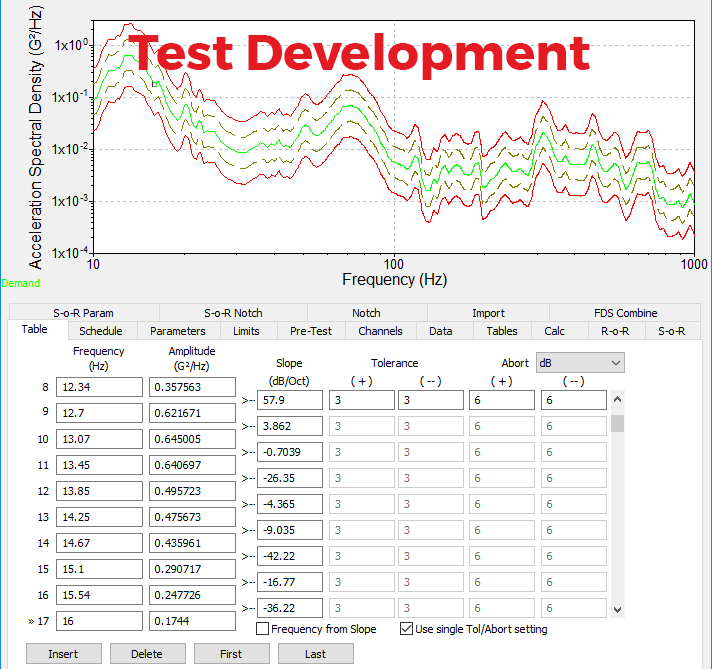
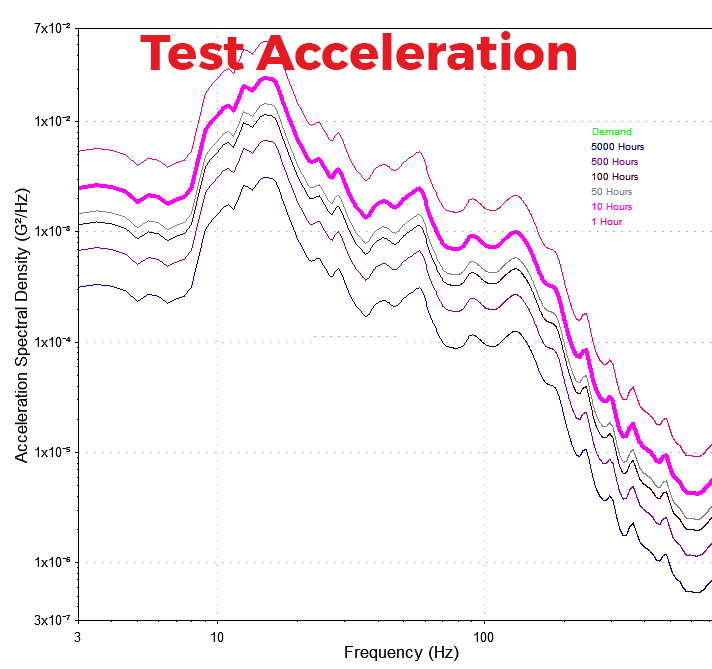
Set the target life based on product specifications and the test duration and define the slope of the s/n curve and quality factor (Q). The software automatically calculates the correct ratios to produce the same fatigue damage in a user-defined test duration.
FDS Software Features
Calculation in the time domain (not frequency) to account for real-world kurtosis
Displays peak acceleration, velocity, displacement, and kurtosis to quickly determine waveform statistics
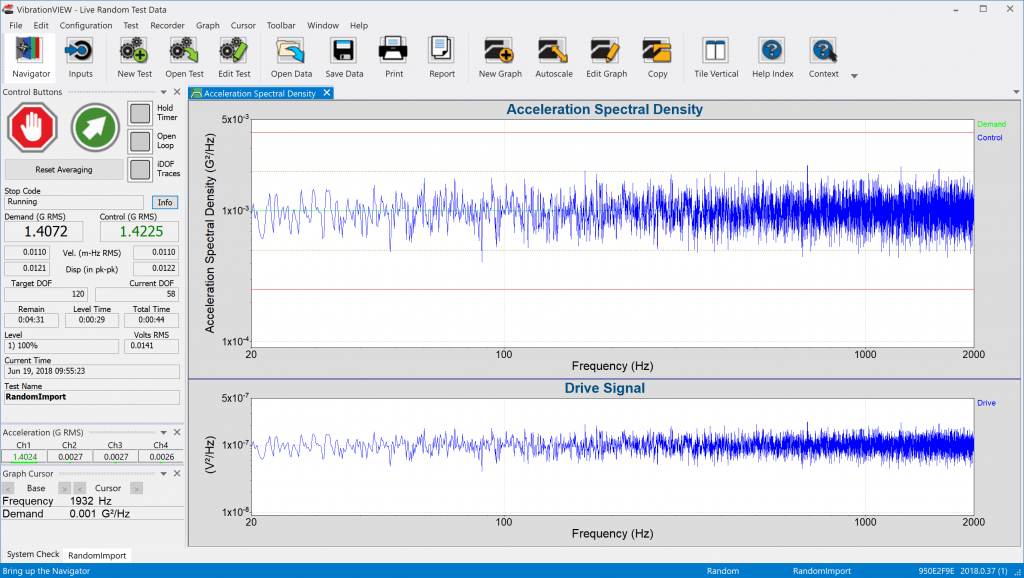
Includes Random Import (VR9204) to compare methods of random profile generation
With one mouse click, control the newly created test profile on a shaker system within VibrationVIEW. Move from a time waveform to a breakpoint profile and control the test all in one program.
Combine Multiple Waveforms
Create a random PSD profile that includes multiple input time-history files. Files can be weighted individually by time or cycles to create a total target life for the product. Combine methods include sum, envelope, or per-file envelope.
The software uses the same m, Q, and frequency range when combining data to create an equal relationship between each imported file. The output PSD will be the damage equivalent of the imported files and is generated from the target life for each waveform and the FDS settings.
Display profile statistics
Enable Kurtosion®
Export data to a .csv or .txt file, including damage vs. frequency and file statistics for each FDS
Create a breakpoint table
Copy-and-paste the FDS list to a spreadsheet program such as Microsoft Excel®
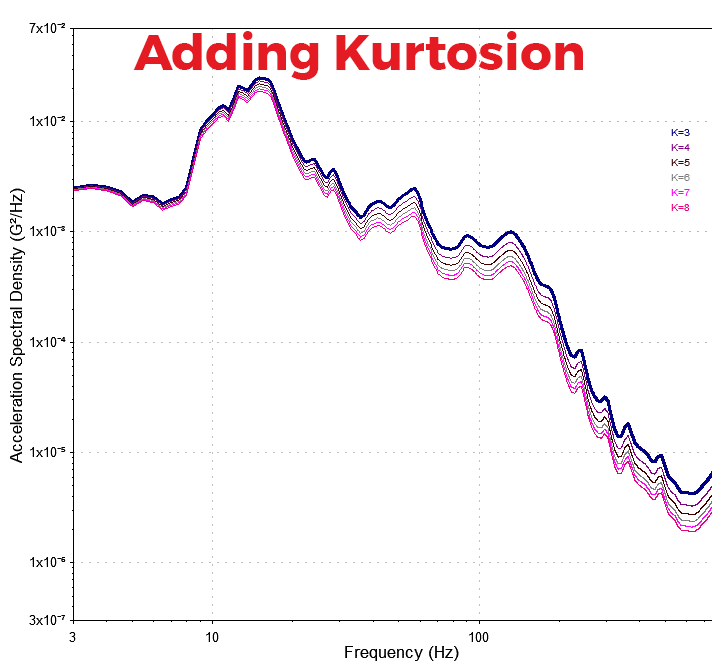
Patented Kurtosis Control
The greatest damage potential is typically at peak acceleration levels. When the kurtosis value of a vibration signal is increased, the time spent at peak levels also increases. With kurtosis control, your test will better reflect what occurs in the real world.
Vibration Research’s patented kurtosis control, Kurtosion®, spreads damage over the fatigue damage spectrum rather than adding it to high frequencies only. Increasing just the kurtosis parameter will increase the damage experienced at higher frequencies, but a transition frequency parameter allows an adjustment to where the damage is placed.
What is the FDS?
The Fatigue Damage Spectrum software is a test development tool that replicates the operational environment of a product. It is used to create an accelerated random test using real-world data. The resulting test is the damage equivalent to a product’s lifespan.
For test purposes, the software can convert the FDS into a power spectral density (PSD) using Henderson-Piersol’s potential damage spectrum. The result is a single PSD profile for multiple time-history files. The FDS-correlated PSD is a cumulative spectrum that represents the relative damage experienced by the product for all the combined and weighted environments.
VR Papers and Presentations (PDF)
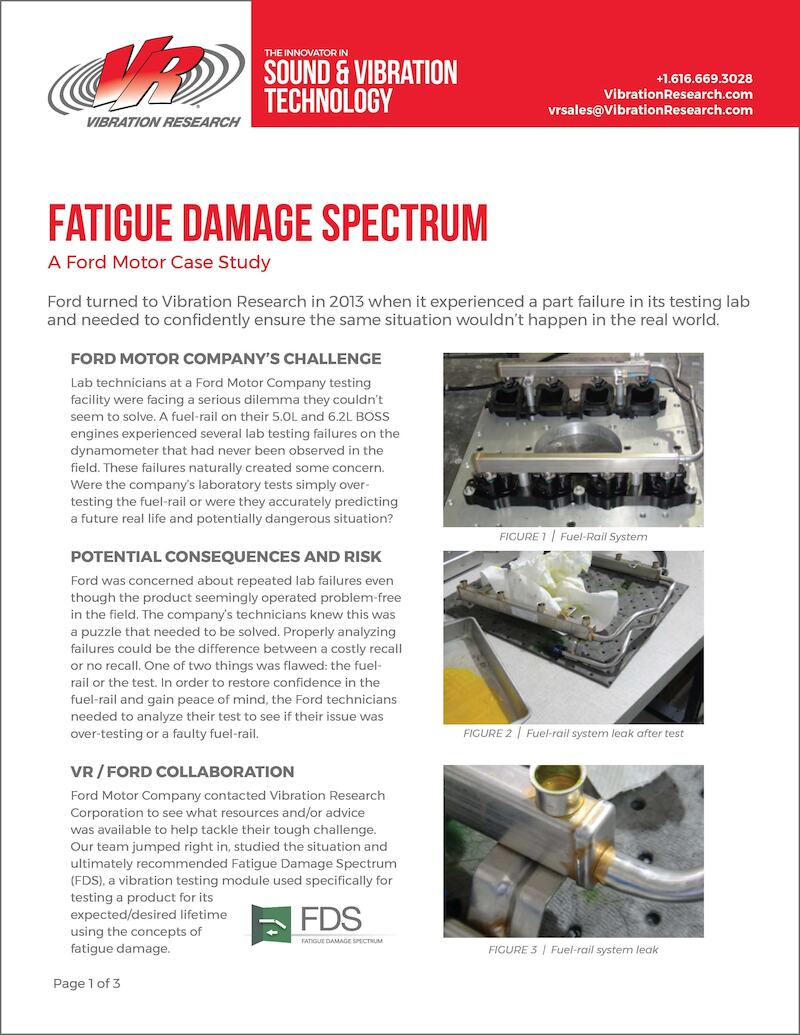
Ford Case Study
Ford Motor Company and Vibration Research teamed up to solve a unique product development and vibration testing challenge. Download the case study to learn about:
Ford Motor Company’s test scenario and concern
Vibration Research’s proposed testing method: the Fatigue Damage Spectrum (FDS)
How the FDS software solved Ford’s testing challenge
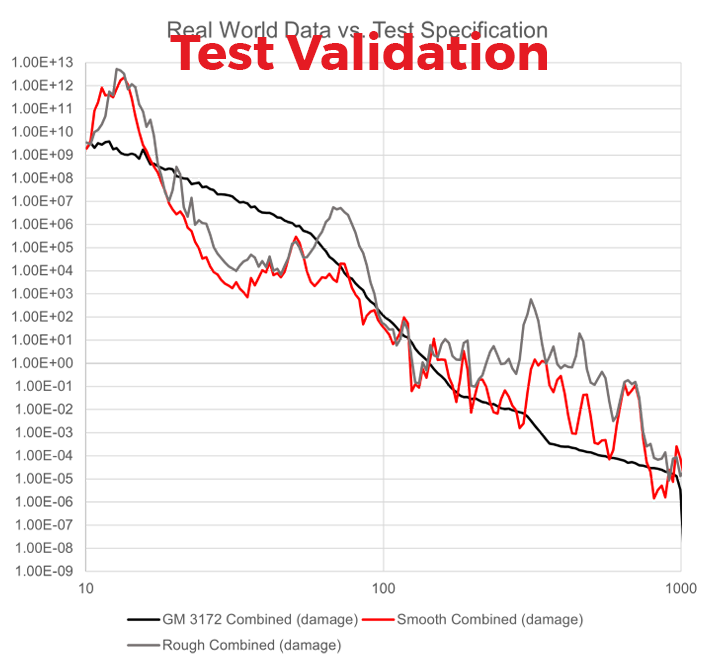
With the FDS software, engineers can create a random test profile that is the damage equivalent to weighted time-history files from the product’s end-use environment. They can also compare multiple test failures, compare specifications to real-world data, and determine if current testing is valid (or over/under-testing).
If you’re asking these questions, you need FDS
What is the best random test to simulate my product’s environment?
How long should I be running my random test?
Can I accelerate my random test?
Applications
GM Case Study & Video Series
Accelerated Testing with Correlation to End-Use Environment
General Motors used the VibrationVIEW FDS software to answer the following questions:
What random test profile and test duration do we need to accurately simulate the end-use environment over the life-cycle of the product?
How can we combine different vibration environments into one test profile?
Analyzing data is the first step in producing a fatigue curve. First, we took field data from an engine run-up and reviewed it in the VibrationVIEW software.
Video 2 of 3
GM Case Study - FDS - Part 2
Next, we transformed the recorded data into a random PSD curve and compared the average method to our Fatigue Damage Spectrum method. We also measured kurtosis for consideration in the FDS transformation.
Video 3 of 3
GM Case Study - FDS - Part 3
Lastly, we used FDS to address the age-old question: is random or sine testing more severe?
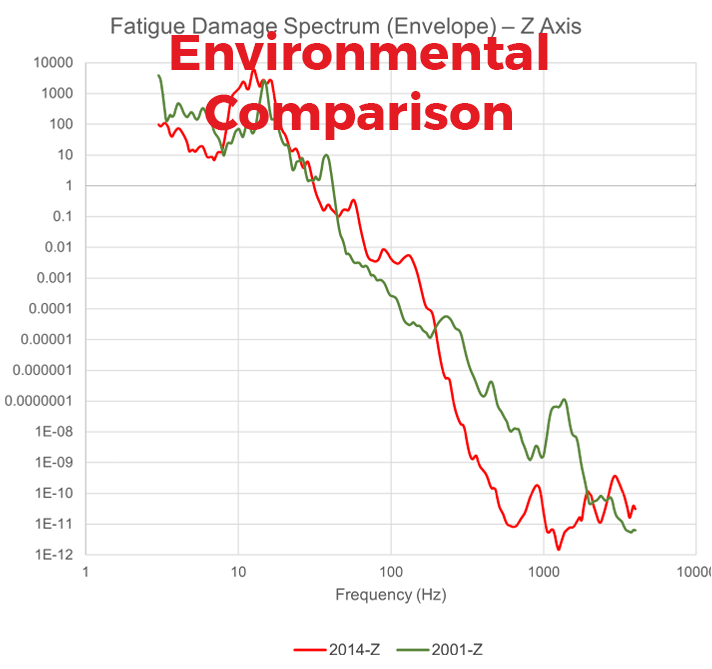
Comparison of Ford Mustang Data
Engineers can use the FDS to compare dynamic environments and determine which is more damaging.
After comparing two field data recordings, the Vibration Research team found that the FDS is a valid method for determining the dynamic conditions of the two environments and their relationship to one another, so long as the resonance of the test item is known.

 General Motors used the VibrationVIEW FDS software to answer the following questions: