Question
Could you explain how to use the Q-factor and the difference between it and transmissibility? Which do I use to calculate the damping of a device under test?
Answer
How to Use the Q-factor
Each system has a Q-factor dependent on its construction. In sine vibration testing, the Q-factor relates to the sharpness of a resonance. Resonance occurs when the drive frequency of the sine test profile equals the test item’s natural frequency, which amplifies the frequency to a potentially damaging level. The resonance’s sharpness is determined by the ratio of its center frequency and half-power bandwidth.
(1) 
- A higher Q-factor relates to a narrower bandwidth and a sharper resonance
- A lower Q-factor relates to a wider bandwidth and a less sharp resonance
Sharp resonances resonate quicker during a sine sweep and are more difficult to control. Engineers can use the Q-factor to help set up or troubleshoot a sine test with high-Q resonances and adjust parameters within the software to address them. For more details about controlling high-Q resonances, read the blog “Four Characteristics of High-Q Resonances.”
Resonance Response Time
The Q-factor also relates to a resonance’s response time. Resonance with a low Q value covers a wider range of frequencies and has a faster response time, meaning the resonance responds faster to changes in amplitude. A product with a high-Q resonance typically has a longer response time, meaning it will take longer to see an effect at the response location when the input amplitude changes.
The demand response time should be slower than the resonance. We can calculate the expected response time for a resonance with a frequency-to-time equation.
(2) 
Calculating Resonance Damping
Thirdly, the Q-factor can represent the damping of resonance.
(3) 
Zeta (ζ) is the damping ratio. The VibrationVIEW software can automatically calculate the damping of a resonance. Under Configuration > Parameters, the user can set the resonance cursor annotation to Q-factor, Damping, or Both using the “Display Resonance using:” drop-down list.
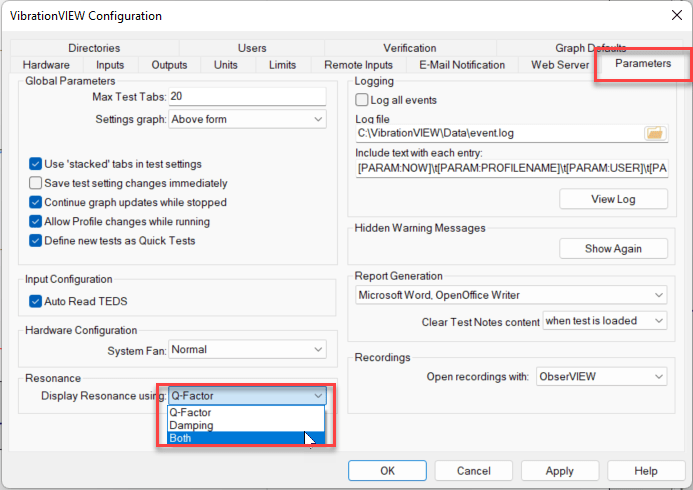
Option to display resonance as damping in VibrationVIEW.
Difference between Q-factor and Transmissibility
Transmissibility is an amplitude ratio between two channels. When analyzing resonance, it provides the ratio of amplification between the output and input at a set frequency value. For example, the transmissibility value in the graph below is 5. When the user inputs 1G, they can expect a 5G output. If they input 10G, they can expect a 50G output.
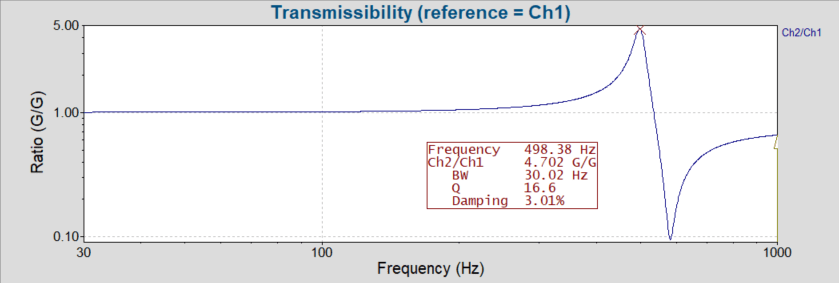
Transmissibility helps to answer how much greater the resonance’s acceleration is compared to the excitation.
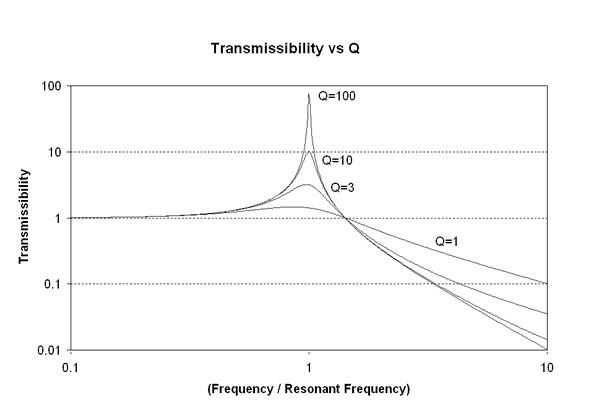
Transmissibility can be graphed as a function of the Q-factor and frequency. Peak transmissibility is approximately equal to Q when the frequency and resonant frequency are equal and Q > 2.