University and vocational students nationwide are partnering to take on the three-year Battery Workforce Challenge collegiate competition. Sponsored by the U.S. Department of Energy, this challenge gives students the opportunity to gain hands-on experience in battery design outside of the traditional engineering curriculum. Vibration Research is committed to supporting the next generation of engineers by providing participants with testing solutions that ensure battery durability and safety in real-world conditions.
The following is the culmination of the students’ first year of work, which is provided here for educational purposes only.
Introduction
The objective of this task is to create real-world vibrational data under varying road and driving conditions using various sensors in order to understand the forces faced by an electric vehicle battery pack. This was performed by placing a series of tri-axial accelerometers on the underside of the Dodge Promaster EV’s chassis, and collecting their output while driving at varying speeds, over varying road surfaces. The data collected from these accelerometers were converted into a power spectral density (PSD) form and compared to a standard SAE 2380 profile. The purpose of these tests is to determine how experimental vibration profiles translate to real-world driving conditions.Note that vibrational data was provided by RHIT.
Underbody Sensor Placement
As the sensor data was provided by RHIT, the McMaster Battery Workforce Challenge team did not directly choose sensor placement locations. With that said, if we were to place them, optimal locations for accelerometer mounting include battery mounting structures, suspension mounting points, and the center of the chassis. This would give an ideal display of the forces felt by various components of interest. All accelerometers were place with a consistent orientation, ensuring data collected is comparable between sensors.
Vehicle Drive Plan
In order to obtain suitable data showcasing the forces felt by the vehicle under varying conditions, the vehicle was driven on a number of surfaces at varying speeds. The specific conditions which the vehicle was driven on are described below. Note that these tests were not performed directly by the McMaster Battery Workforce Challenge team, with the driving conditions described below provided and performed by RHIT.
Test 1 – Smooth Road Driving
Represents typical paved road conditions with minimal surface irregularities, resulting in low-amplitude vibrations.
Test 2 – Rough Road Driving
Includes highly irregular surfaces such as train tracks, potholes, and degraded pavement, producing significant vibration inputs.
Test 3 – City Driving
Characterized by frequent acceleration, braking, and turning, simulating stop-and-go urban traffic conditions.
Test 4 – Highway Driving
Involves sustained higher speeds on relatively smooth surfaces, generating steady, low-to-moderate vibration levels.
Test 5 – Suburban Driving with Mild Elevation Changes
Similar to smooth road conditions but incorporates gradual slopes and typical suburban road features.
Test 6 – Gravel and Poorly Maintained Roads
Consists of loose surfaces, potholes, and uneven terrain, leading to high-intensity and irregular vibration exposure.
Test 7 – Hills and Suburban Mixed Driving
Combines moderate elevation changes with suburban road conditions, resulting in intermediate vibration levels.
The collected vibration data was used to form assumptions about vehicle durability by relating real-world driving conditions to fatigue loading. It was assumed that the range of tests—from smooth and highway driving to rough and gravel roads— captures the spectrum of vibration inputs experienced during typical vehicle operation. High-severity events such as potholes and uneven terrain were considered the primary contributors to fatigue damage, while lower-intensity conditions contribute through prolonged exposure. To approximate long-term durability within a limited test duration, repeated exposure to these conditions was assumed to produce similar effects to extended laboratory testing such as SAE J2380. The specific sampling rate used within the data recorded is reported at 65536Hz, adequately capturing all necessary data while remaining within the Nyquist limit.
Plots
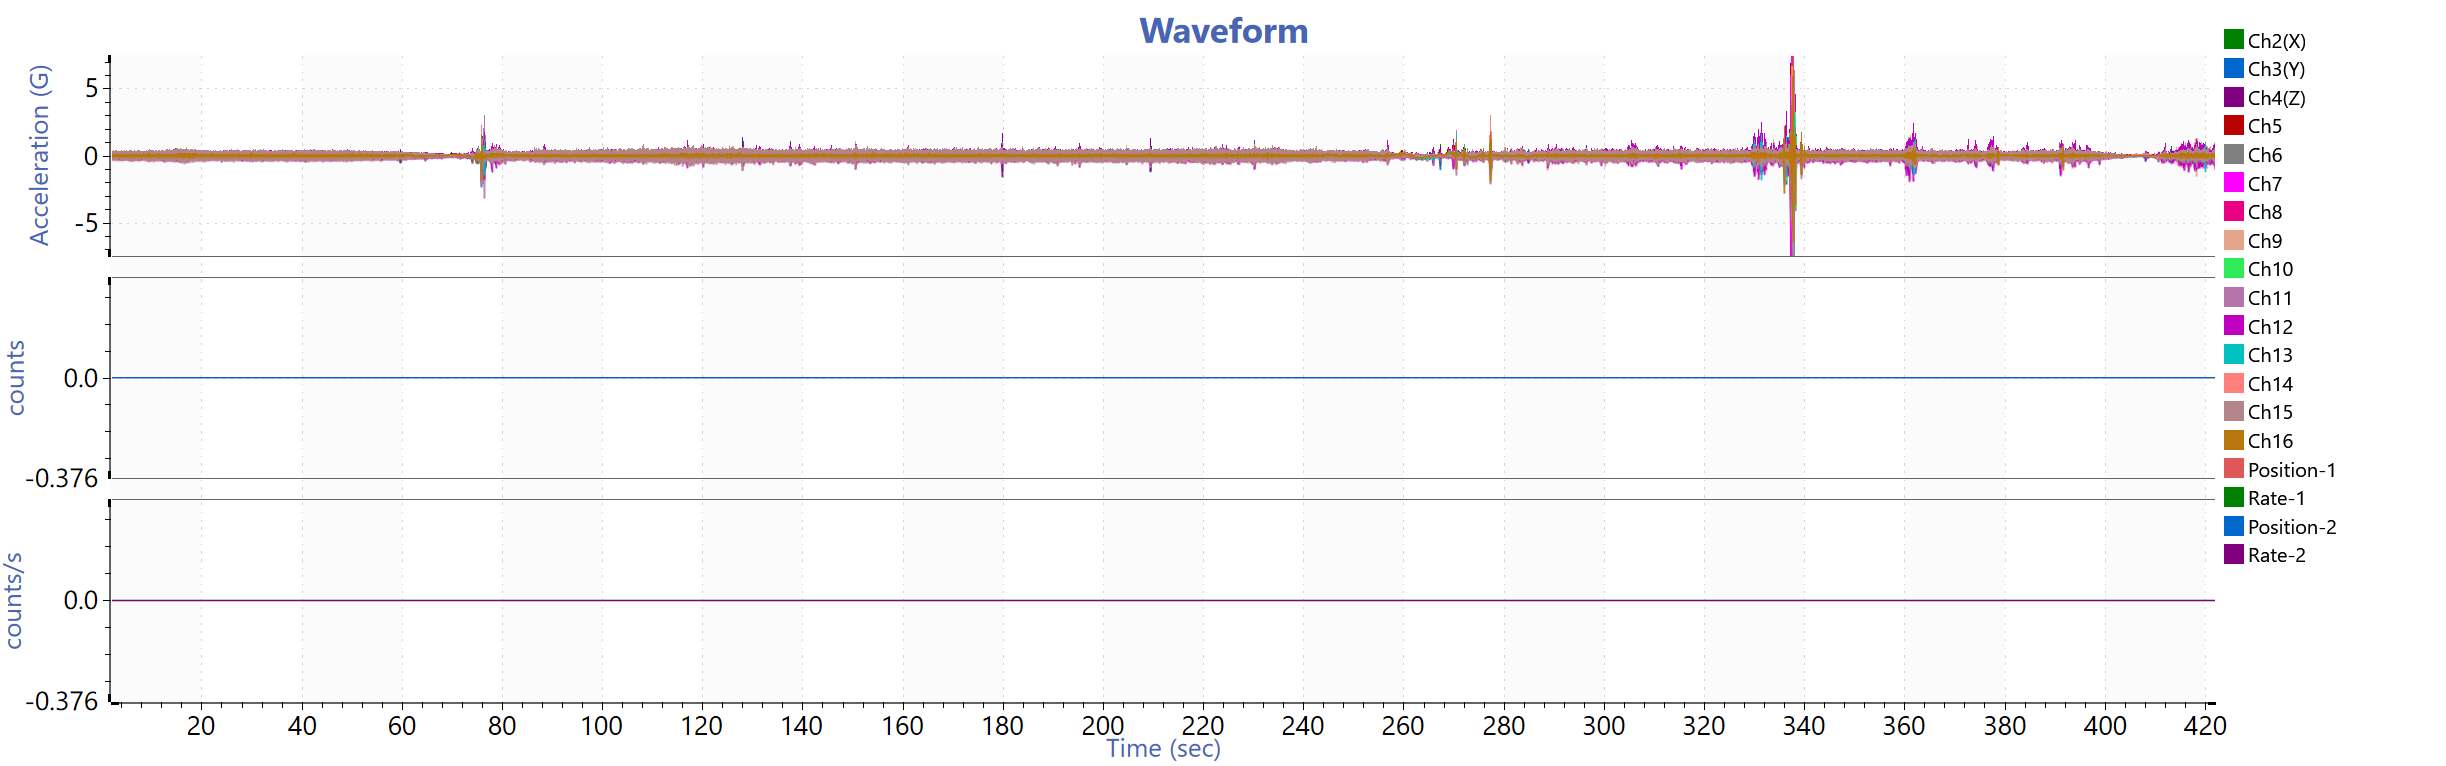
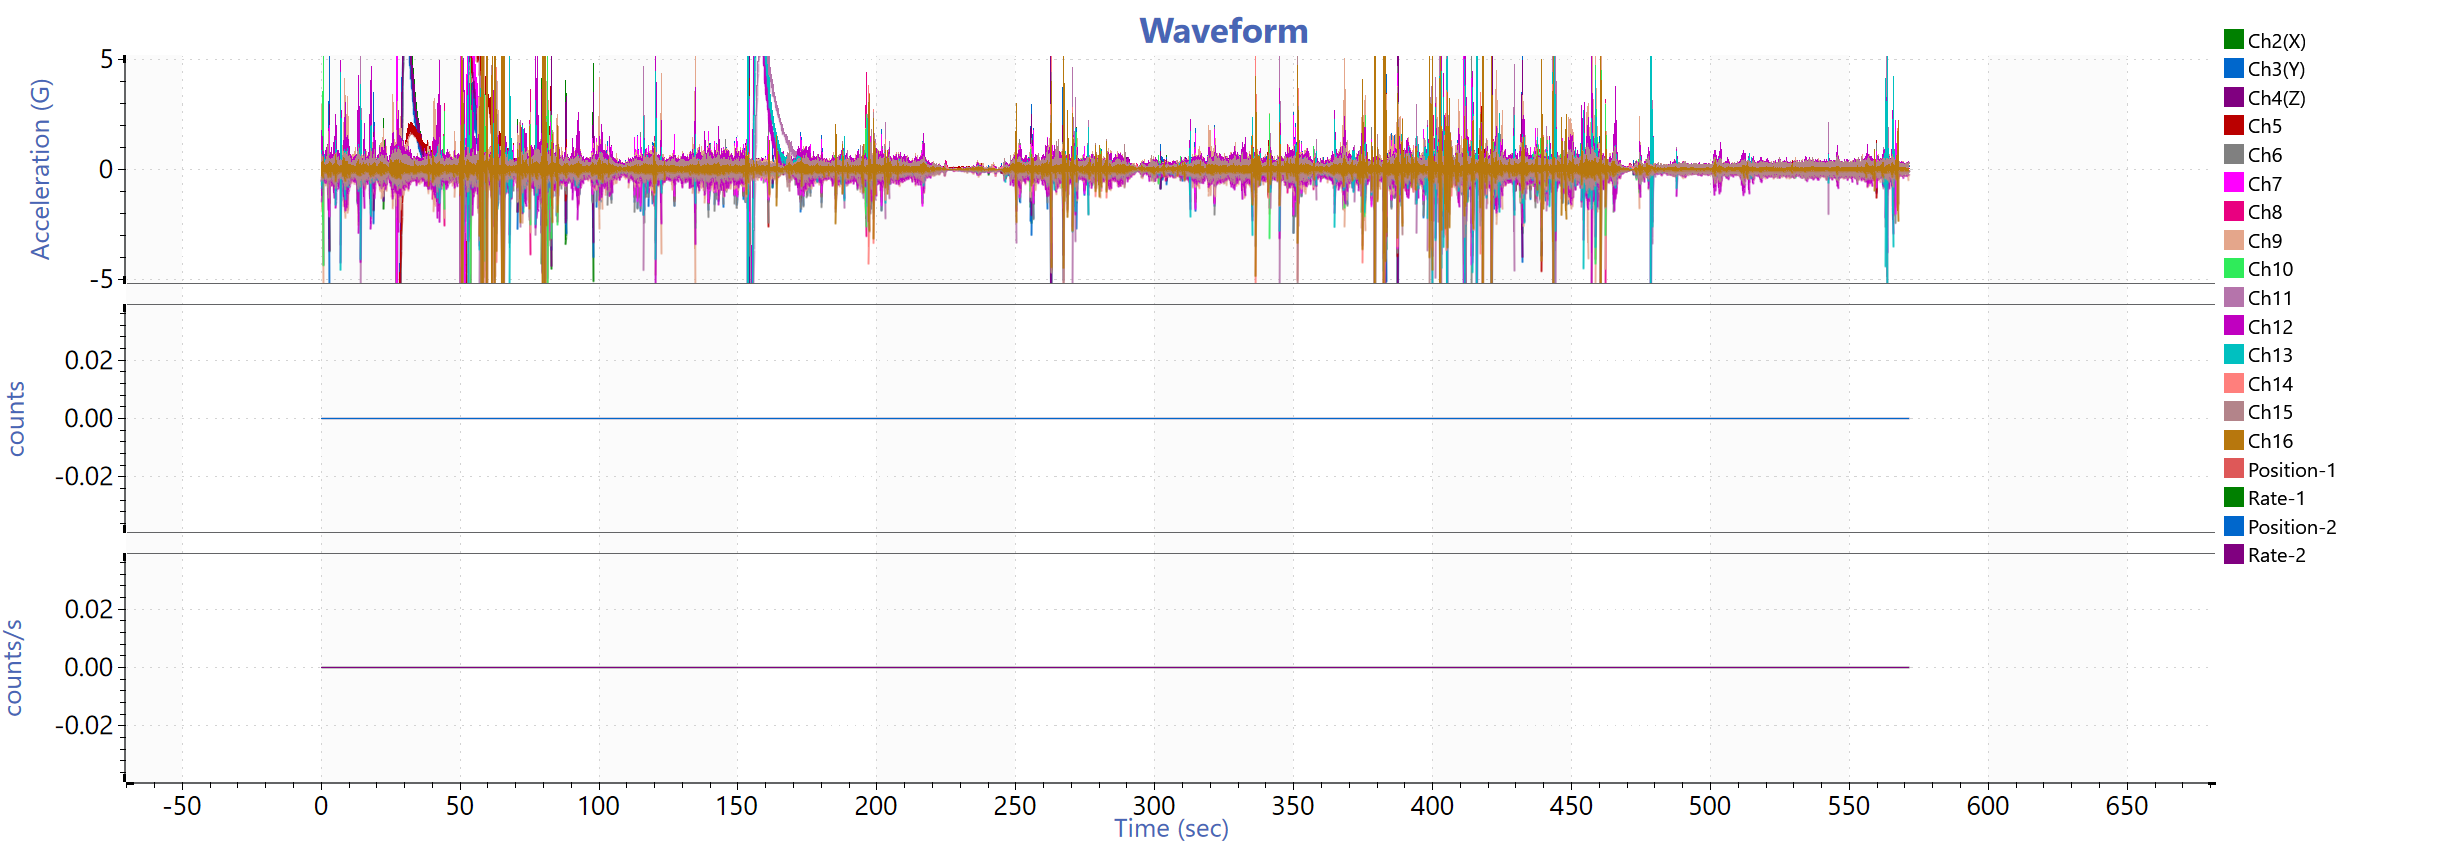
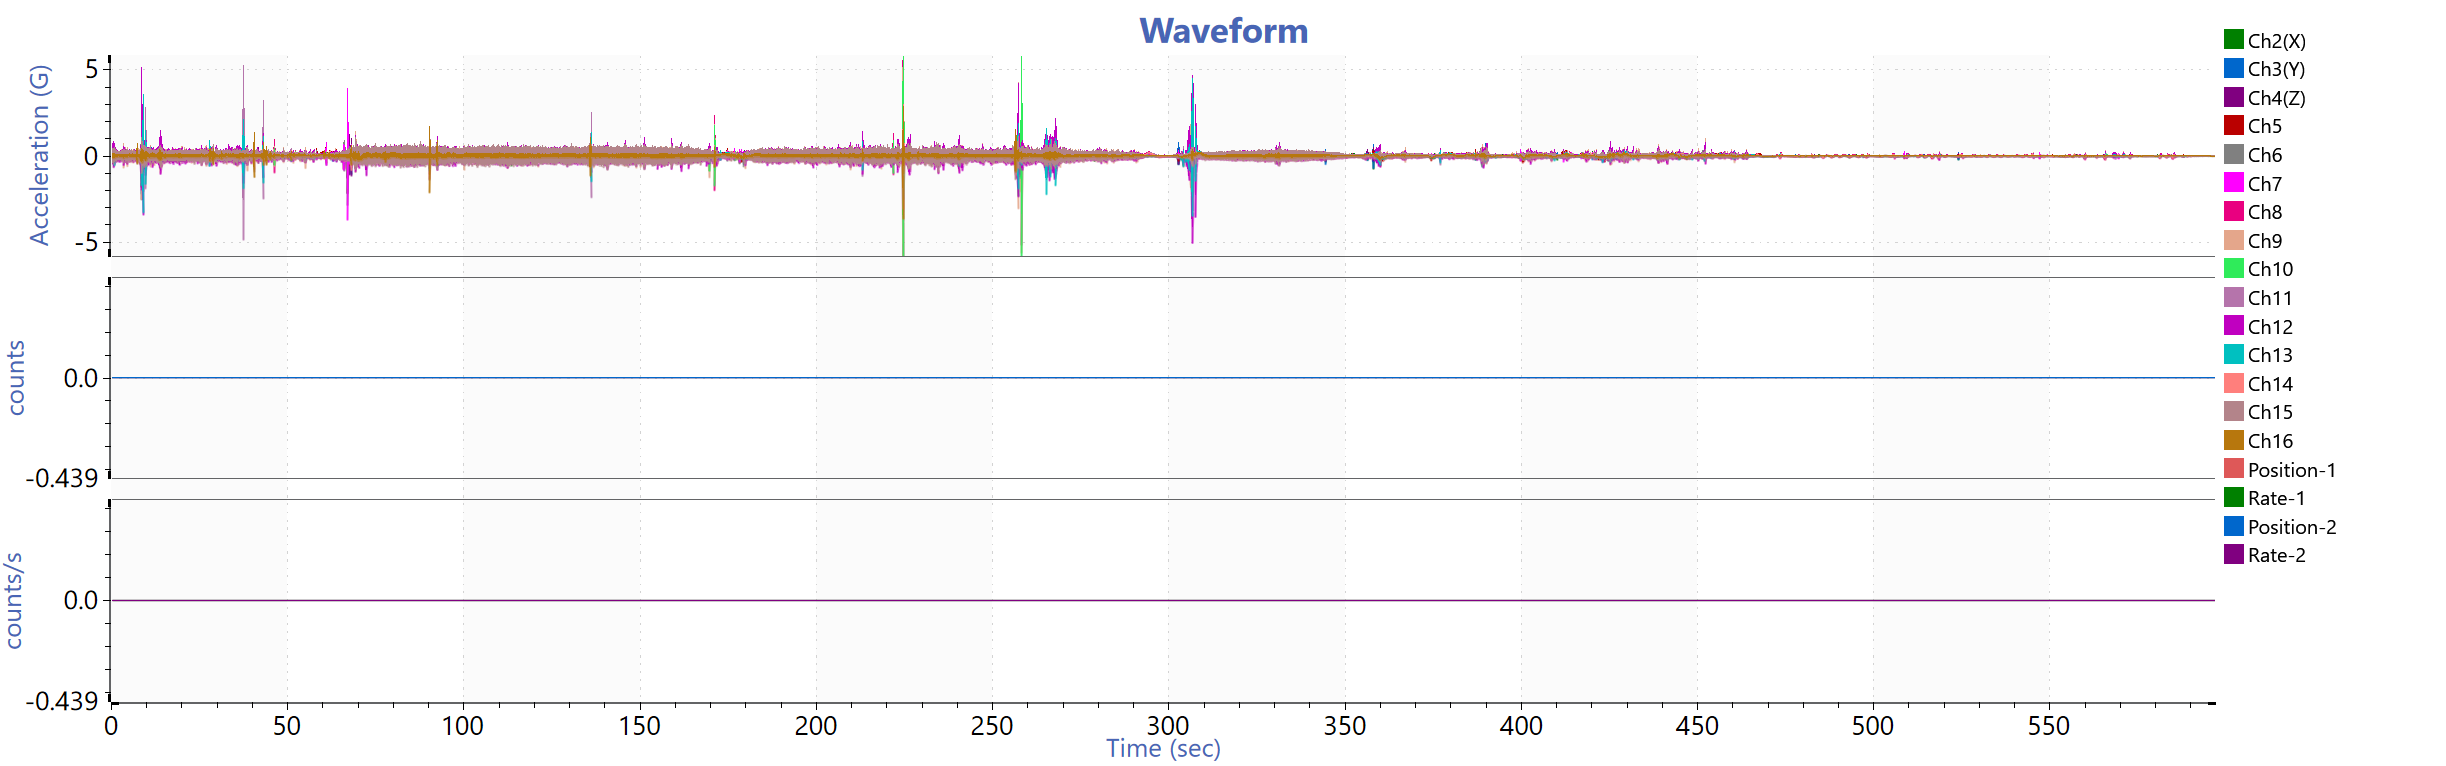
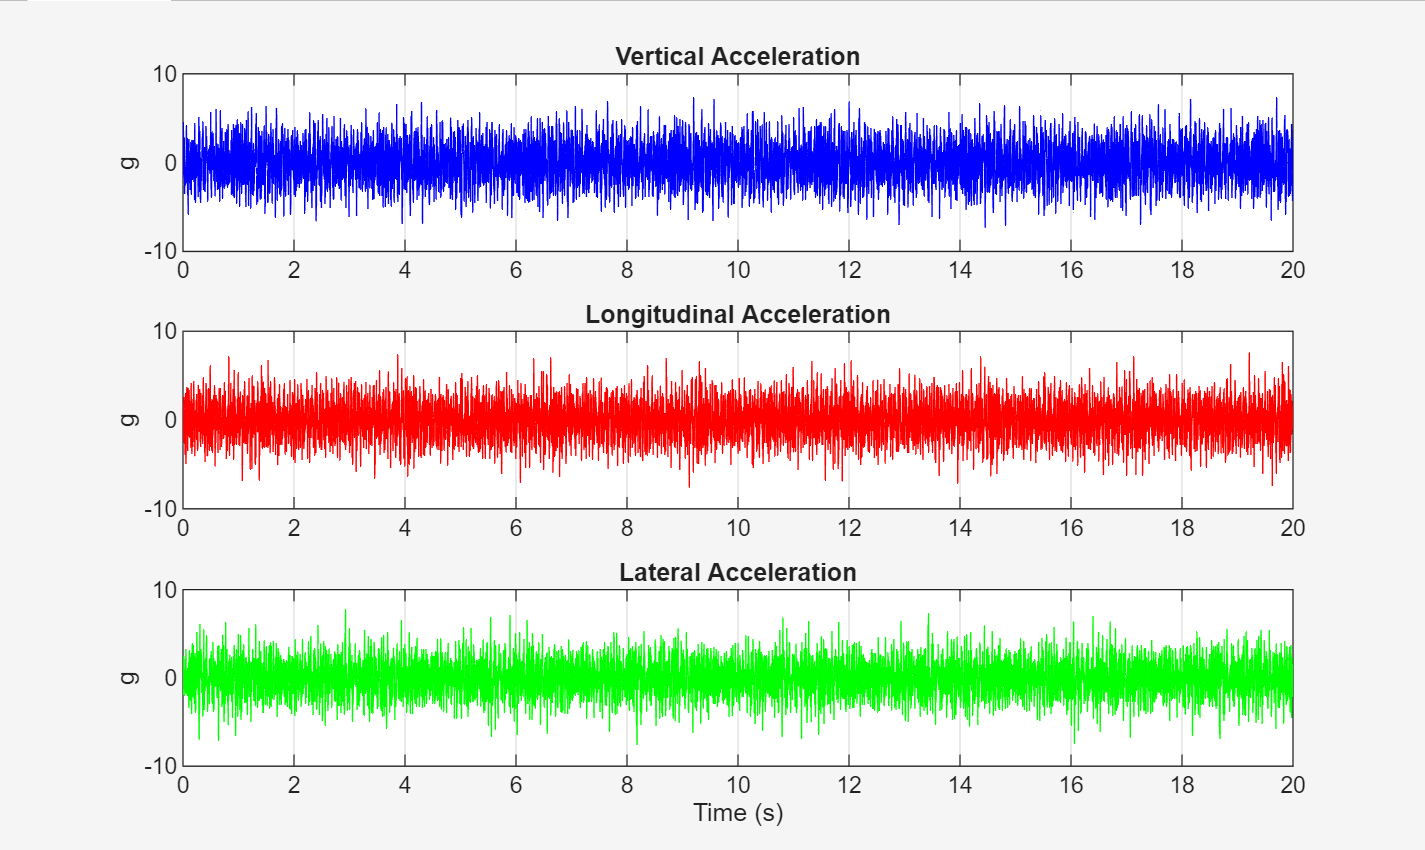
Below are the plotted results of the various drive tests performed.
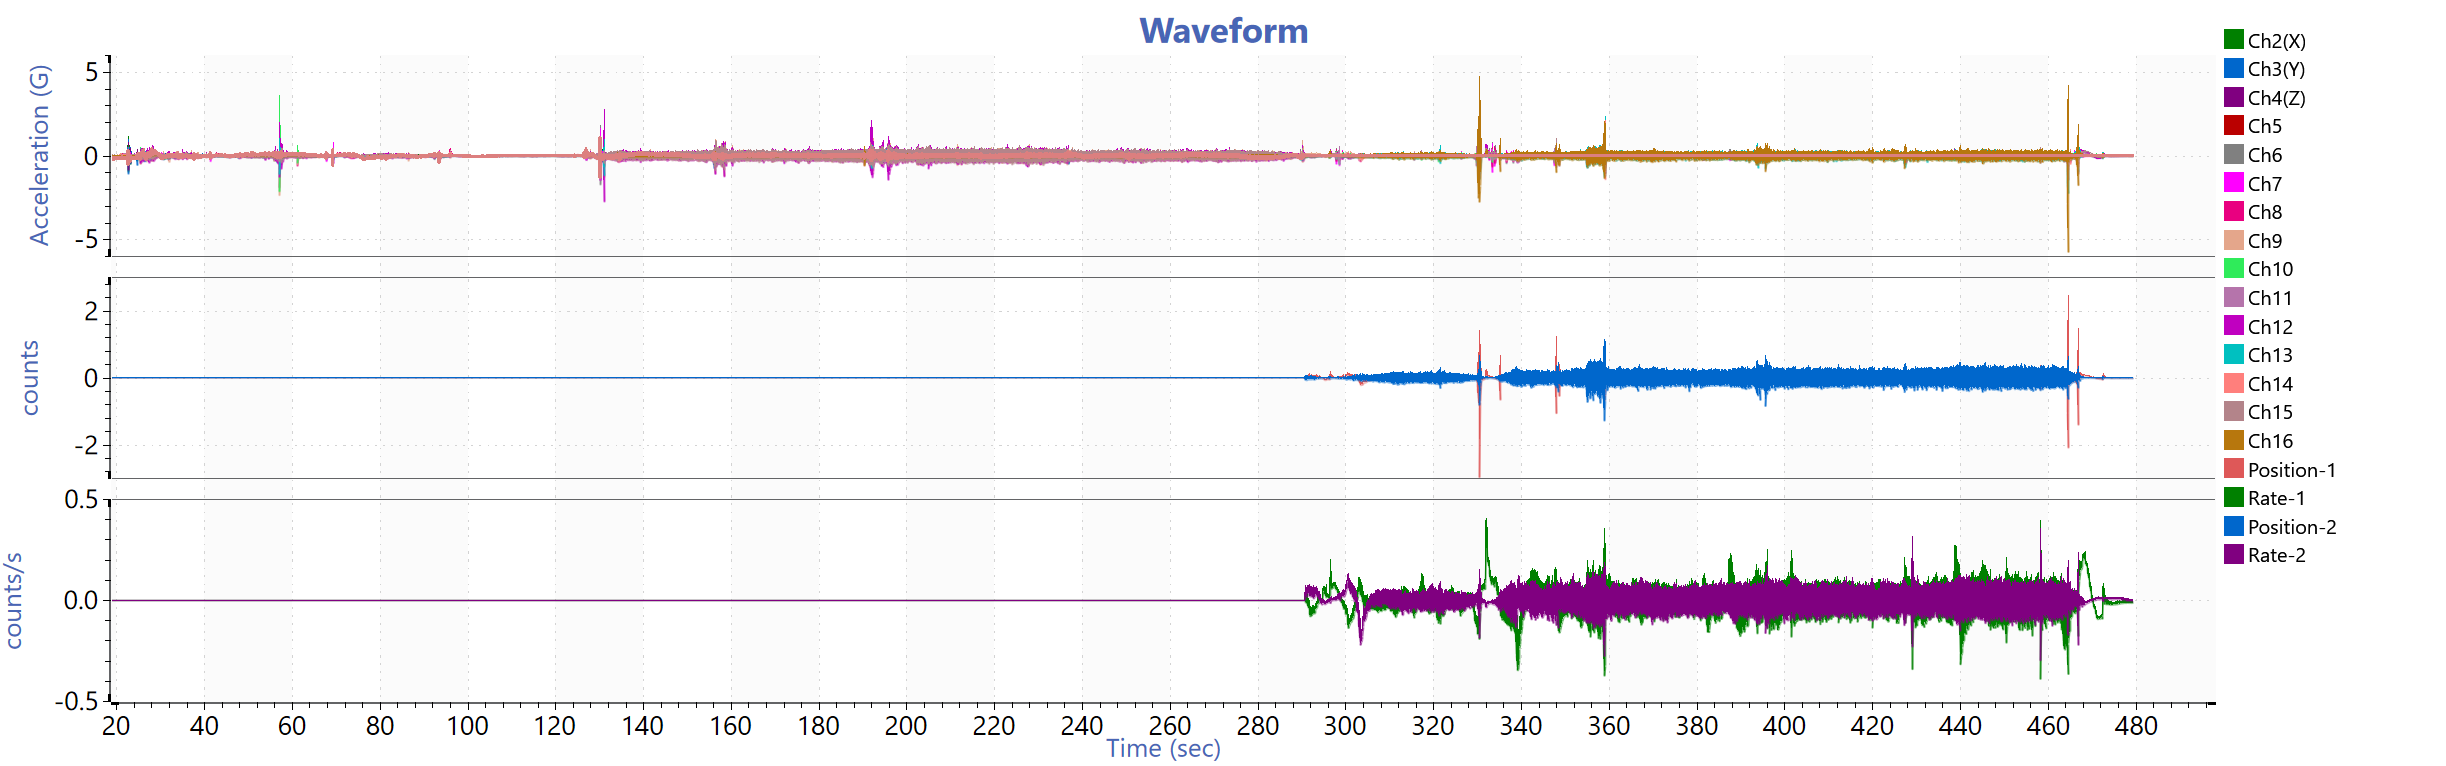
P1 Drive Test
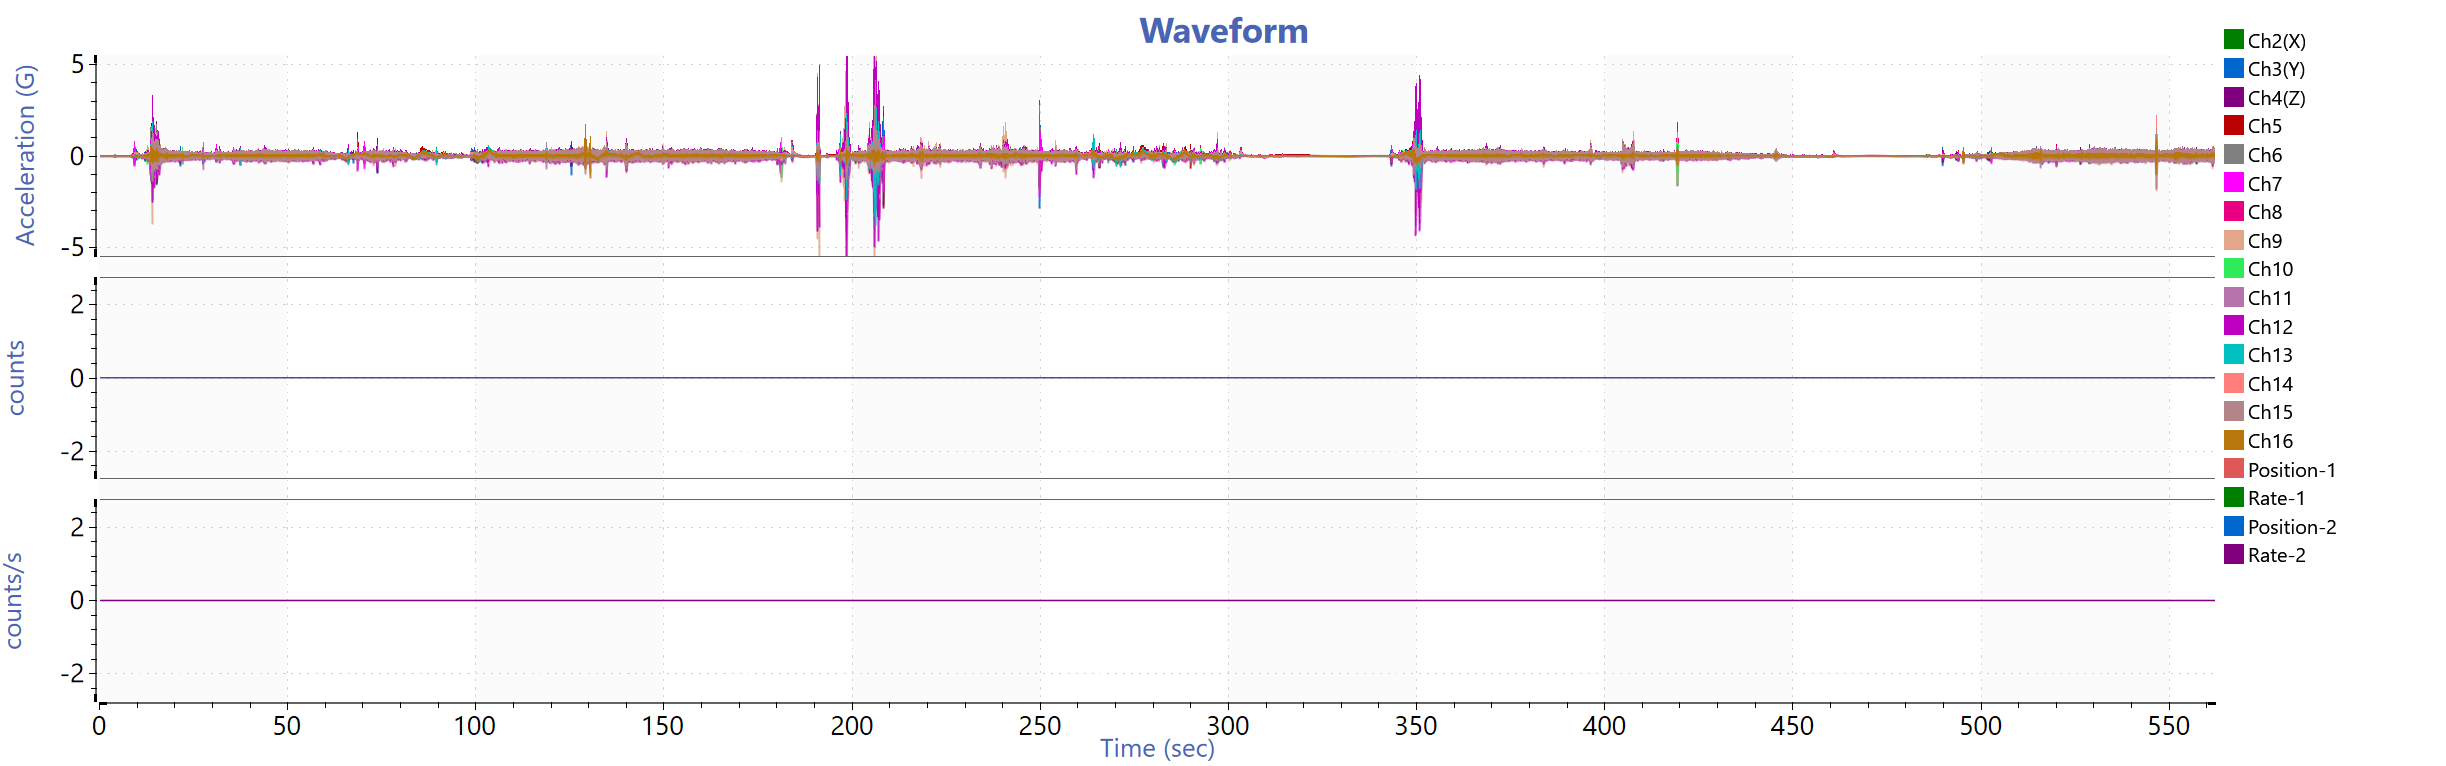
P2 Drive Test
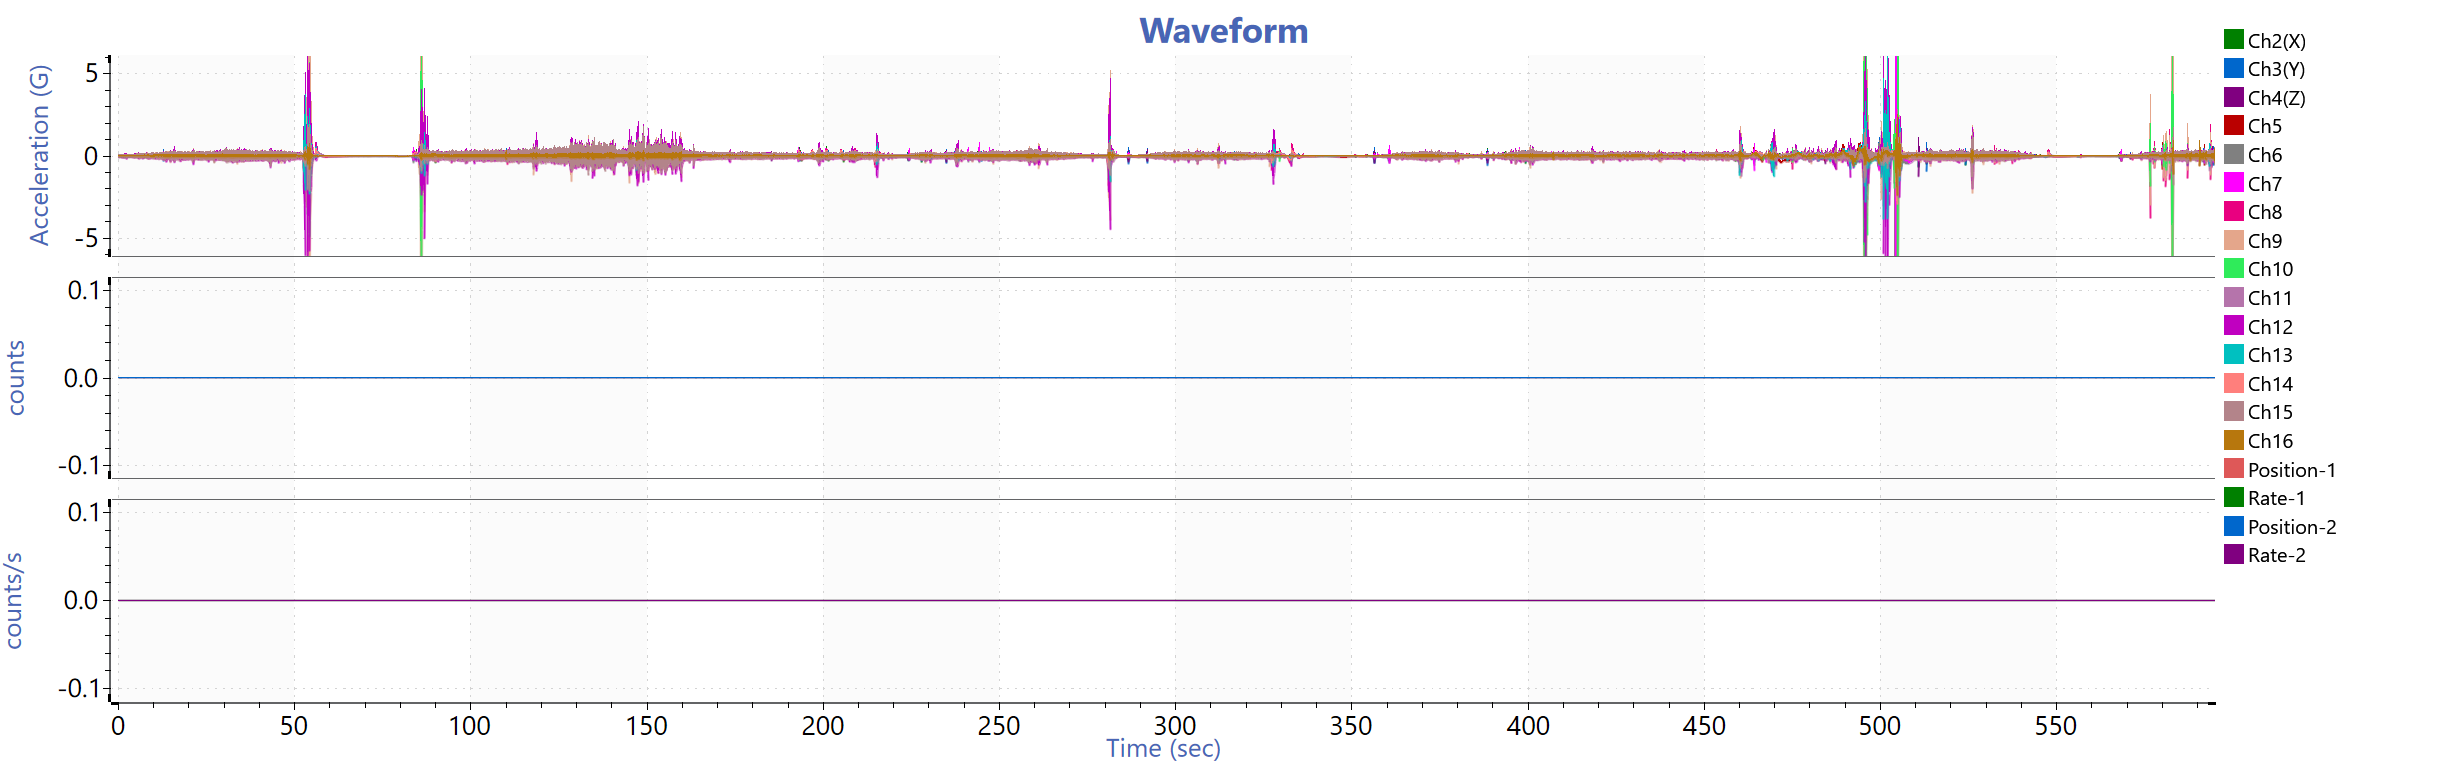
P3 Drive Test
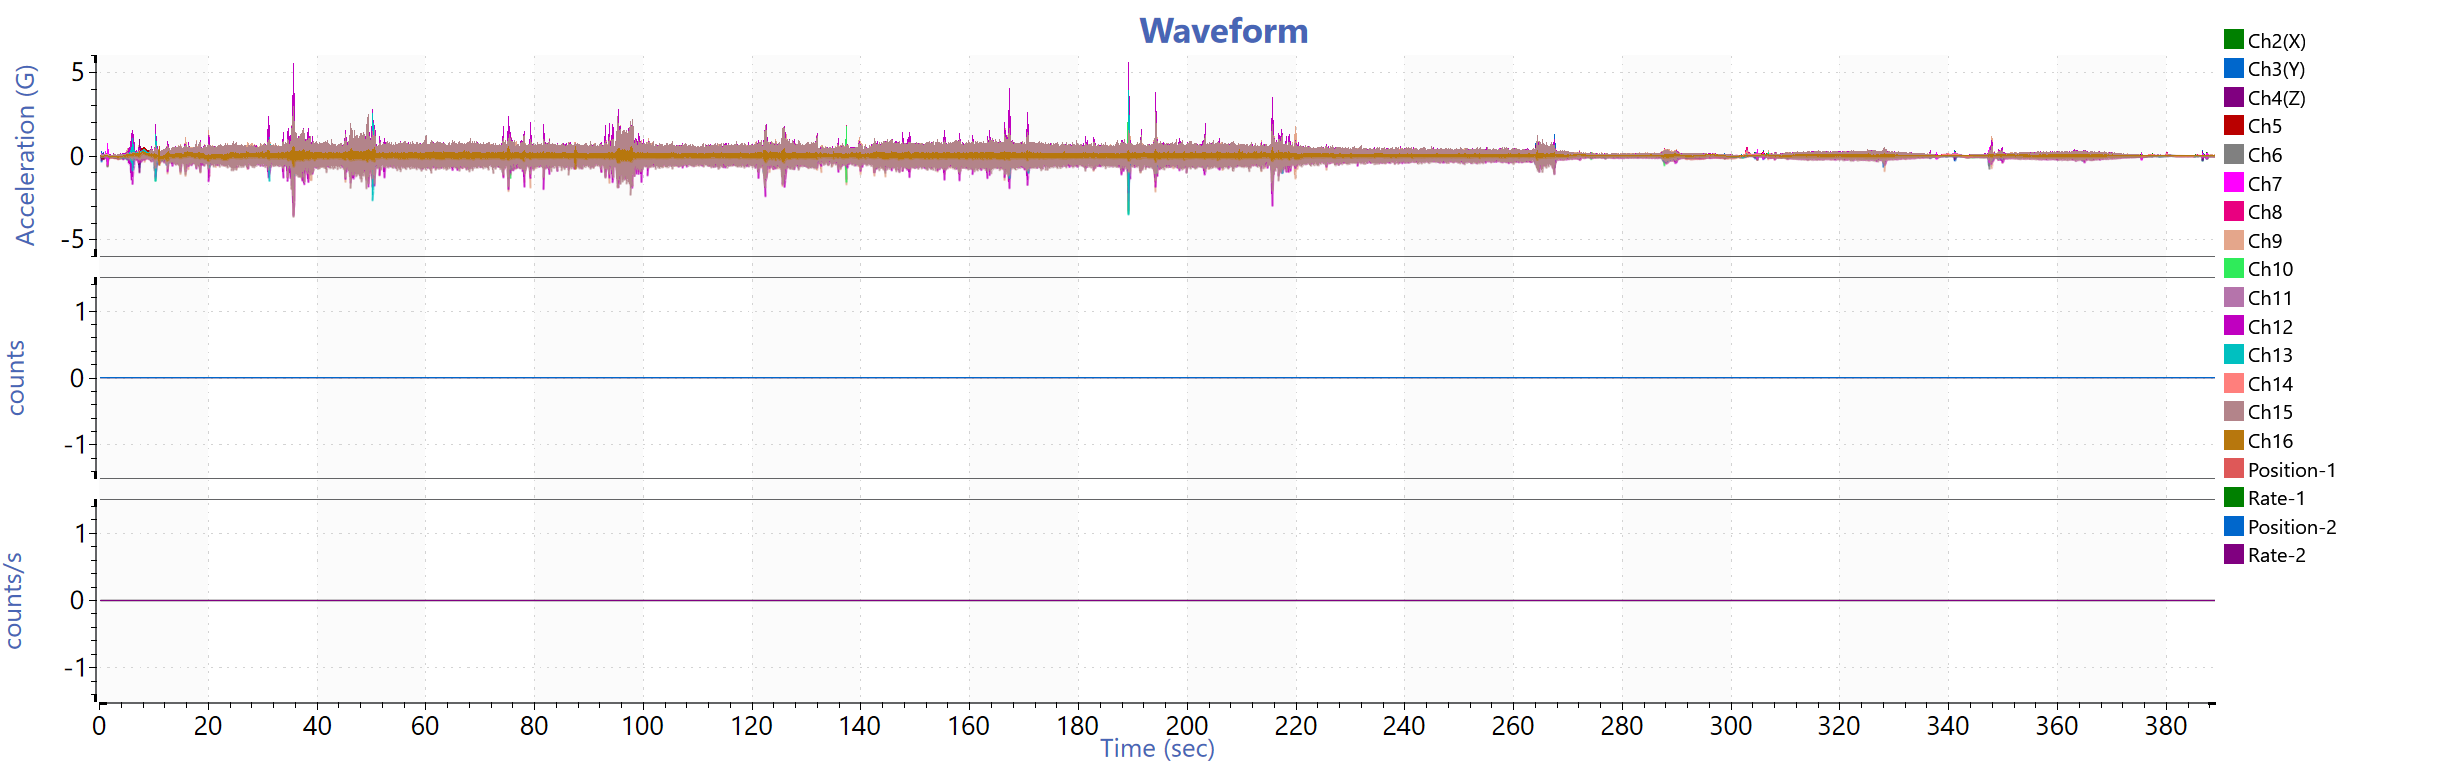
P4 Road Test
P5 Road Test
P6 Road Test
P7 Road Test
SAE J2380
Driving Test – Simulation Equivalence
The driving tests conducted (p1–p7) were selected to represent a range of vibration environments corresponding to those experienced during typical vehicle operation. These conditions were grouped based on vibration severity to approximate the SAE J2380 profile. Low-intensity conditions such as smooth road (p1) and highway driving (p4) represent continuous, low-amplitude excitation. Moderate conditions including city driving (p3) and suburban/hill driving (p5, p7) introduce transient loading events such as acceleration, braking, and elevation changes. High-intensity conditions such as rough road (p2) and gravel driving (p6) generate large-amplitude, short-duration vibration events, including impacts from potholes and uneven terrain.
Additionally, if one wished to replicate this procedure, a test procedure consisting of approximately 14 passes of the seven driving scenarios could be followed. With the standard SAE J2380 profile using a multi-axis shaker having a total run time of 13.6 hours, performing the above road tests, with a total run time of approximately 1 hour per run, 14 times would net a similar outcome to the standard SAE J2380 vibration test. High-severity conditions may need to be repeated fewer times due to their large contribution to fatigue damage, while lower-severity conditions would be repeated for longer durations to simulate cumulative exposure. This combination allows the overall vibration exposure to approximate the frequency content and energy distribution defined in SAE J2380.
Conclusion
The collected vibration data successfully captures a range of real-world driving conditions and provides a meaningful comparison to the SAE J2380 standard. While the measured PSD profiles differ in magnitude and variability due to real-world influences, they exhibit similar overall trends in frequency-dependent behavior. The combination of low, moderate, and high-severity driving conditions allows the development of a representative vibration profile that can be used to approximate durability testing conditions. This demonstrates that real-world driving data can be effectively translated into a structured testing strategy for evaluating vehicle vibration durability.