New “Add Graph” User Interface
The user interface for adding a graph has been updated to reflect the new capabilities of ObserVIEW 2024. It organizes the project’s traces in a tree-like structure, where users can select all the graph types and associated traces that appear in the main graph.
Updates
- Select graph traces from a nested list of options with search bar and filter options
- Add traces of different graph types to the same graph
- Add traces of different data ranges to the same graph
- Add time statistics traces to graphs
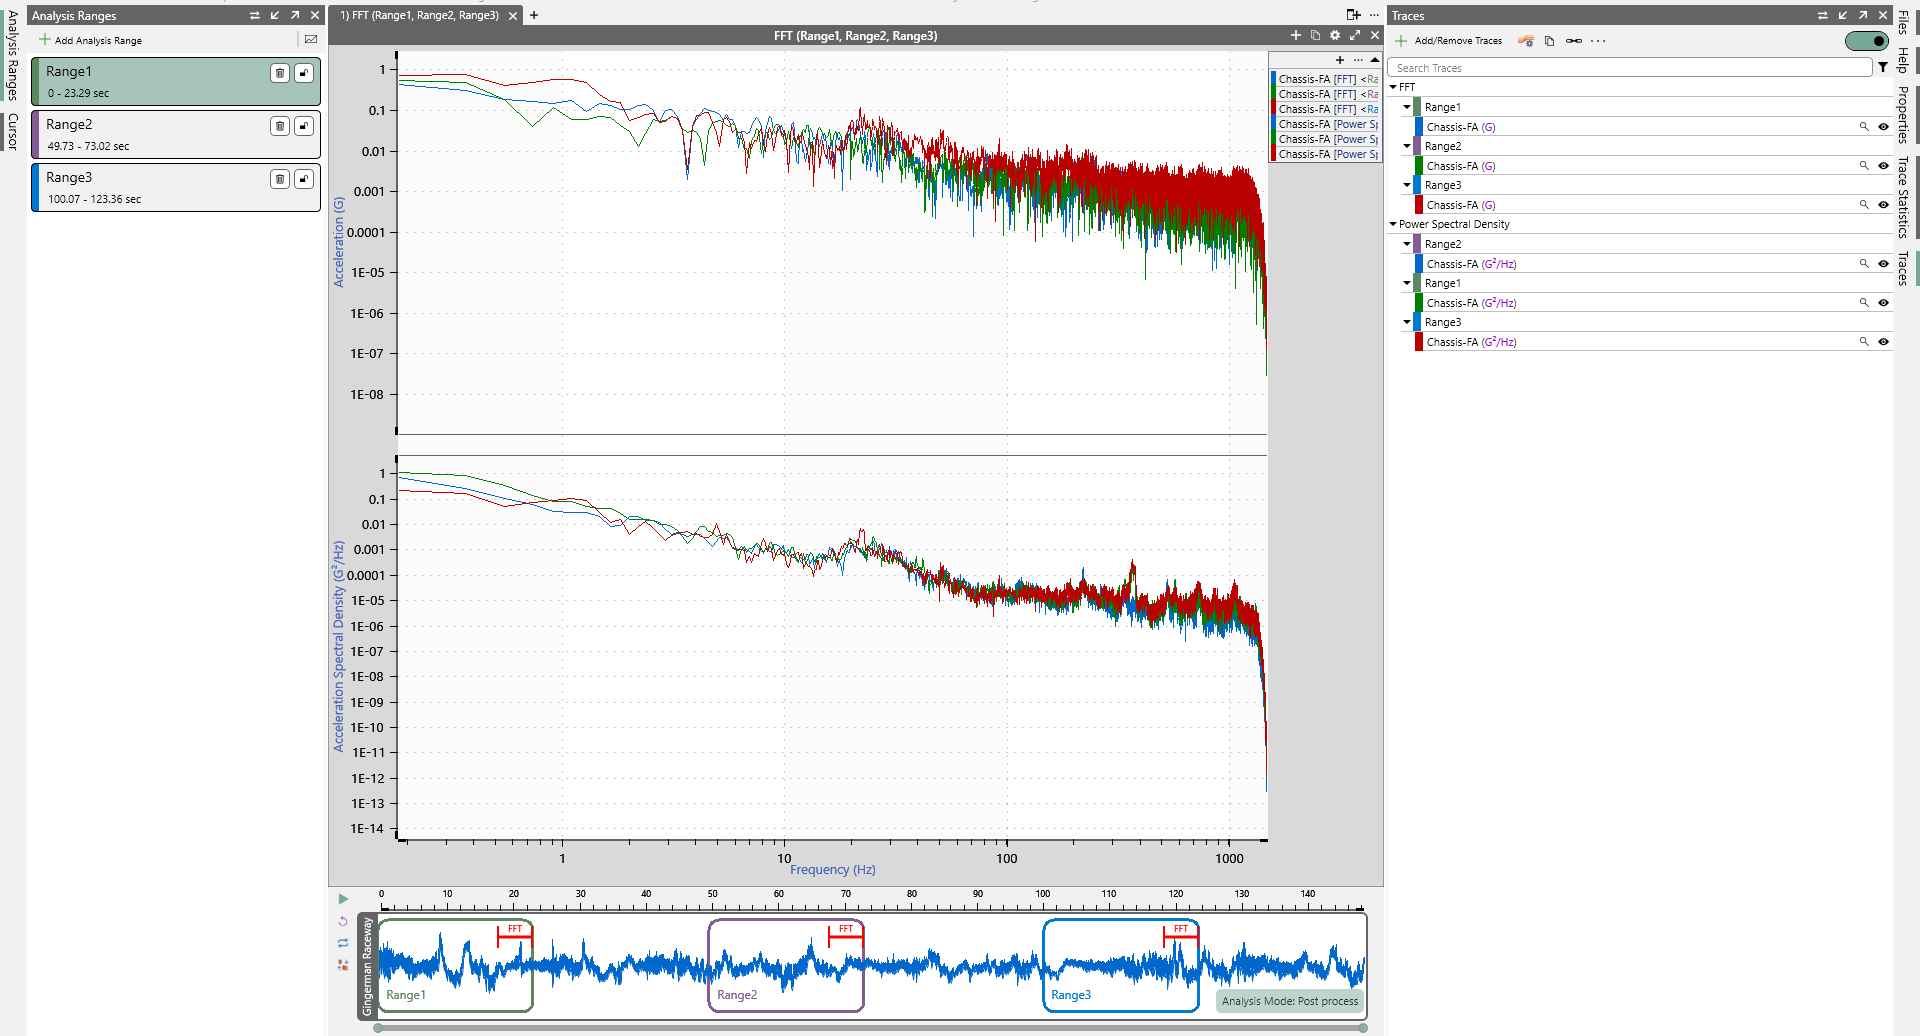
Analysis of Multiple Data Ranges
ObserVIEW now includes an Analysis Ranges pane (pictured right lower), allowing users to add multiple analysis ranges to a project and easily navigate between them rather than create a new project for each data range of significance.
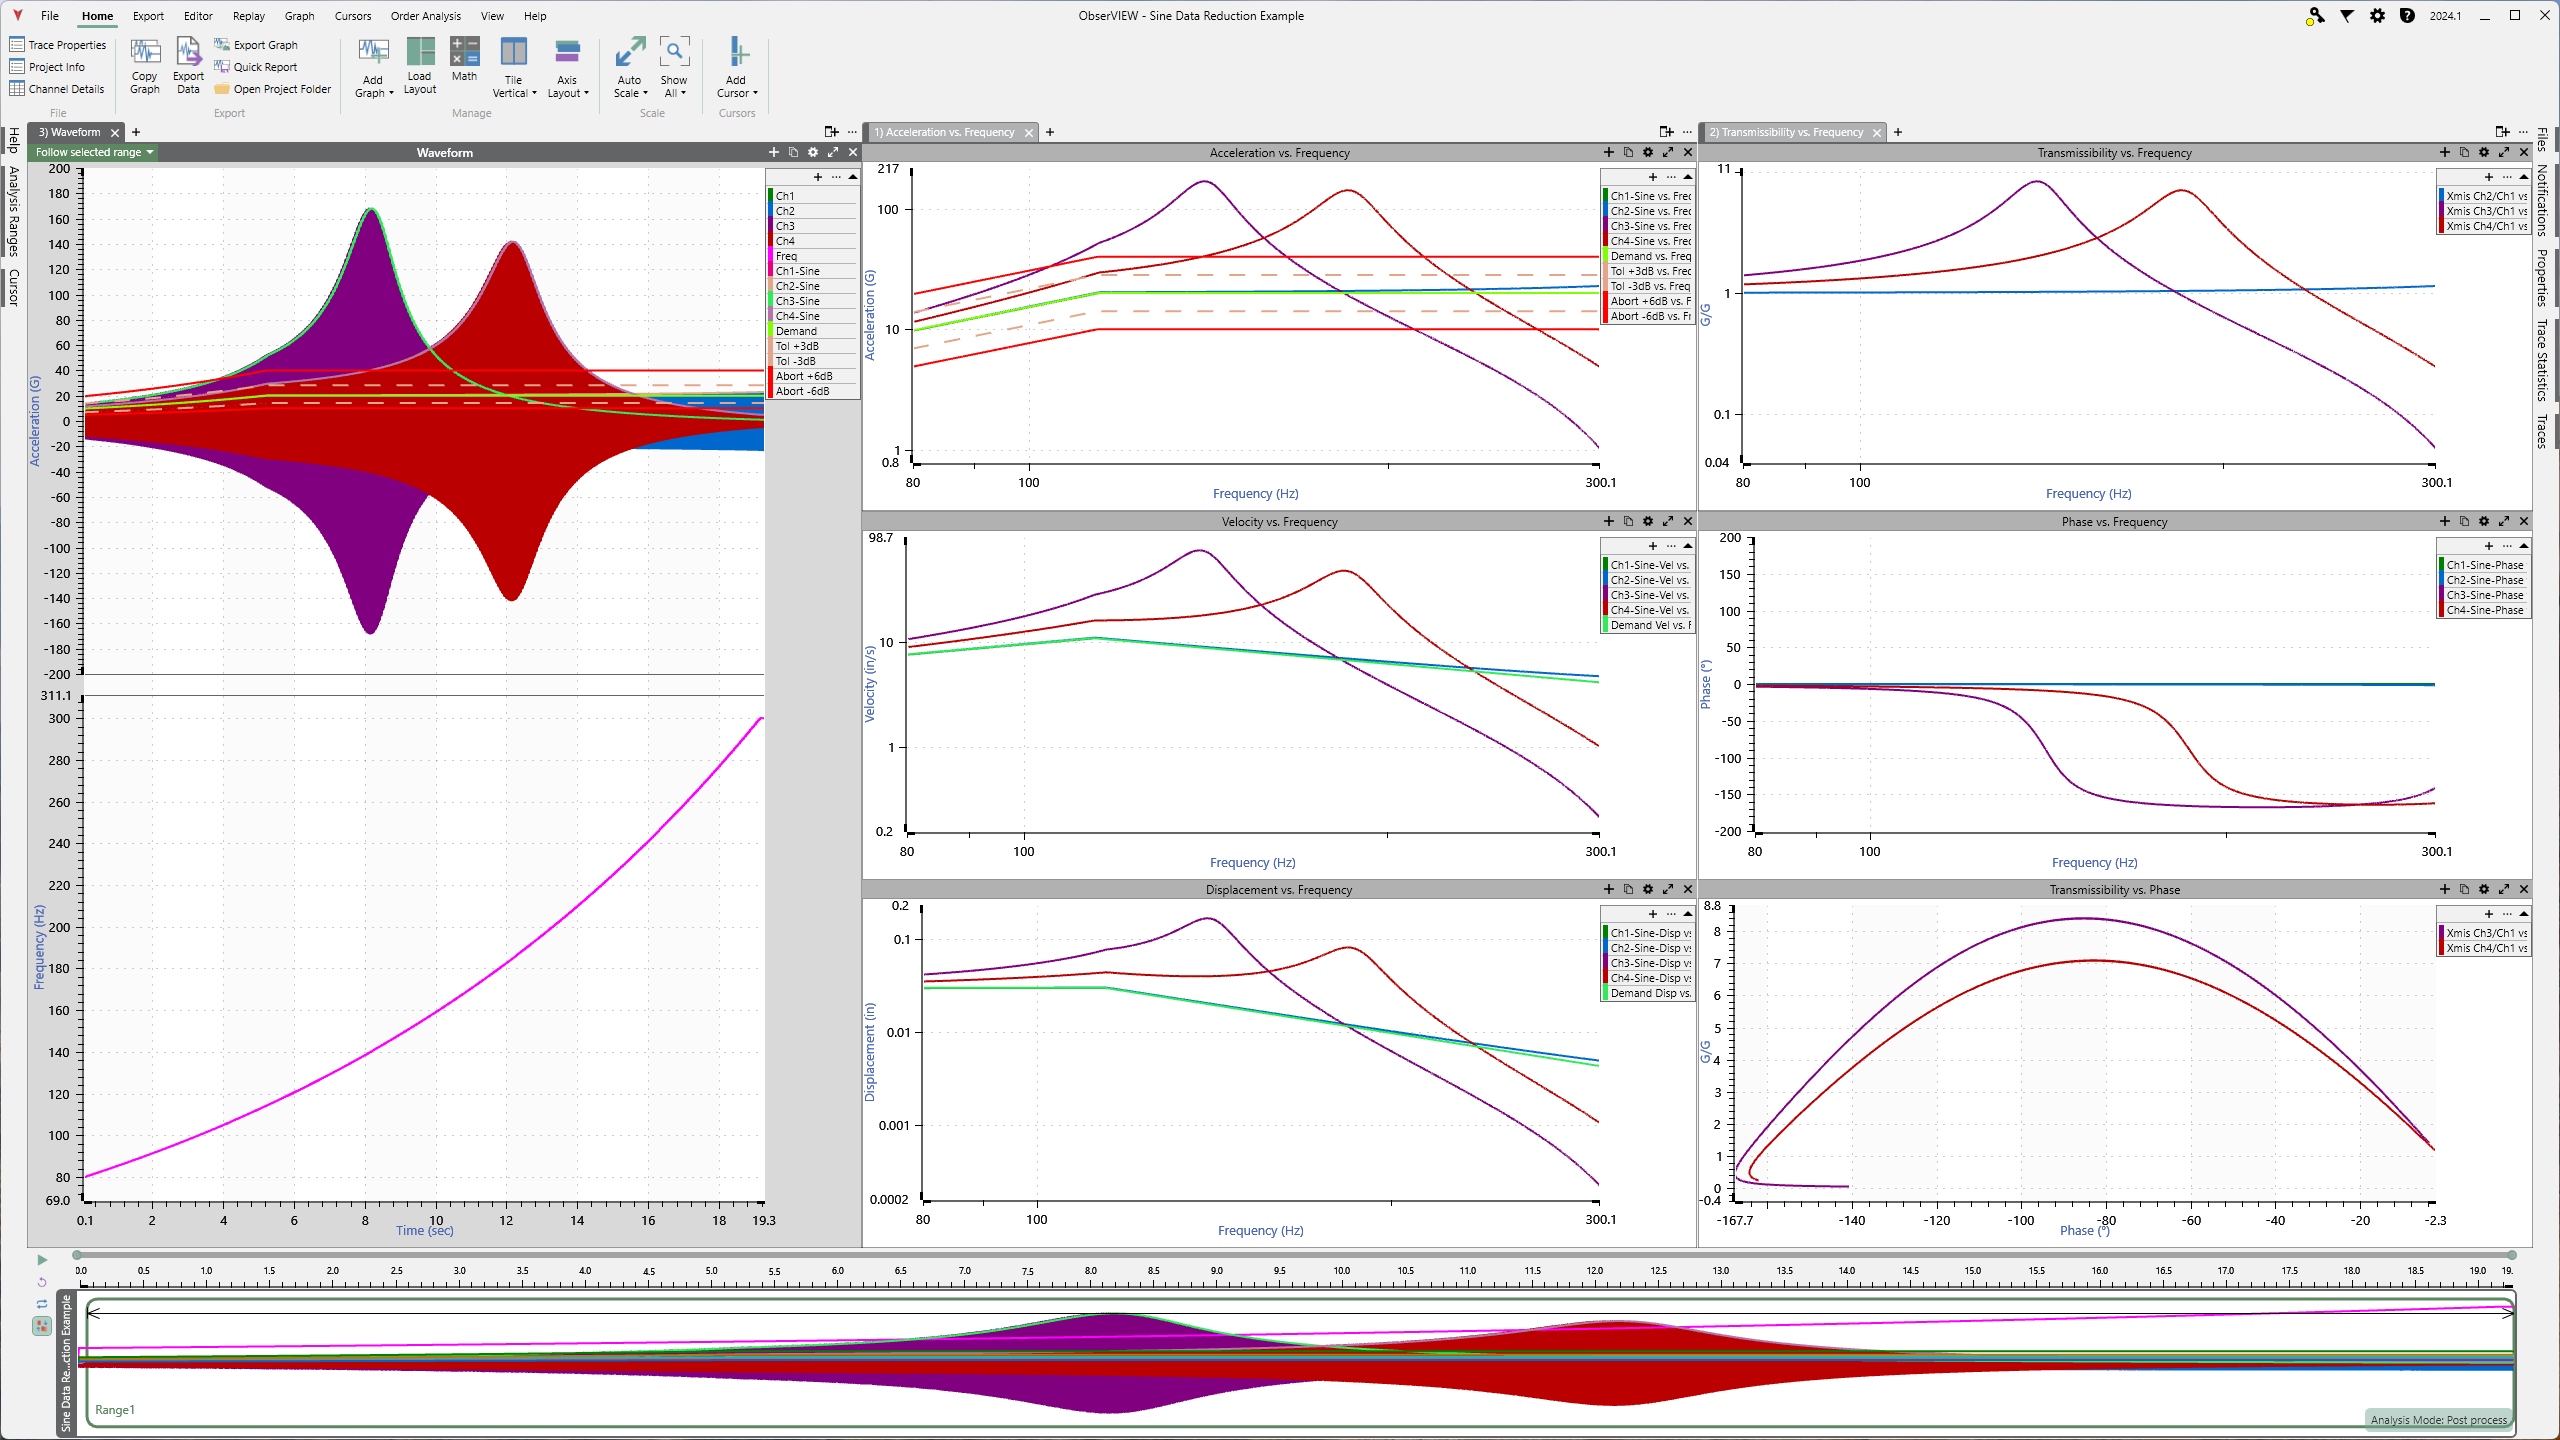
Sine Data Reduction Analysis
ObserVIEW now offers several features for analyzing and reprocessing sine reduction test data.
The Math Traces feature includes expressions for post-process analysis that simplify sine sweep data by breaking down the frequency and amplitude components of time-domain signals. This method provides clearer insights than traditional graphs like the fast Fourier transform (FFT) or transmissibility.
The software also allows engineers to reprocess recorded sine data to duplicate the analyses of the controllers used during testing.
Sine Reduction Graphing Options
Plot the analysis of sine reduction data and other Sine test data with the new scatter plot graphing function.
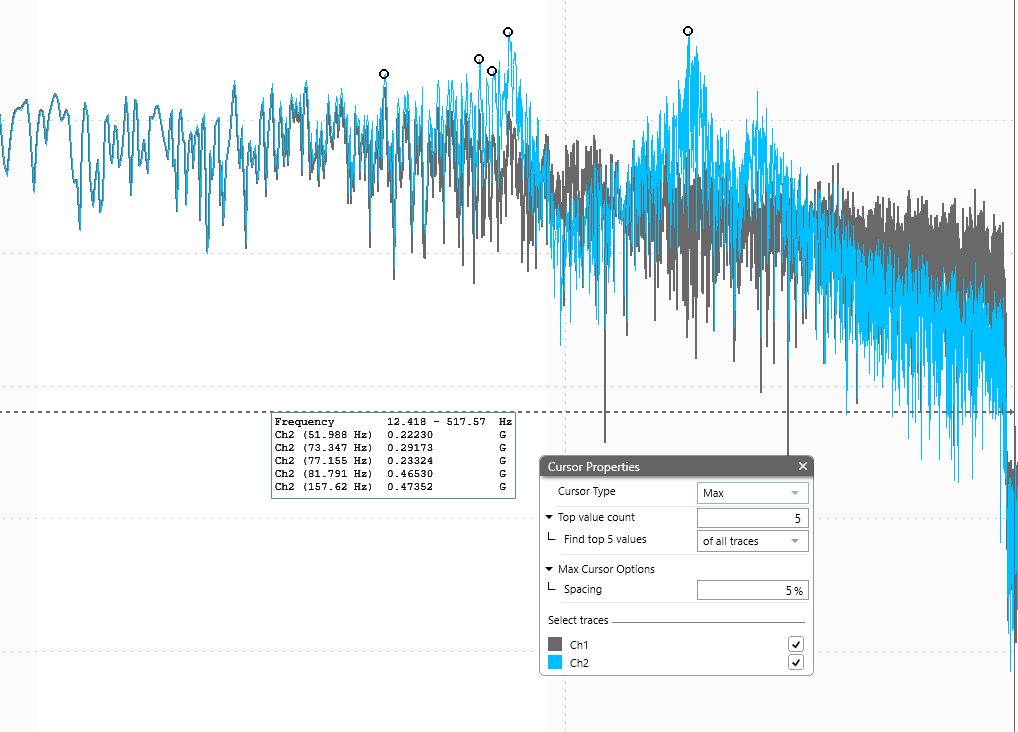
Cursor Properties
Cursors are visual tools that display data values at the cursor location/range.
Snap Cursor at Peak/Valley
Use Ctrl+Shift to snap a cursor to the closest value on a graph. ObserVIEW can perform this task instantaneously, search over the entire data set or a user-defined range, and continuously search for the peak value near the original peak value cursor location.
Range Cursor
Analyze a segment of data and report on the difference between the maximum and the minimum values. The range cursor works on any time or frequency graph and automatically identifies the minimum and maximum values within the user-selected range.
Select Channels for Cursor Annotation
Select the channels to which the cursor should apply.
Find Top X Number of Max, Min, or Maximax Peaks
Annotate a range of data with the top X number of peaks.
Statistical Analysis Traces
Mean, RMS, Variance, Kurtosis, Min, Max vs Time
Generate graphs for statistical analysis, reviewing statistics over time and comparing the statistical behavior of multiple data sets.
- Min, max, maximax
- Mean
- RMS
- Standard deviation
- Variance
- Skewness
- Kurtosis
- Range
- Crest factor
Trace Statistics Pane
Review the time statistics of time and frequency traces; copy the values as a text table and paste them into a Microsoft Word or Excel document for reporting.
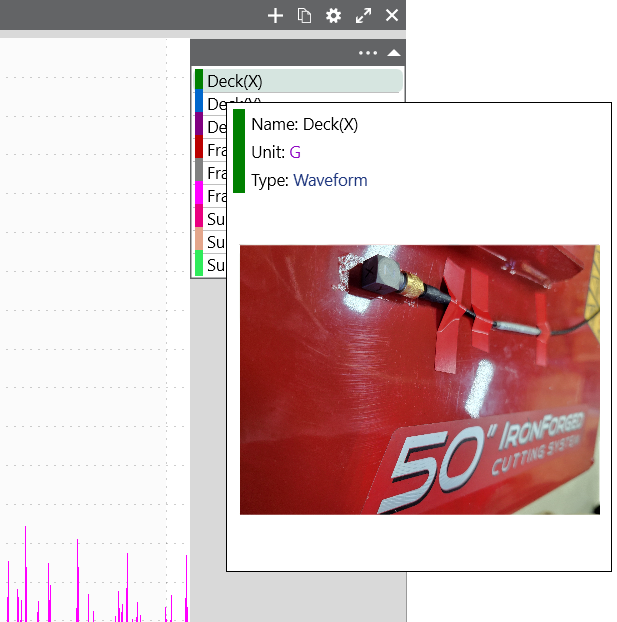
Display Sensor Image
In the VR Mobile input configuration, the user can upload a photo of a sensor for each input as a reference. In ObserVIEW, sensor photos can be accessed from a graph trace.
Math Trace Improvements
Improvements have been made to the Math Traces feature, including:
- Allow sub-traces for settings like FFT peak hold (ex. find the envelope of my FFT peak holds)
- Use a math trace inside another math trace (ex. reference a math channel from another math channel, use frequency math traces as components of other frequency math traces)
- Derive math traces from time math traces in Live Analyzer (ex. view the filtered PSD of incoming data, find the RMS of filtered channel data)
Additional Features
- Allow logarithmic scaling of the y-axis on time graphs
- Additional UFF export formats: 164 and 151
- Option to export transfer function graphs to UFF, including DOF locations for modal analysis
- Software selects analysis lines amount to target 1Hz frequency resolution by default
- Spectrograms have analysis lines and window functions independent from FFTs
Start using ObserVIEW 2024
VR users with a valid Upgrades and Support Agreement can upgrade to the latest version for free. Anyone can download a free demo version.