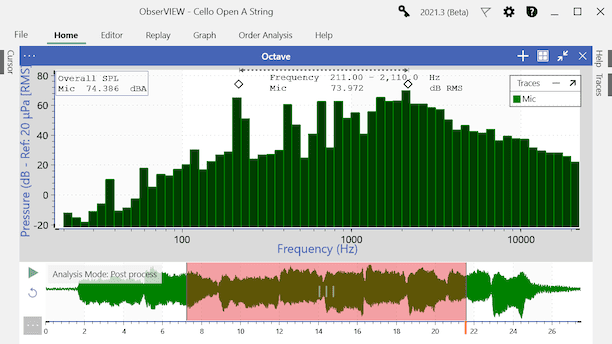
Octave Analysis
ObserVIEW can generate octave bands with an 8th order filter to meet IEC 61260-1 Class 1 filter specifications. It performs filter-based analysis and can apply A and C frequency weighting, linear and exponential averaging, and peak hold.
Features
- Filter-based analysis with the option of FFT
- A and C frequency weighting or none (Z)
- Linear and exponential averaging
- No limit on fractional octave bands
- Configure reference values for each unit category
- Peak hold and overall RMS traces (SPL for pressure units)
- Harmonic cursor
Modal Testing
Perform a modal test with an impact hammer and record the responses with the new Modal Testing license. Modal Testing can be used to acquire data and calculate the frequency response for further analysis.
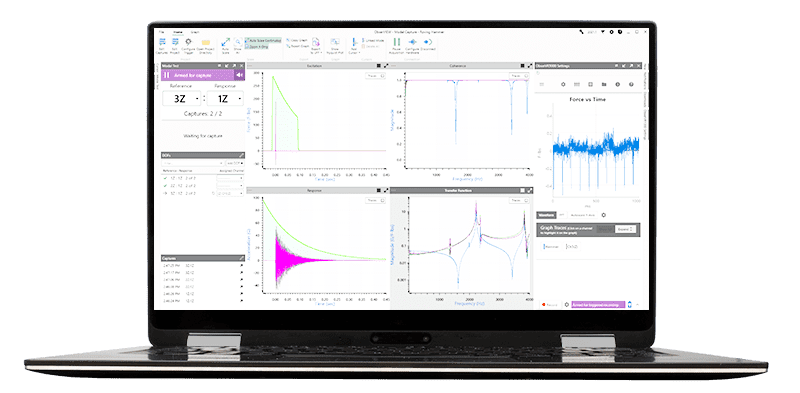
With Modal Testing in ObserVIEW, the user can:
- Manage table of hits per location and review hits
- Average multiple data acquisitions
- Calculate decay rate from transient ring-down events
- Manage the acquisition channel using a large, interactive display
- View transfer function as a Nyquist plot
- And more!
Modal acquisition is the central feature of the ObserVIEW 2021.1 software release. Along with the ObserVR1000, ObserVIEW can perform dynamic signal analysis, which is essential to modal analysis.
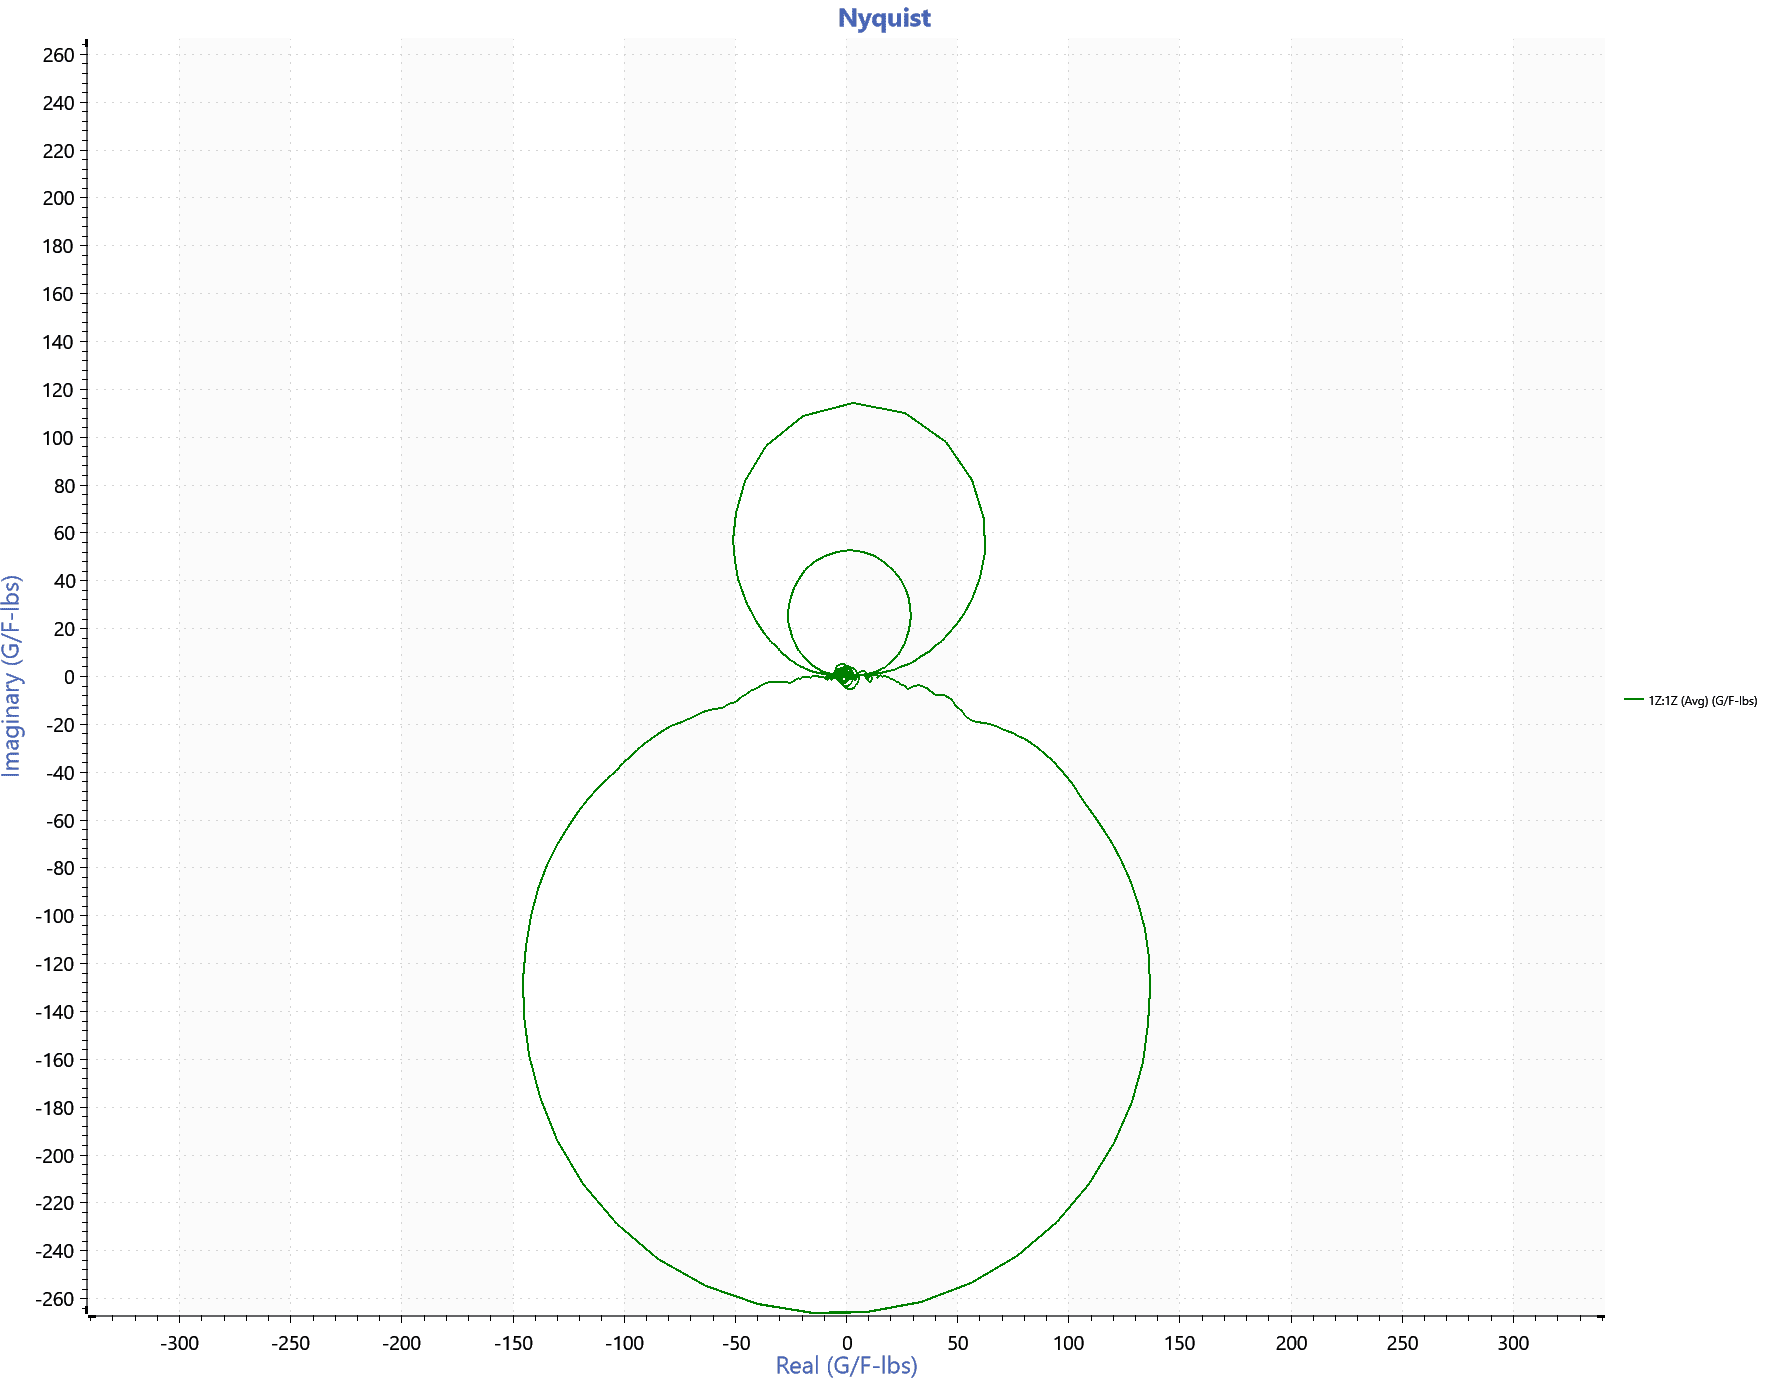
Nyquist Plot
During data acquisition, an engineer may seek to assess the stability of the closed-loop system. The system’s transfer function displayed as a Nyquist plot can be used to determine this stability.
In the ObserVIEW Modal Testing software, the user can also add a Nyquist plot to view transfer function data as a scatter plot. The Nyquist plot is often used to assess the stability of a system with feedback.
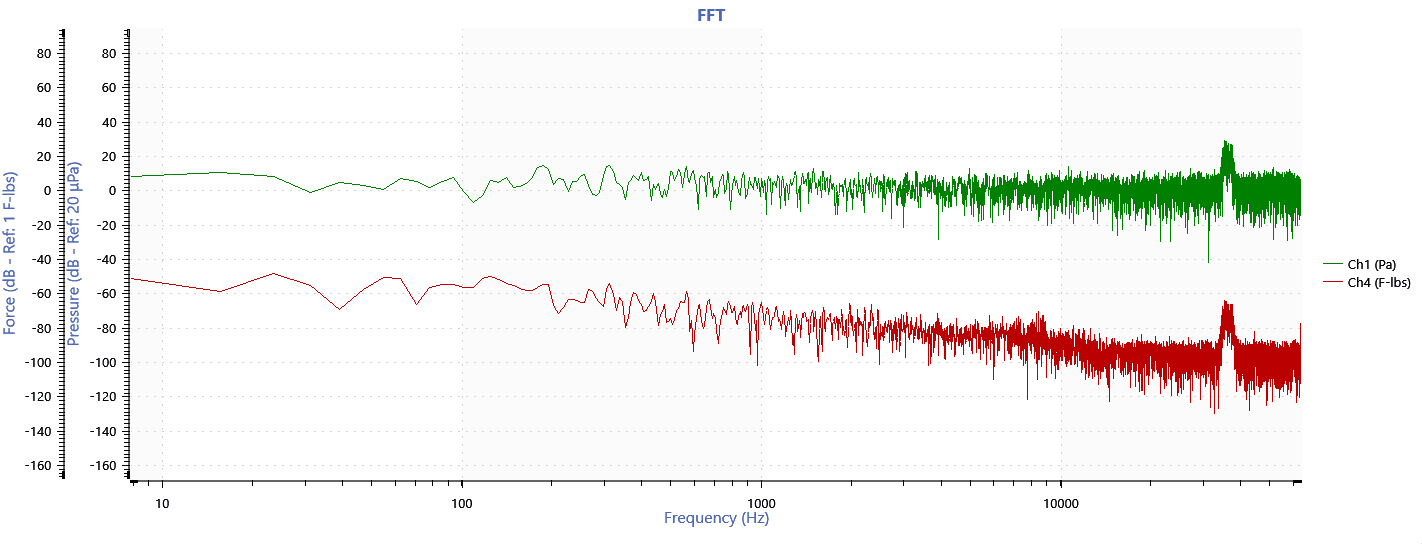
Change dB Reference per Unit
Two values with unit dB cannot be added. Instead, they must be converted between linear units (and then back to log) and have the same reference measurement.
A reference measurement defines the value of 0dB. In ObserVIEW’s Display Units settings, the user can configure reference values for each unit category. The default value is 1 for all units except pressure, which is 20uPa.
Live Spectrogram
The user can now enable a spectrogram graph during live analysis. Previously, the DVR had to be paused to view this graph option.
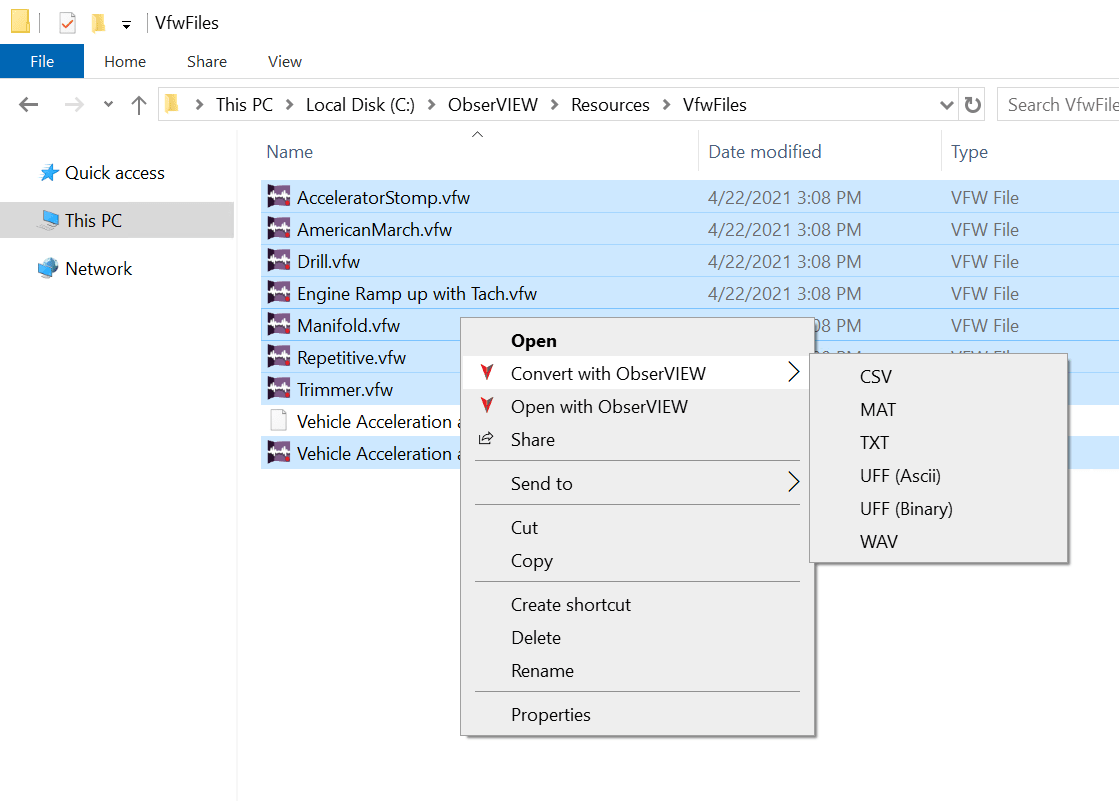
Batch File Conversion
Convert files to any time waveform format supported by ObserVIEW. If the user provides a valid set of parameters, the console app will read the file and convert it to the desired file type.
For example, a .vfw file can be converted to any one of multiple file types without opening the software application. Instead, the user runs the command-line arguments from File Explorer. Any file type that ObserVIEW can open will support the File Explorer options.
Five Reasons to Download ObserVIEW
-
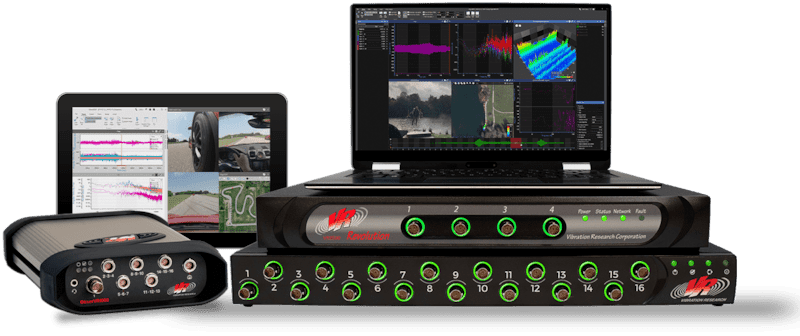
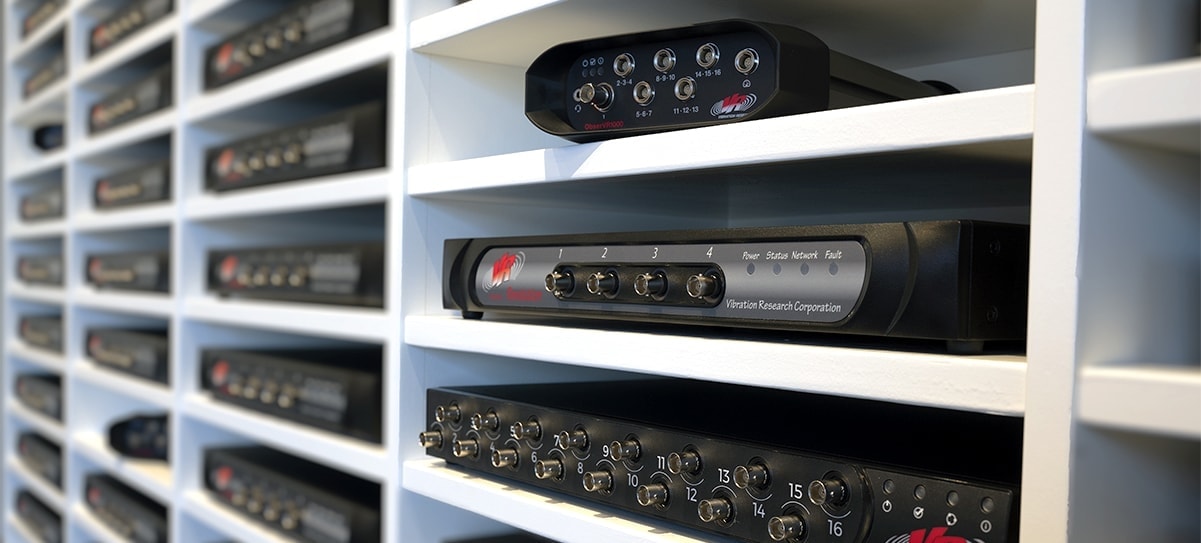
- Compatible with all Vibration Research I/O units
- Data editing
- Multimedia sync and GPS map plotting
- Live Stream of data
- Advanced ObserVIEW features
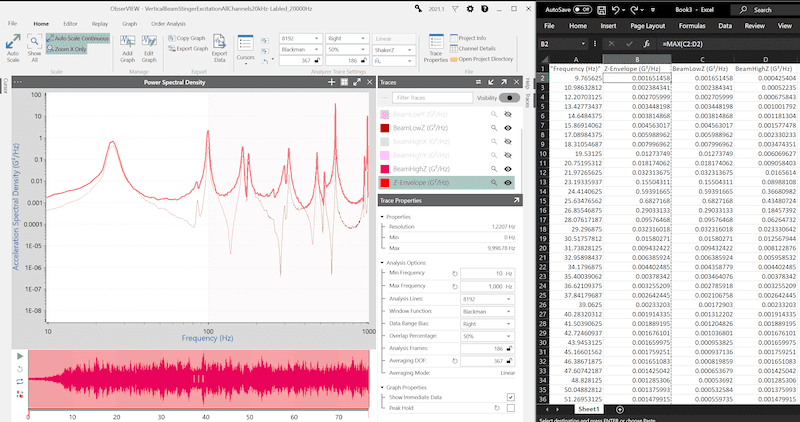
Copy and Paste Traces from ObserVIEW
The copy and paste command in ObserVIEW allows the user to move data between graphs and software applications. In doing so, the user can perform an easy comparison of data from a multitude of applications. This can be useful for comparing graph data from different time locations, multiple test results, various test environments, and much more.
License ObserVIEW Features from a Connected Unit
With a VR I/O unit (ObserVR1000, VR9500, or VR10500) licensed for use with ObserVIEW, the user can activate ObserVIEW by simply connecting to the device. Previously, the software required manual activation (online or off) after downloading.
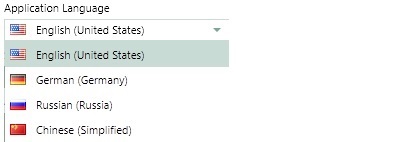
Change Application Language
Easily switch between English (United States), German, Russian, or Chinese (Simplified) under Settings.
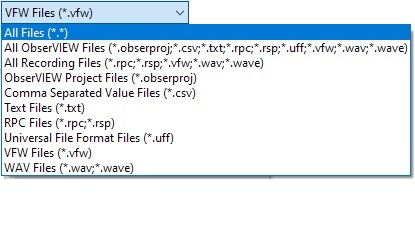
Supported File Types
In addition to VFW files and projects, ObserVIEW can import the following foreign file types: text/csv, rpc®, rsp, uff, and wav.
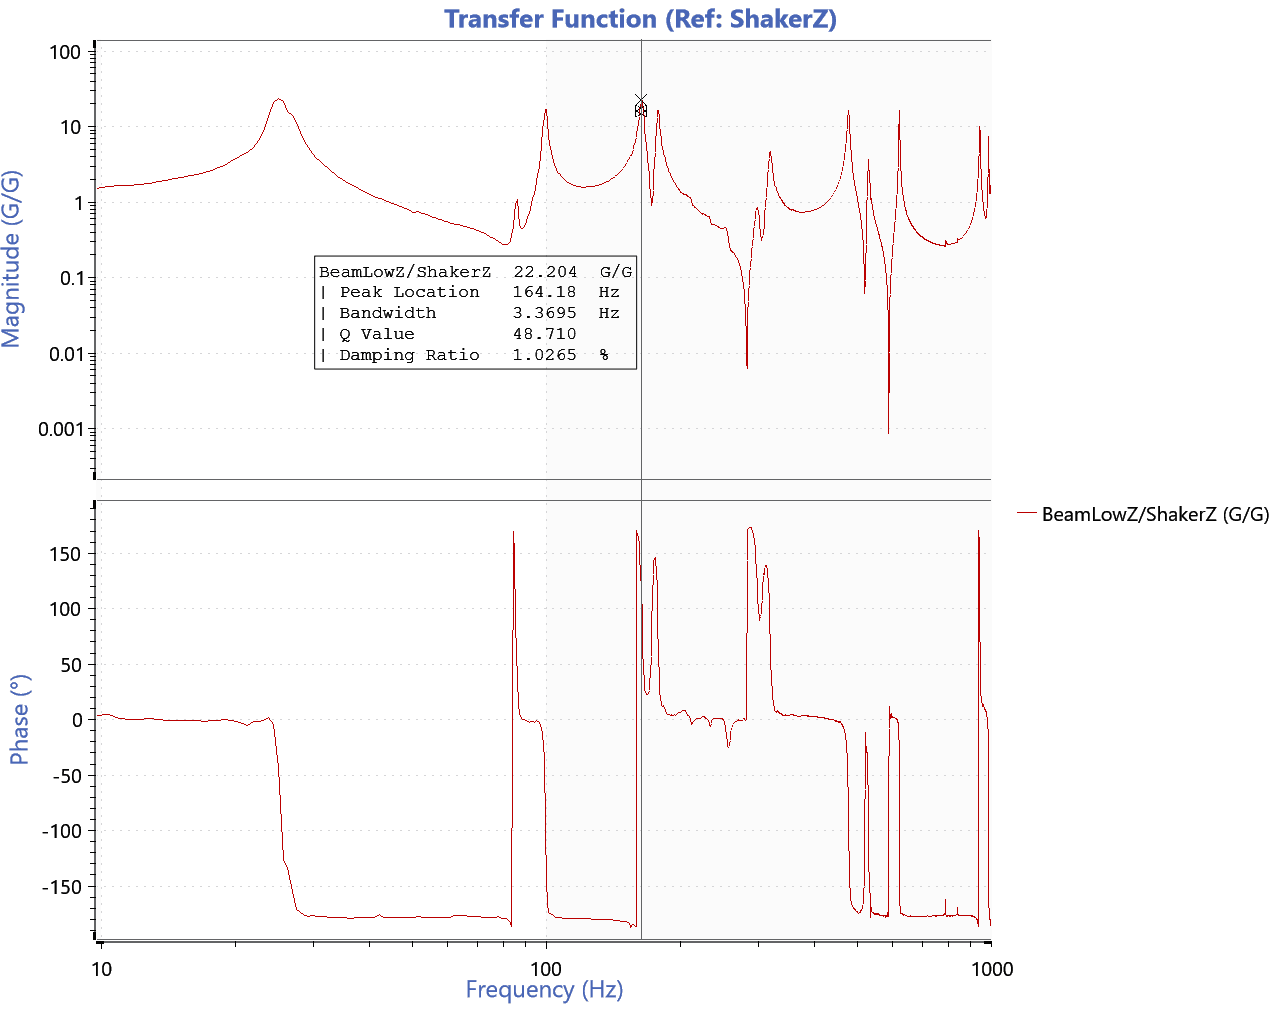
Resonance Cursor
The new resonance cursor displays resonance peak value, peak location, bandwidth, Q value, and damping ratio. It is supported by transmissibility magnitude and transfer function magnitude trace types. Additional cursor types include harmonic, delta, slope, and RMS.
Start using Obserview 2021
VR users with a valid Upgrades and Support Agreement can upgrade to the latest version for free. Anyone can download a free demo version.