Generate an accelerated sine-on-random test representative of operational environments that have dominant sine tones with background random vibration. STAG generates accelerated sine profiles from a recording and employs the FDS to analyze the remaining random content.
The STAG software allow engineers to analyze, generate, and accelerate a realistic sine-on-random vibration test in ObserVIEW that they can run in the VibrationVIEW control software.
STAG uses order analysis and extraction and sine tone profile creation and acceleration to isolate, extract, and create an accelerated sine profile or series of sine profiles from a recording. It employs the fatigue damage spectrum (FDS) to analyze the remaining random vibration.
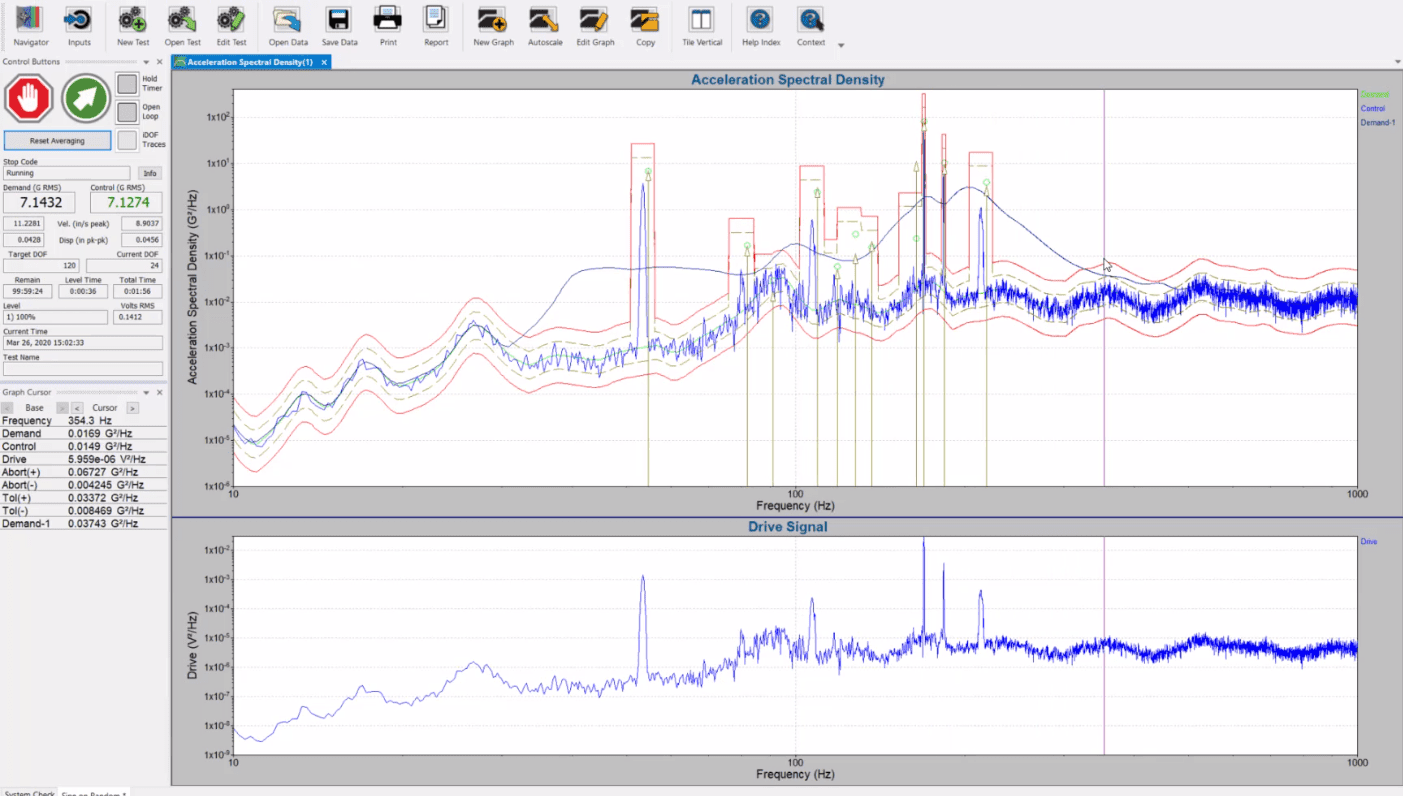
Sine-on-random test running in the VibrationVIEW control software.
Test Development in 3 Steps
STAG uses order analysis and the FDS to ensure all of a test profile’s vibration components are an accurate representation of the operational environment.
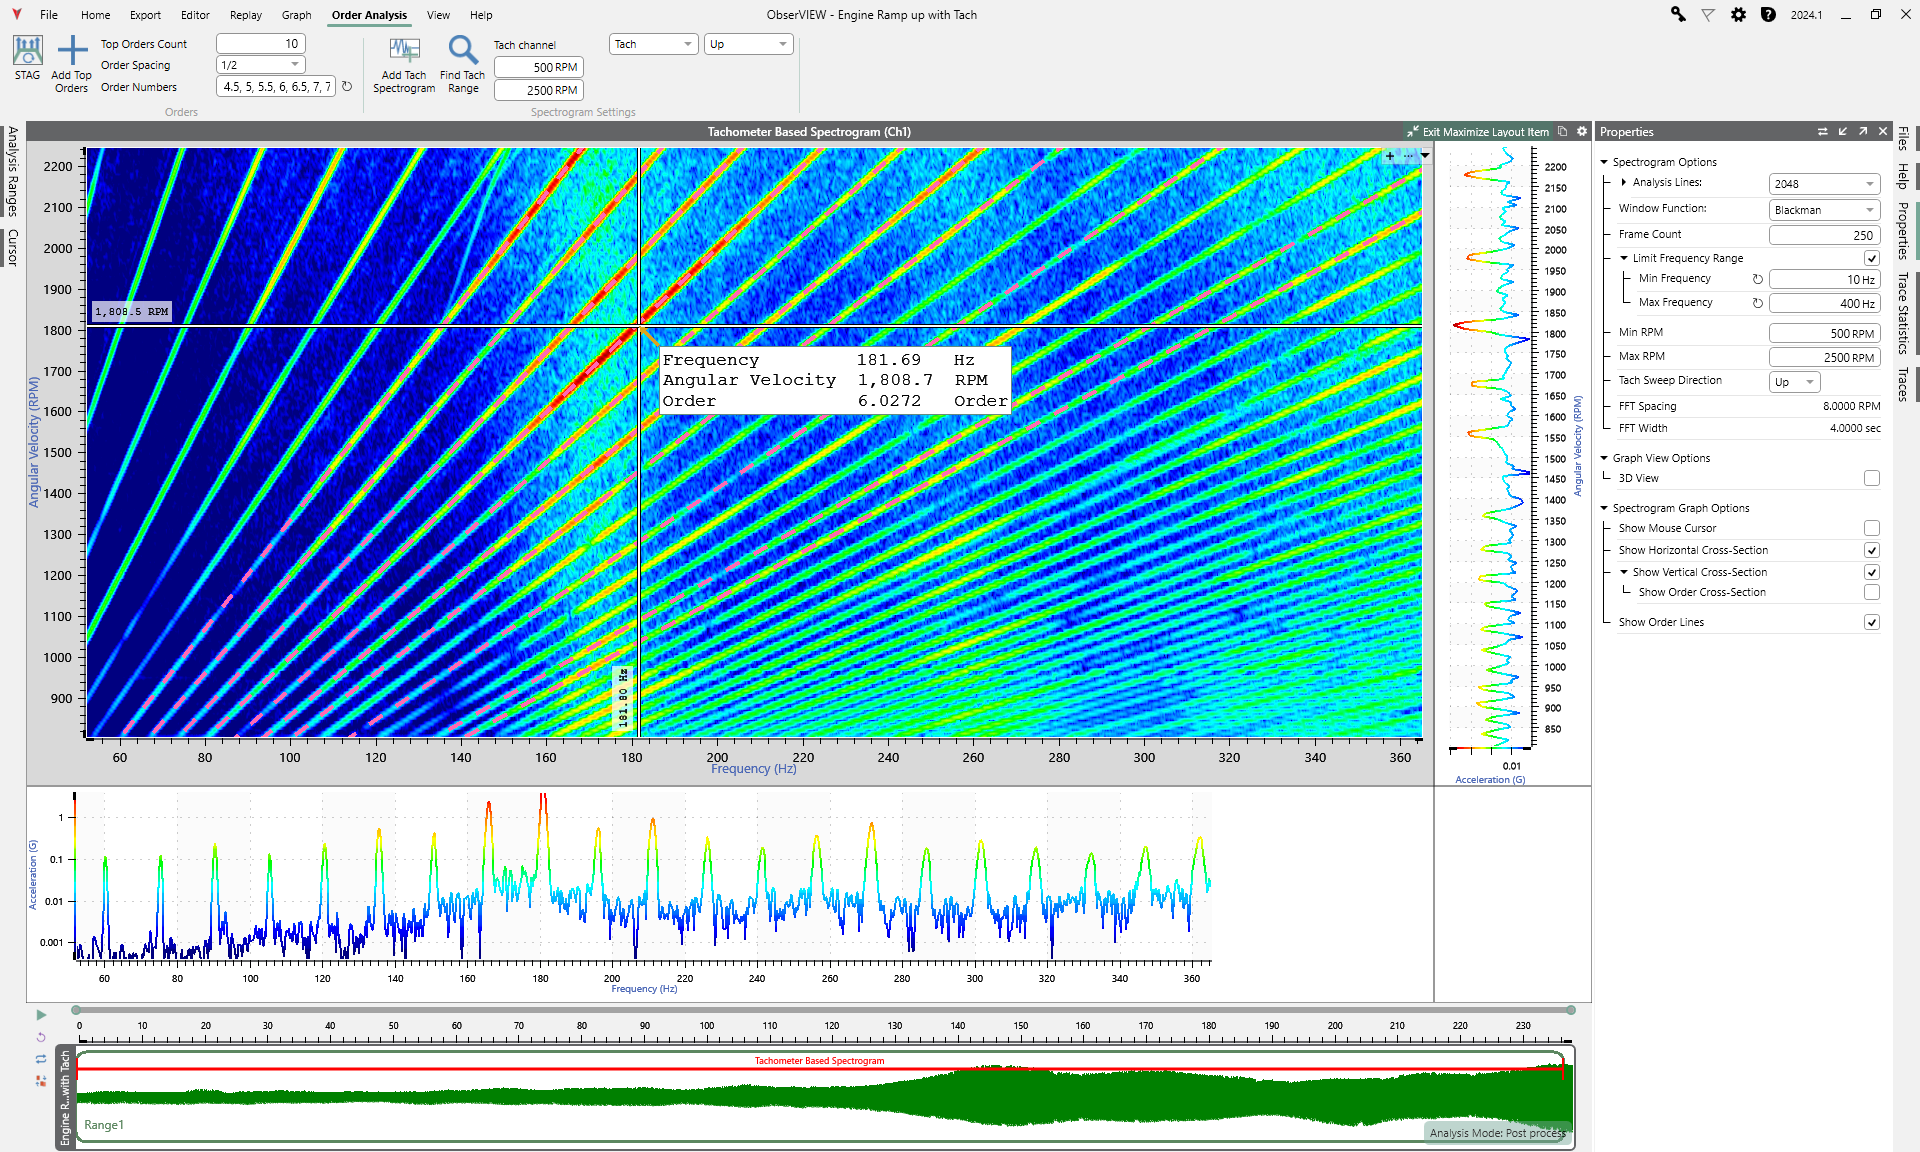
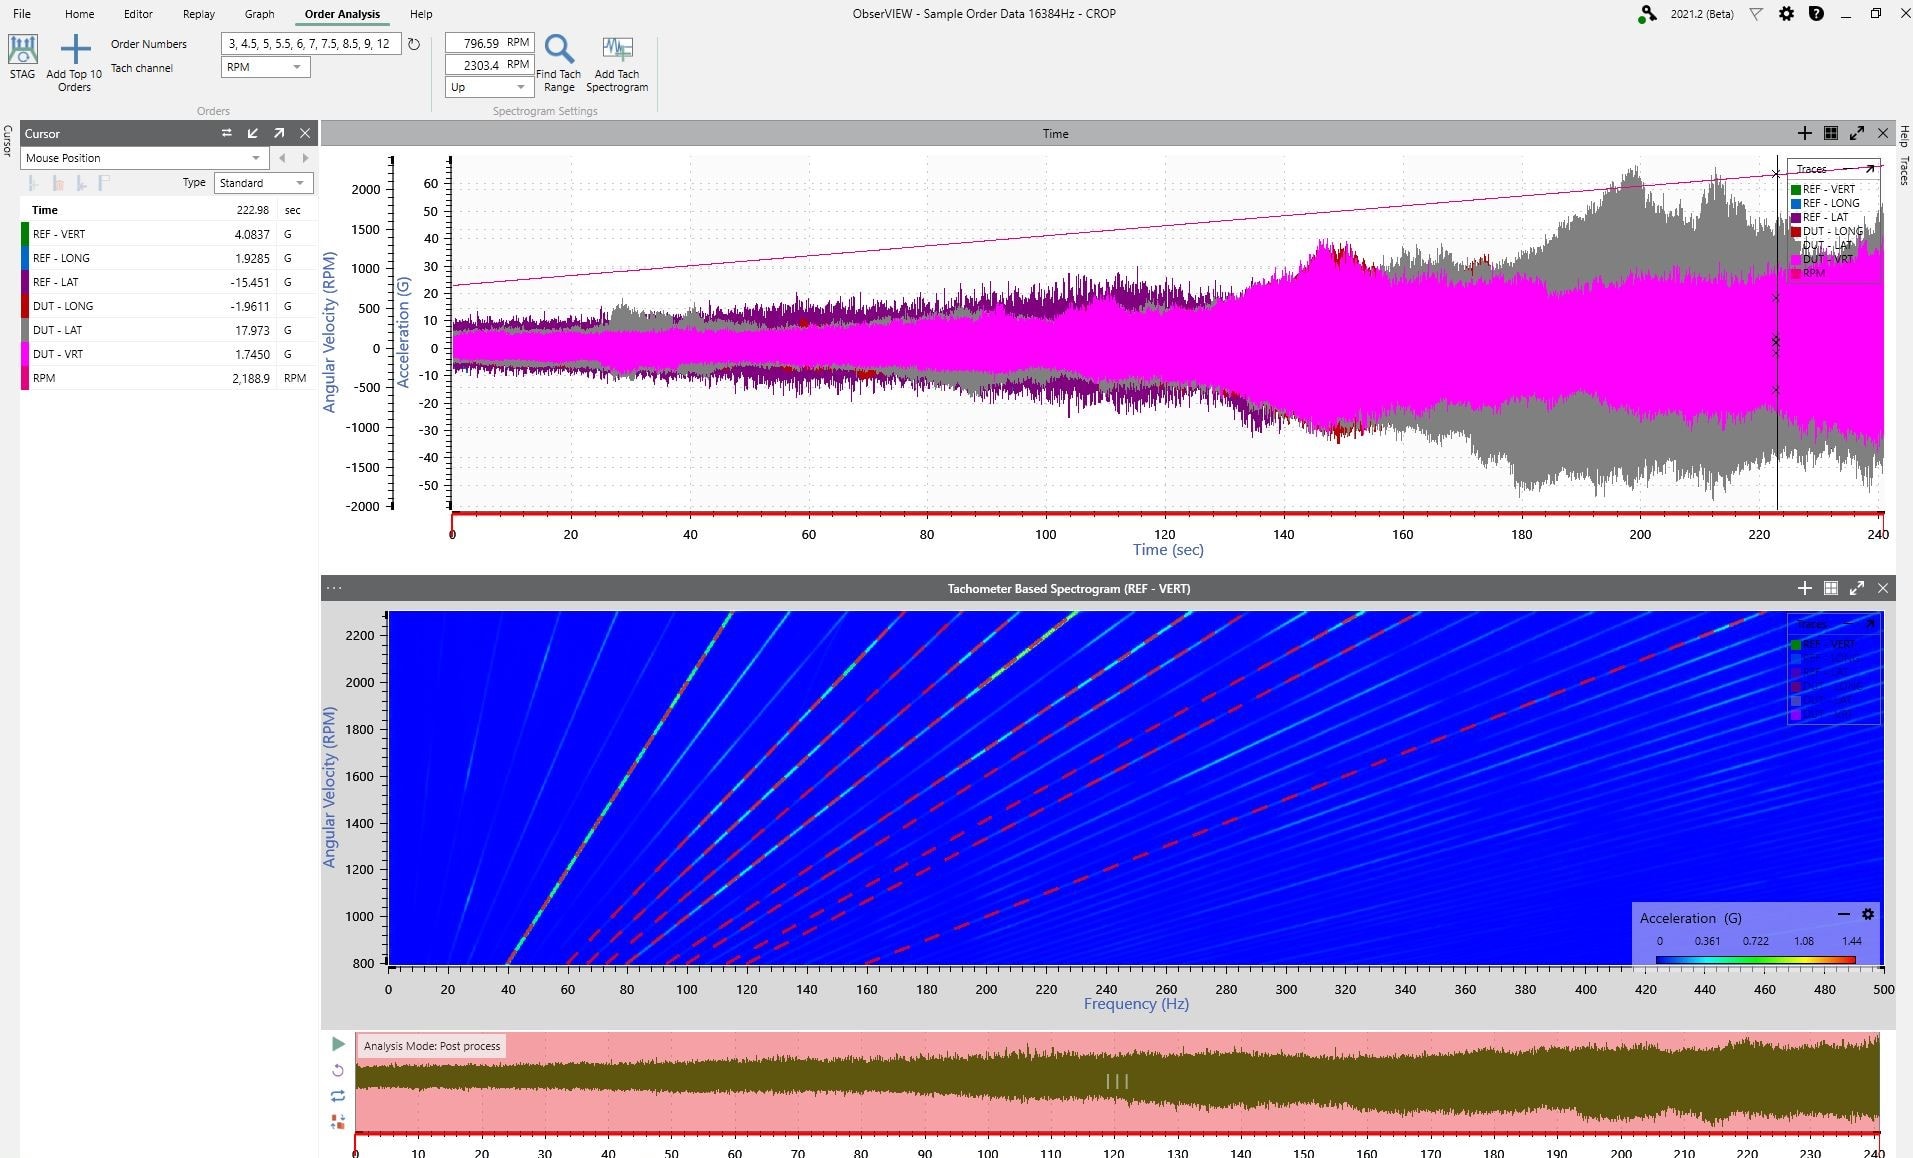
1. Order Extraction and Analysis
ObserVIEW extracts orders of interest from recordings. It separates the rotational content from the background random and then employs a tracking filter to remove unrelated data.
Automatically detect or manually select top orders
Analyze the frequency ranges where sine tones are dominant
Minimize the low-amplitude content or concentrate on a particular peak
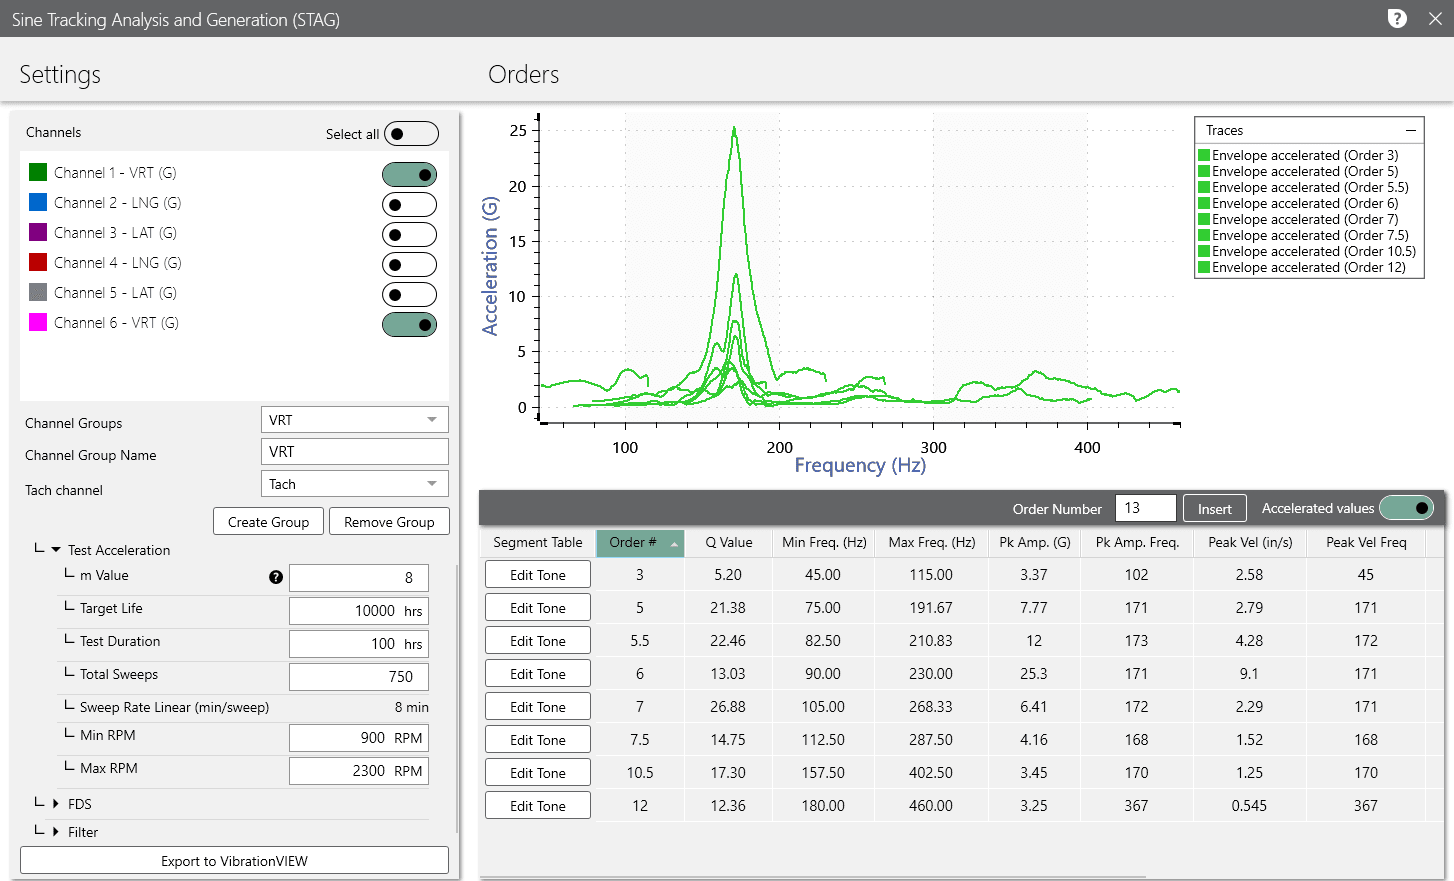
2. Sine Profile Acceleration
STAG generates one or multiple accelerated sine tone profiles using orders extracted from the original recording and user-defined parameters.
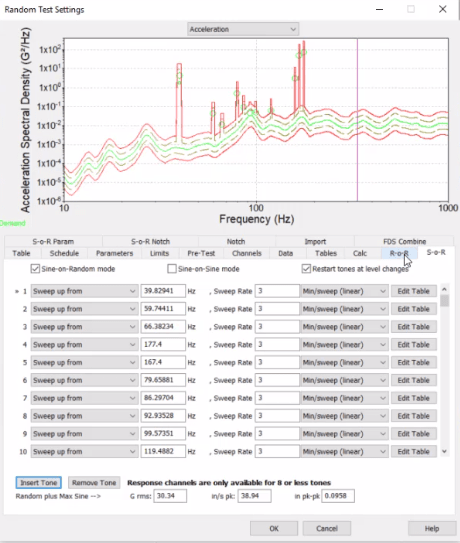
3. SoR Test Generation
The FDS software analyzes the data without the order content and generates an accelerated random profile. STAG combines it with the sine profile(s), creating an accelerated sine-on-random profile engineers can export for testing.
Why STAG?
Activate the Order Analysis and FDS licenses and access the tools to analyze data with dominant sinusoidal components from rotational sources. Quantify noise and vibration in rotating machinery with order analysis, Sine Tracking Analysis and Generation (STAG), and more. Develop tests and analyze waveforms with software tailored for rotational equipment.
Test processing in seconds
Automated profile development
Simplified process to reduce error
Create detailed sine profile test segments based on order-tracked data
Tech Talk: Generating a Sine-on-Random Test (STAG)
Customer Feedback
“The processing time [for standard SoR test development] took up to 30+ hours to create a test profile. This method was computationally expensive and caused a long run time. Many times, there were input errors to the band tracking filters and the wrong order was extracted, or the same order was extracted twice requiring another processing run.
With the STAG tool, our team was able to develop sine tone profiles for the sinusoidal components and then export the random content to VibrationVIEW to employ FDS. The other commercially available package was expensive and time-consuming while STAG processed the data in a fraction of the time and with greater accuracy.“
Reference RPM Trace
The time-history data must include an RPM reference trace and sensor data to extract orders of interest. ObserVIEW offers work-arounds for stationary RPMs or missing RPM data.
Environments to Analyze
Engine ramp-up/coast down
Engines, gear boxes, transmissions, turbines, pumps, motors, etc.
Sine Vibration from Rotational Components
Vibration from a rotational component, such as an engine or rotor component, is rendered as sine tones on a shaker table. If this vibration exceeds the acceleration of the random background, engineers must include it in the vibration test profile.
A standard random test cannot replicate operational environments with dominant sinusoidal tones. The more accurate option is a sine-on-random (SoR) test, which includes the sine tones and produces more consistent results.