Abstract
Two methods of calculating the relative displacement between two channels are described.
Question
Vibration Research often receives questions about how to compute the relative displacement between two channels. There are two ways this can be accomplished. The trade-off between the two is accuracy and ease of use.
Answer
Computing relative displacement is not just a matter of subtracting channel 2 from channel 1. This method only works for a pure sine tone with channels perfectly in phase.
For example, channel 1 and channel 2 are both experiencing a sine tone with an amplitude of 1″. If the two channels are perfectly in phase, the relative displacement between them will be 0. If they are 180 degrees out of phase, their relative displacement will be 2″.
Calculator Method
During a sine test, the engineer can filter out the harmonics and calculate the relative displacement by assuming a pure sine tone. They need to take the phase into account to do so.
Start by plotting the signal for channel 1 and channel 2 as vectors with the phase between the two channels as θ.
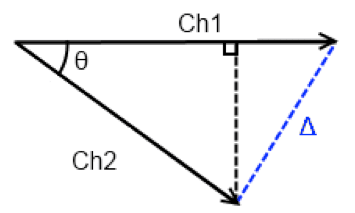
Ch1 and Ch2 as vectors with a phase of theta and a relative displacement of Delta.
The following equation calculates the relative displacement between Ch1 and Ch2 (Δ).
(1) 
Equation 1
Calculator Method in VibrationVIEW
Using Equation 1 in VibrationVIEW requires the Calculator feature (VR9606). Navigate to the Calculator tab in the Sine Test Settings dialog, and select the Insert button to add a new line. Enter the label as “RelDisp” and enter the following equation. The Source data should be “Waveform.”
sqrt(([PARAM:ChDisplacement1]/2)^2 + ([PARAM:ChDisplacement2]/2)^2 – 2 * ([PARAM:chDisplacement1]/2) * ([PARAM:ChDisplacement2]/2) * cos(([PARAM:ChPhase1] – [PARAM:ChPhase2])*pi/180) )
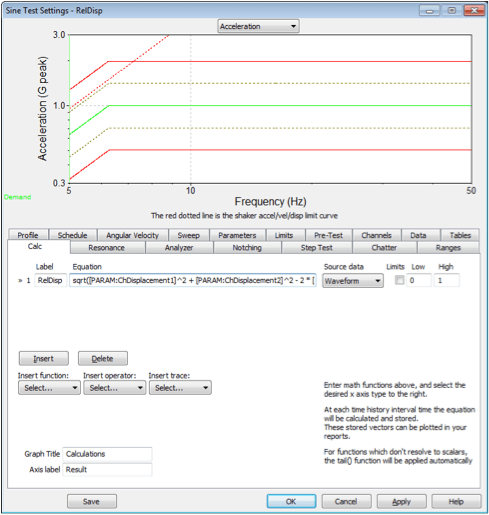
Equation field on the Calc tab of the Sine Test Settings dialog.
The [PARAM:ChDisplacement1] is divided by 2 because the PARAM value is peak to peak. The equation also requires the amplitude.
As the test runs, this calculator trace will continually calculate the relative displacement between Ch1 and Ch2. The results can be graphed versus time (waveform) or frequency. Select the Edit Graph button and select the Calculator vs. Freq. radio button. Then, select the RelDisp math trace under Graph Traces to the right.
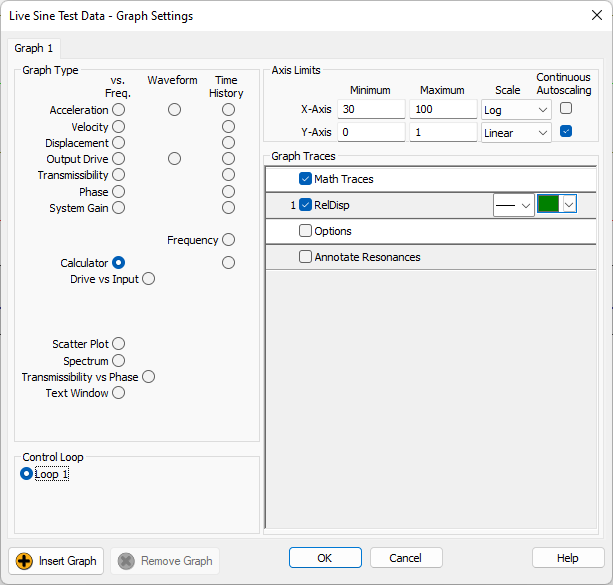
The graph settings for Sine test data.
An example of the results is below. In this case, the maximum relative displacement between channels 2 and 4 is 0.889″ and occurs at 11.53Hz.
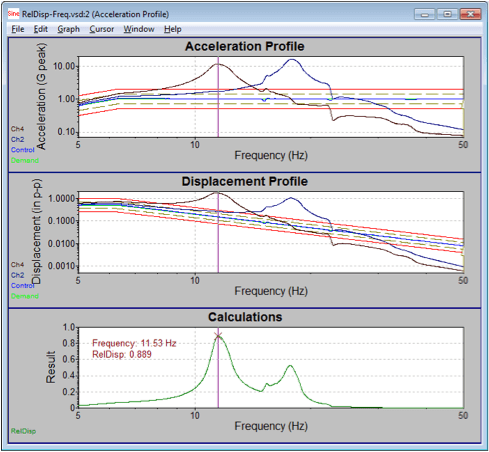
Example results using the calculator method to calculate relative displacement.
This method only works for a sine test and calculates the relative displacement at the excitation frequency. It does not take other harmonics into account.
Post-processing Method in ObserVIEW
To calculate the relative displacement across a broad frequency range, the engineer must record the entire waveform. Then, the ObserVIEW analysis software or another program can calculate the relative displacement from the recording.
If the engineer records data with a displacement transducer, they can apply a simple point-by-point subtraction to calculate the relative displacement. However, most laboratories use accelerometers for recording. In this case, the engineer will need to convert the data from acceleration to displacement.
One way to convert from acceleration to displacement is to double-integrate using the cumulative sum. However, this method is prone to random walk so all that is visible is low-frequency random noise.
A better option is to apply a 2nd order low-pass filter with a corner frequency below the minimum frequency of interest. The Math Traces feature in ObserVIEW can calculate relative displacement using this method.
Calculating Displacement from Acceleration
To calculate displacement from the a recording of the above calculator method example:
- Add a math channel to an acceleration waveform graph (right-click > Add Math Channel)
- Enter the expression: integrate(v1, 2, 3)
- Set the working unit for the acceleration variable to m/s2 (SI units) and the output unit to m
This expression will use an IIR filter to integrate the trace selected for v1 twice, with a corner frequency of 3Hz. The corner frequency should be close to zero.
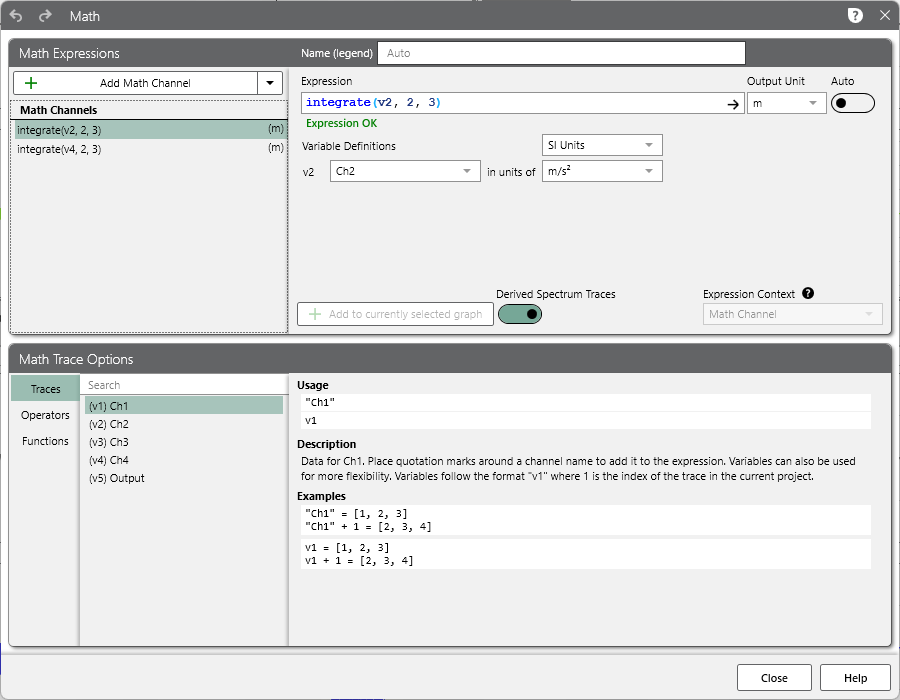
Double-integration expression in the Math dialog.
Note: v1 represents the trace to be integrated. The trace may be labeled as v2, v3, etc. Trace labeling is in the “Math Trace Options” section.
- Repeat steps 1-3 for the second channel.
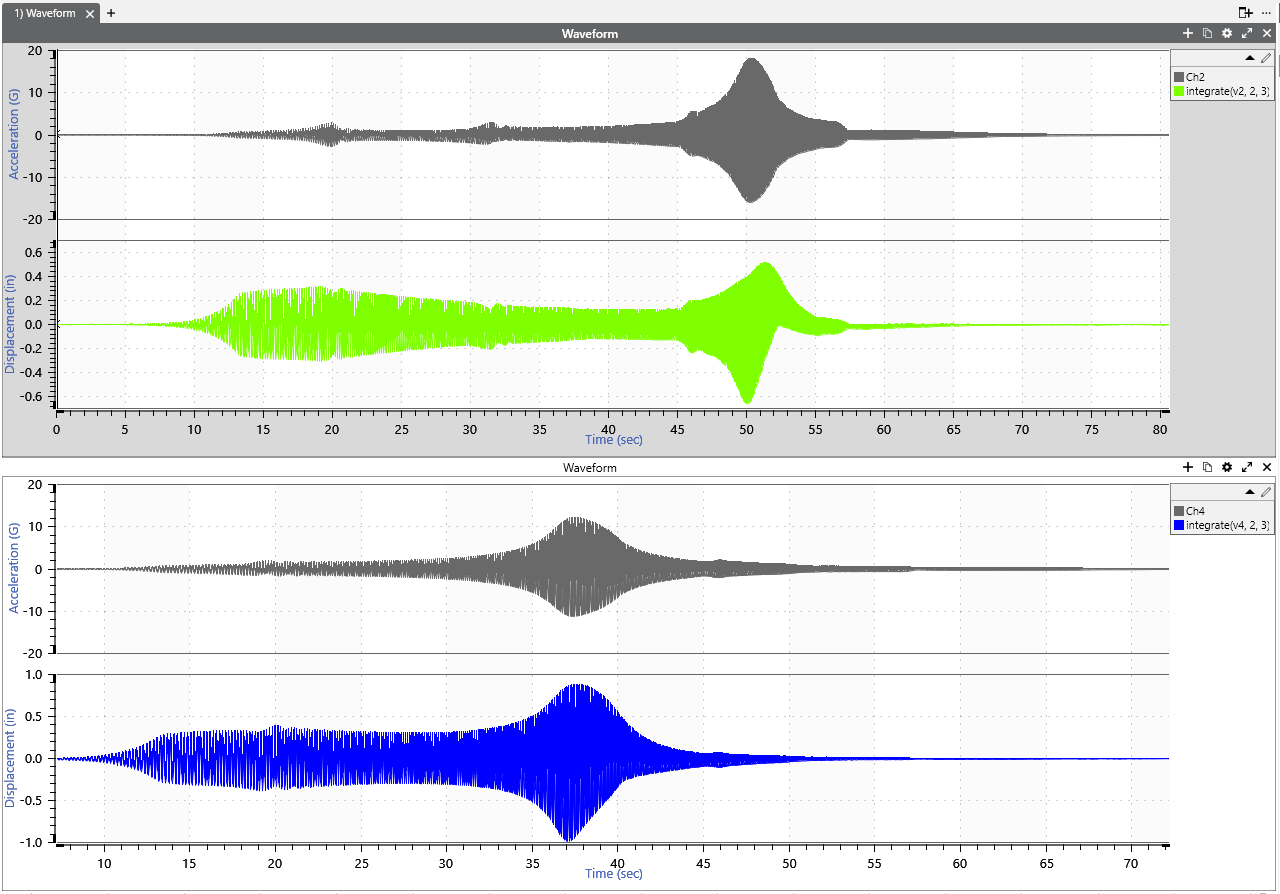
Acceleration waveforms of two channels and calculated displacement waveforms.
Calculating Relative Displacement
To calculate the relative displacement between the calculated displacement waveforms, subtract the integrated formulas. For example, (integrate(v4, 2, 3))-(integrate(v2, 2, 3)).
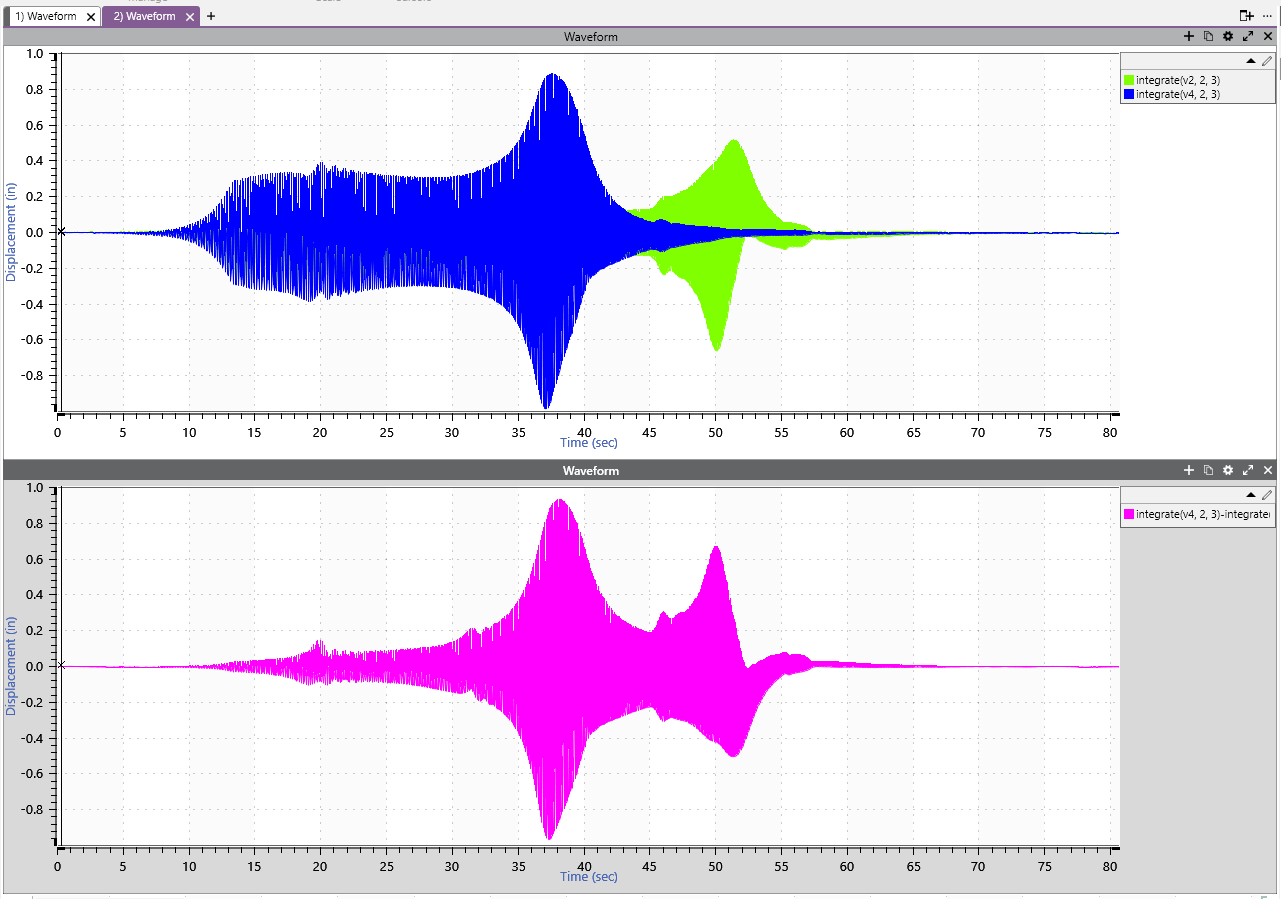
The calculated displacement waveforms (above) and the relative displacement (below).
Post-processing Method Example in MATLAB
The Signal Processing Toolkit for MATLAB is another post-process option. We ran a MATLAB script on the same recording as the previous example for comparison. To access the script, please contact us.
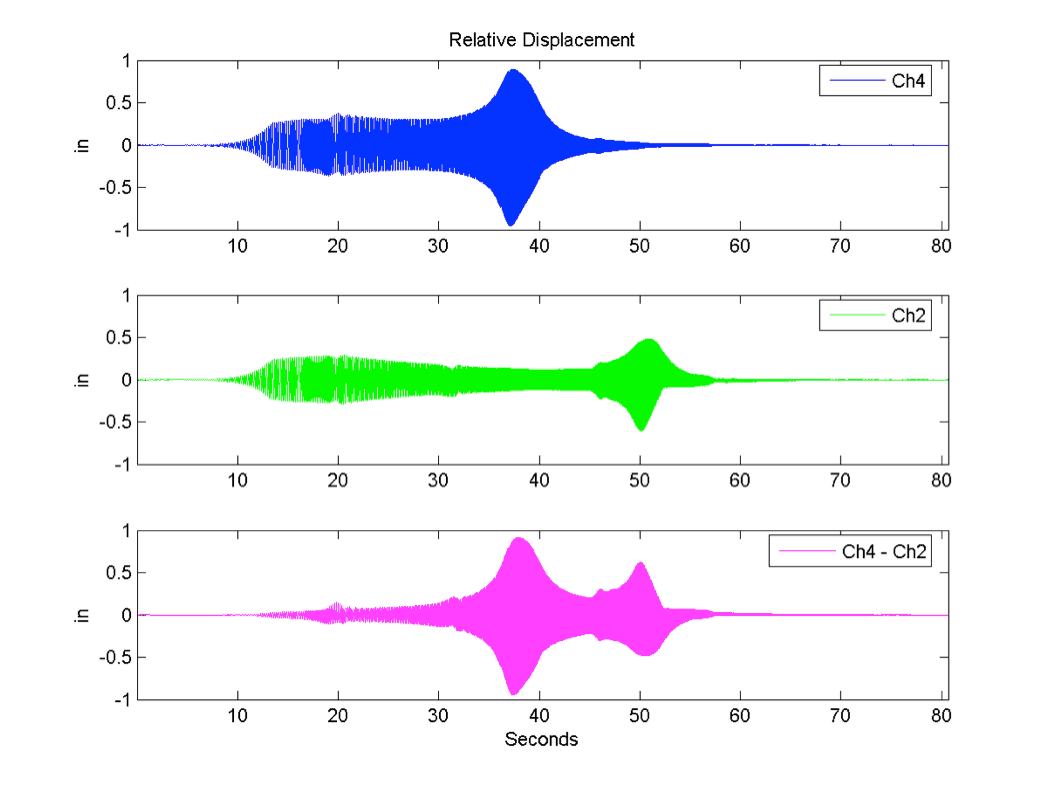
Two displacement waveforms (Ch4 and Ch2) and the calculated relative displacement between the two.
Method Comparison
There are differences in the output of the post-process method and the calculator one. The calculator method only shows the relative displacement. The post-process method also shows the two channels in relationship to each other. Additionally, the post-process method accounts for all the frequencies when calculating the relative displacement.
The graph above shows the displacement waveform for channels 4 and 2 and the relative displacement between the two. It may not be clear from the graph above, but the maximum and minimum values do not occur at the same time. The maximum value of 0.91″ occurs at 37.9 seconds and the minimum value of -0.94″ occurs at 37.5 seconds.
maxRelDisp = 0.9134 maxTime = 37.9397 maxFreq = 11.4167
minRelDisp = -0.9440 minTime = 37.4541 minFreq = 11.2219
For this test, the COLA was configured to output DC voltage proportional to the sine test frequency and looped back to channel 3. Channel 3 was configured as 1,000mv/V with a DC signal. This configuration allowed us to see that the frequency at the time of the maximum relative displacement was 11.4Hz. The minimum relative displacement was 11.2Hz.
In this case, the difference is rather insignificant (only about 5.5 cycles), but it shows that the maximum and minimum relative displacement does not have to occur at the same time.
The post-process examples use a sine test, but this method works with random tests as well.