Random Test Generation
ObserVIEW 2025 features next-level capabilities in test profile generation. Advancements in fatigue damage spectrum (FDS), extreme response spectrum (ERS), and shock response spectrum (SRS) analyses unlock numerous opportunities for test generation and verification.
FDS Combined Damage
Create Field-correlated Test Profiles from Measured Data
The new Random Test Generation option allows engineers to create a random vibration profile from multiple channels or files. The result is a test encompassing some or all forms of potential fatigue. The VibrationVIEW control software supports these profiles, making it easy to navigate from analysis to testing.

ERS: Extreme Response Spectrum
Customers can plot the new ERS trace to validate FDS test acceleration. ObserVIEW can process one or multiple PSD files to create a composite ERS.
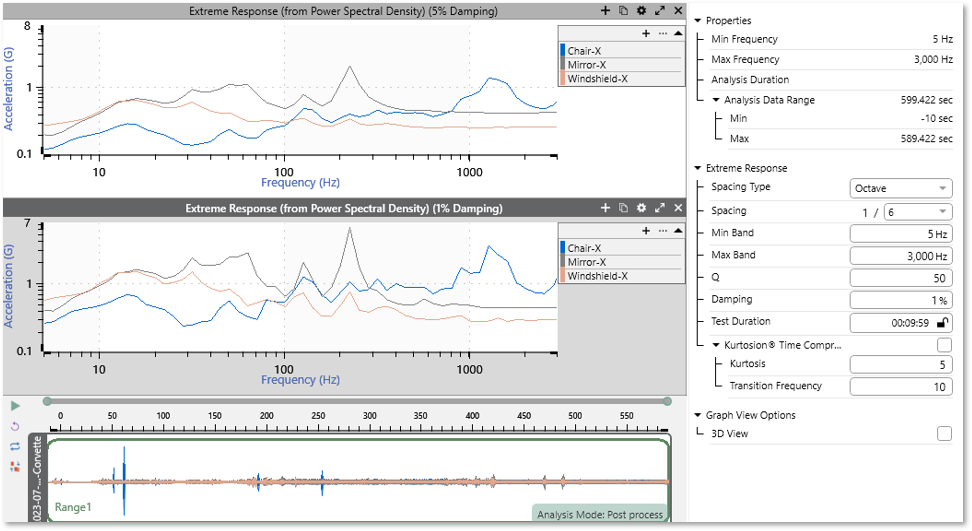
Example Uses
- Determine if an FDS test profile is over-accelerated
- Upload many recordings to analyze, combine the results, and determine if the test is over-accelerated
- Compare the ERS of a PSD to other ERS or SRS traces to calculate the SRS or maximax response spectrum (MRS)
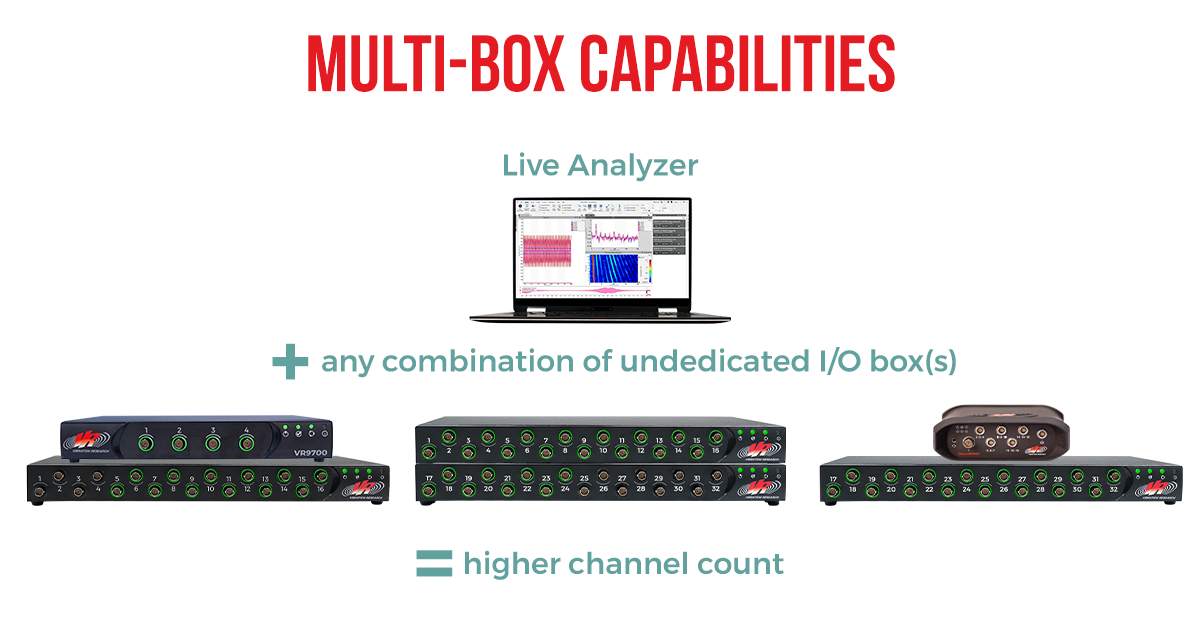
Multi-box Analyzer Systems
In Live Analyzer, record up to 64 channels on a PC using multiple VR devices. Mix the ObserVR1000, VR9700, and VR10500 as a single system or connect multiple devices of the same type, including the VR9500.
A multi-box system can perform all functions available in Live Analyzer, including:
- Analyze, record, and compare data
- Verify shaker tests, including sine reduction and SRS/PSD analysis
- Statistical analysis, monitoring, and outlier evaluation
- Acoustic analysis with octave and SPL time history
- Basic rotational analysis
- Live damage analysis (FDS, SRS, ERS)
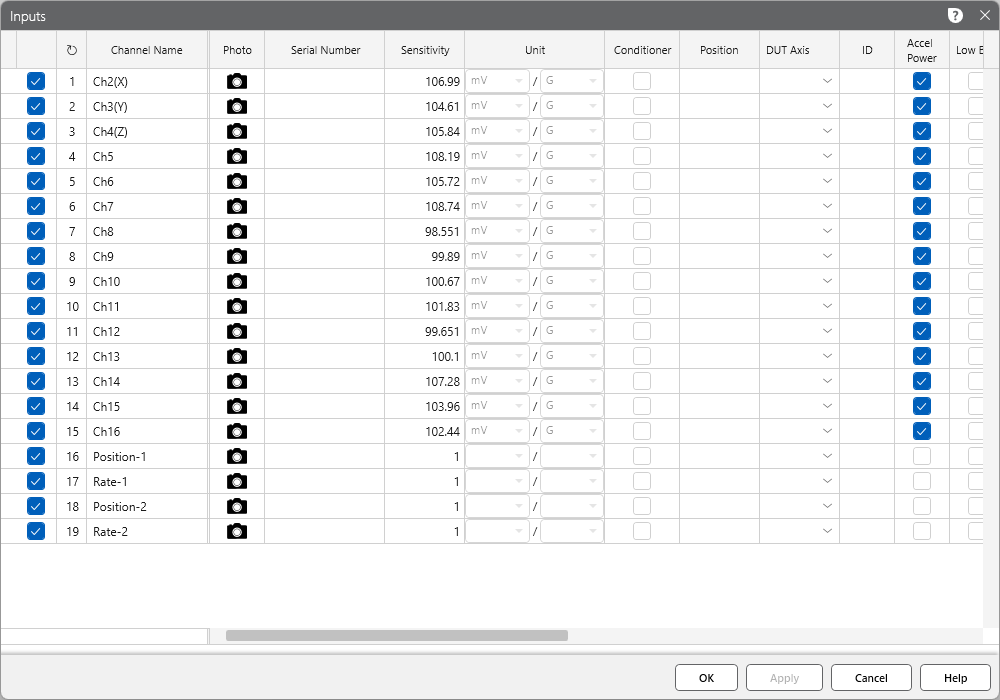
Input Management
Engineers can configure all multi-box system inputs/tachometers in one place. They can also save or load input configurations.
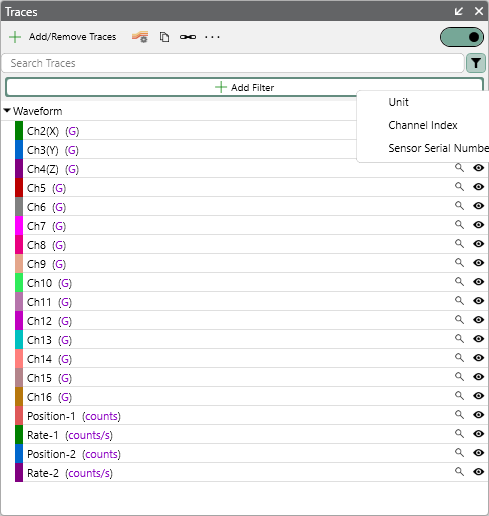
Graph Filters
Versions 2025.2 and newer include an Add Filter option in the “Traces” pane, simplifying graphing when multiple boxes are connected.
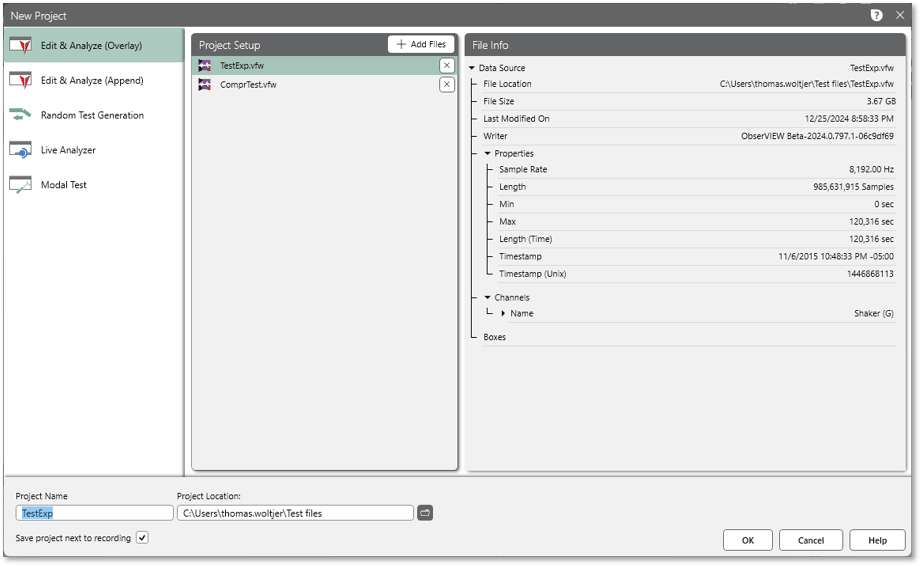
Multiple Waveform Overlay Analysis
The Analysis Ranges pane allows customers to add multiple analysis ranges to a project and easily navigate between them rather than create a new project for each data range of significance. In version 2025, analysis ranges support multiple waveform files in the same project to overlay/combine spectrums. The option is also accessible when creating a new project and in the Random Test Generation option.
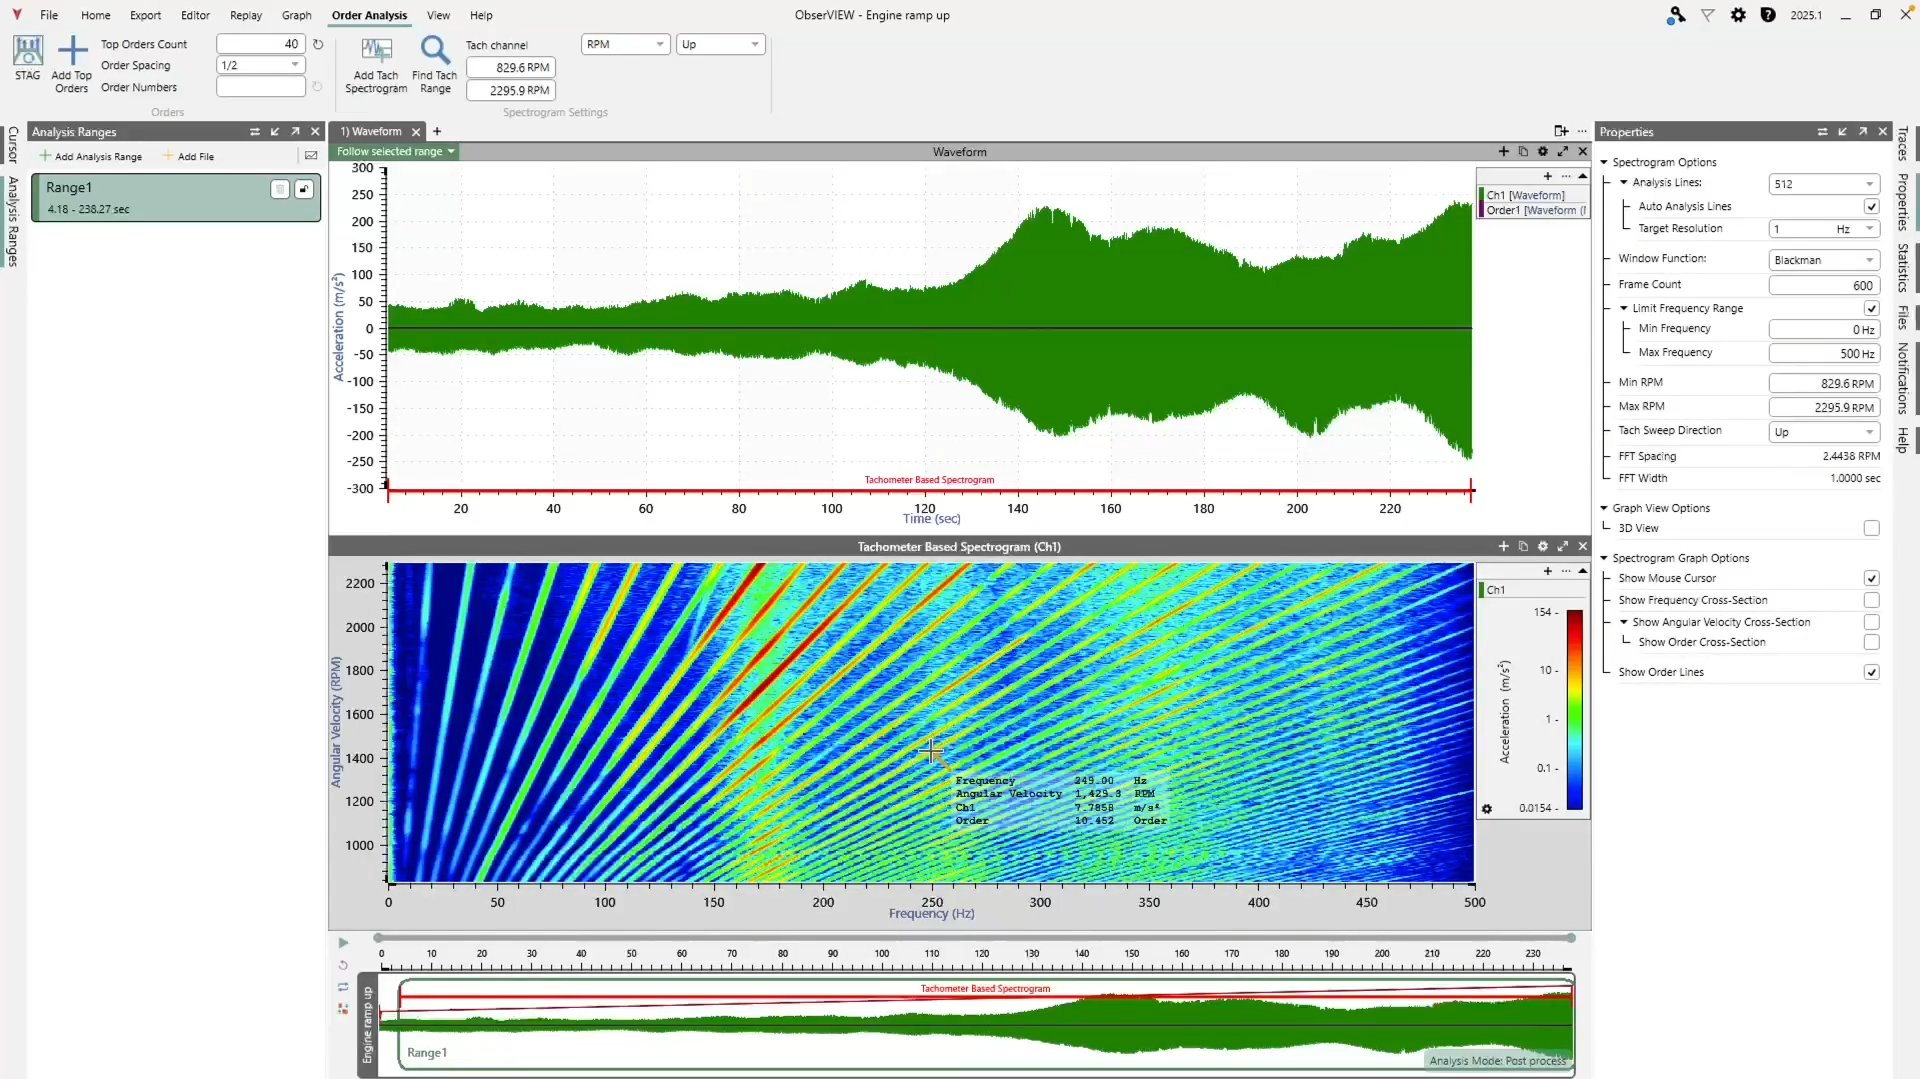
STAG Updates
Compute FDS from Random Background Vibration in STAG
Sine Tracking, Analysis and Generation (STAG) generates sine-on-random test profiles from field recordings. It separates rotational content from background random vibration, processing the sine and random content separately before generating a single test profile.
ObserVIEW 2025 can now compute an FDS from random vibration (rather than exporting the data to VibrationVIEW), performing all processes within one software program and streamlining the test generation process.
Generate a Reference RPM Trace
STAG uses an RPM reference trace and sensor data to separate the rotational content from the background random vibration and extract orders of interest. ObserVIEW 2025 makes it easy to generate an RPM trace if an RPM recording is insufficient or not possible.
Reference Multiple Data Ranges in Math Traces
ObserVIEW 2024 introduced Analysis Ranges, where users can add multiple analysis ranges to a project and easily navigate between them. In 2025, the Math Traces feature supports equations with multiple data ranges.
Floating License Support
ObserVIEW 2025 includes a “floating license” mode for more convenient software management. The floating license is one shared key for a specified number of concurrent users accessing any PC on the same network. Individual access resets after 24 hours of inactivity with the server, returning to the shared license pool for other users to access.
Additional Features
- Move satellite maps from Bing to Azure
- Date/time axis and PDF graphs out of feature preview
- New Math functions
- Chinese Help file translation
Change Between Projections of Complex Data
Customers can now select complex layouts from the Graph View Options: Bode, Complex, and Layered.
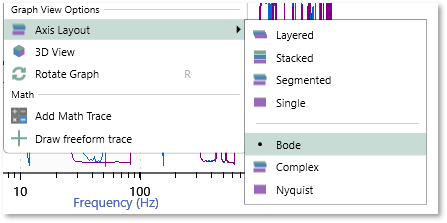 These options are available for any graph with complex data, including transfer function, coherence, and cross-spectral density graphs.
Start using ObserVIEW 2025
VR users with a valid Upgrades and Support Agreement can upgrade to the latest version for free. Anyone can download a free demo version.