Recreational vehicles (RV) withstand similar conditions to road vehicles but have many more components, all susceptible to vibration fatigue. As the primary use for these vehicles is leisure, a comfortable, quiet, and safe ride is the manufacturer’s top priority. Recording vibration data while the RV is in use helps create accurate profiles for component testing.
Three locations in a 2018 Tiffin Allegro (32ft – Model 325A) were monitored in use to determine the source of noise noted by the owner. Manufacturers can perform similar analyses before distribution to improve user experience and extend the life of the components.
Sensor Locations
When choosing sensor locations, we considered the locations with the potential to have the most vibration and noise and those of interest to the RV owner.
The owner said there was a rattle/noise from the exit door during travel. Additionally, the bathroom door had space to vibrate back and forth when latched, causing noise. Similarly, the bathroom skylight cover had space to vibrate in all three planes. We selected these three locations based on what we anticipated to have the most potential for noise and vibration.
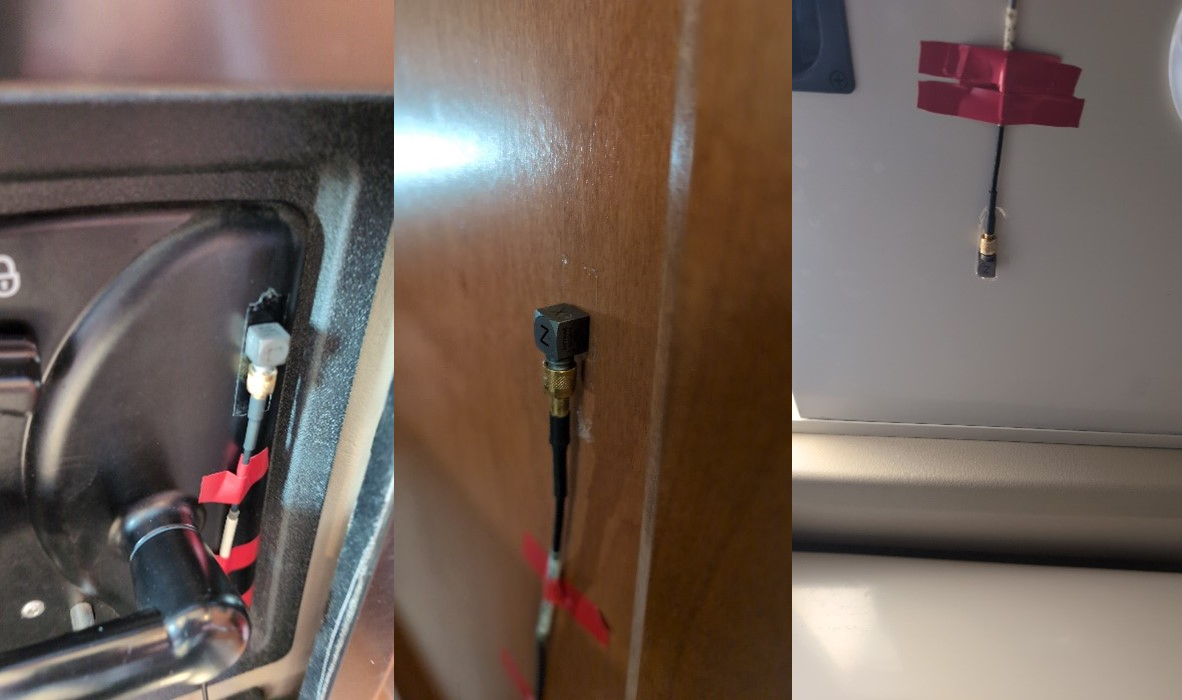
Figure 1. From left to right: RV exit door; RV bathroom door; RV bathroom skylight cover.
The owner also indicated that some models of the 2018 Tiffin Allegro had refrigerators that needed replacing. We wondered if road vibration might be contributing to this issue. We monitored the vibrations from the RV transmitted to the refrigerator by attaching an accelerometer to a mounting bracket below the refrigerator.
Finally, we inquired about the noise, vibration, and harshness (NVH) environment in the RV’s rear bedroom because the room was beyond the rear wheels of the RV. (Would the RV’s rear suspension provide a smooth ride, or would there be significant vibration and noise in this location?) We mounted an accelerometer on the bedstand in the rear bedroom to gather preliminary measurements in this area.
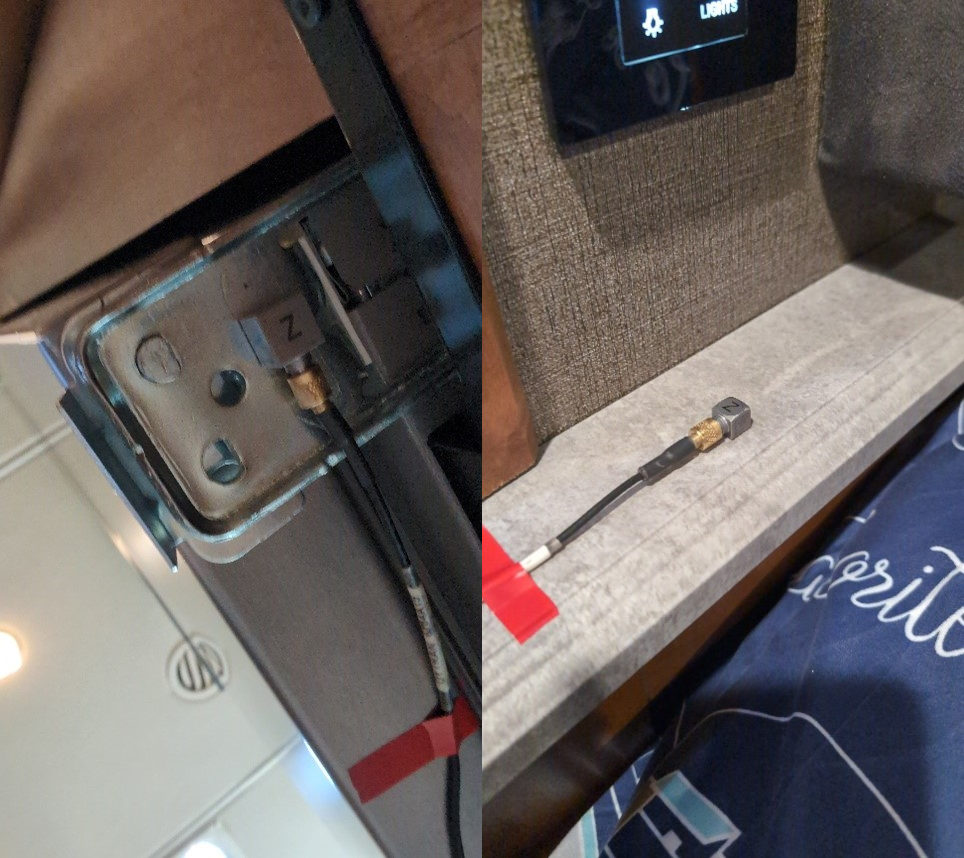
Figure 2. From left to right: RV refrigerator bottom mount; RV bedstand ledge.
Generator Test
After the test drive, we instrumented the onboard generator and ran it to observe the vibrations in the RV when the generator was operating.
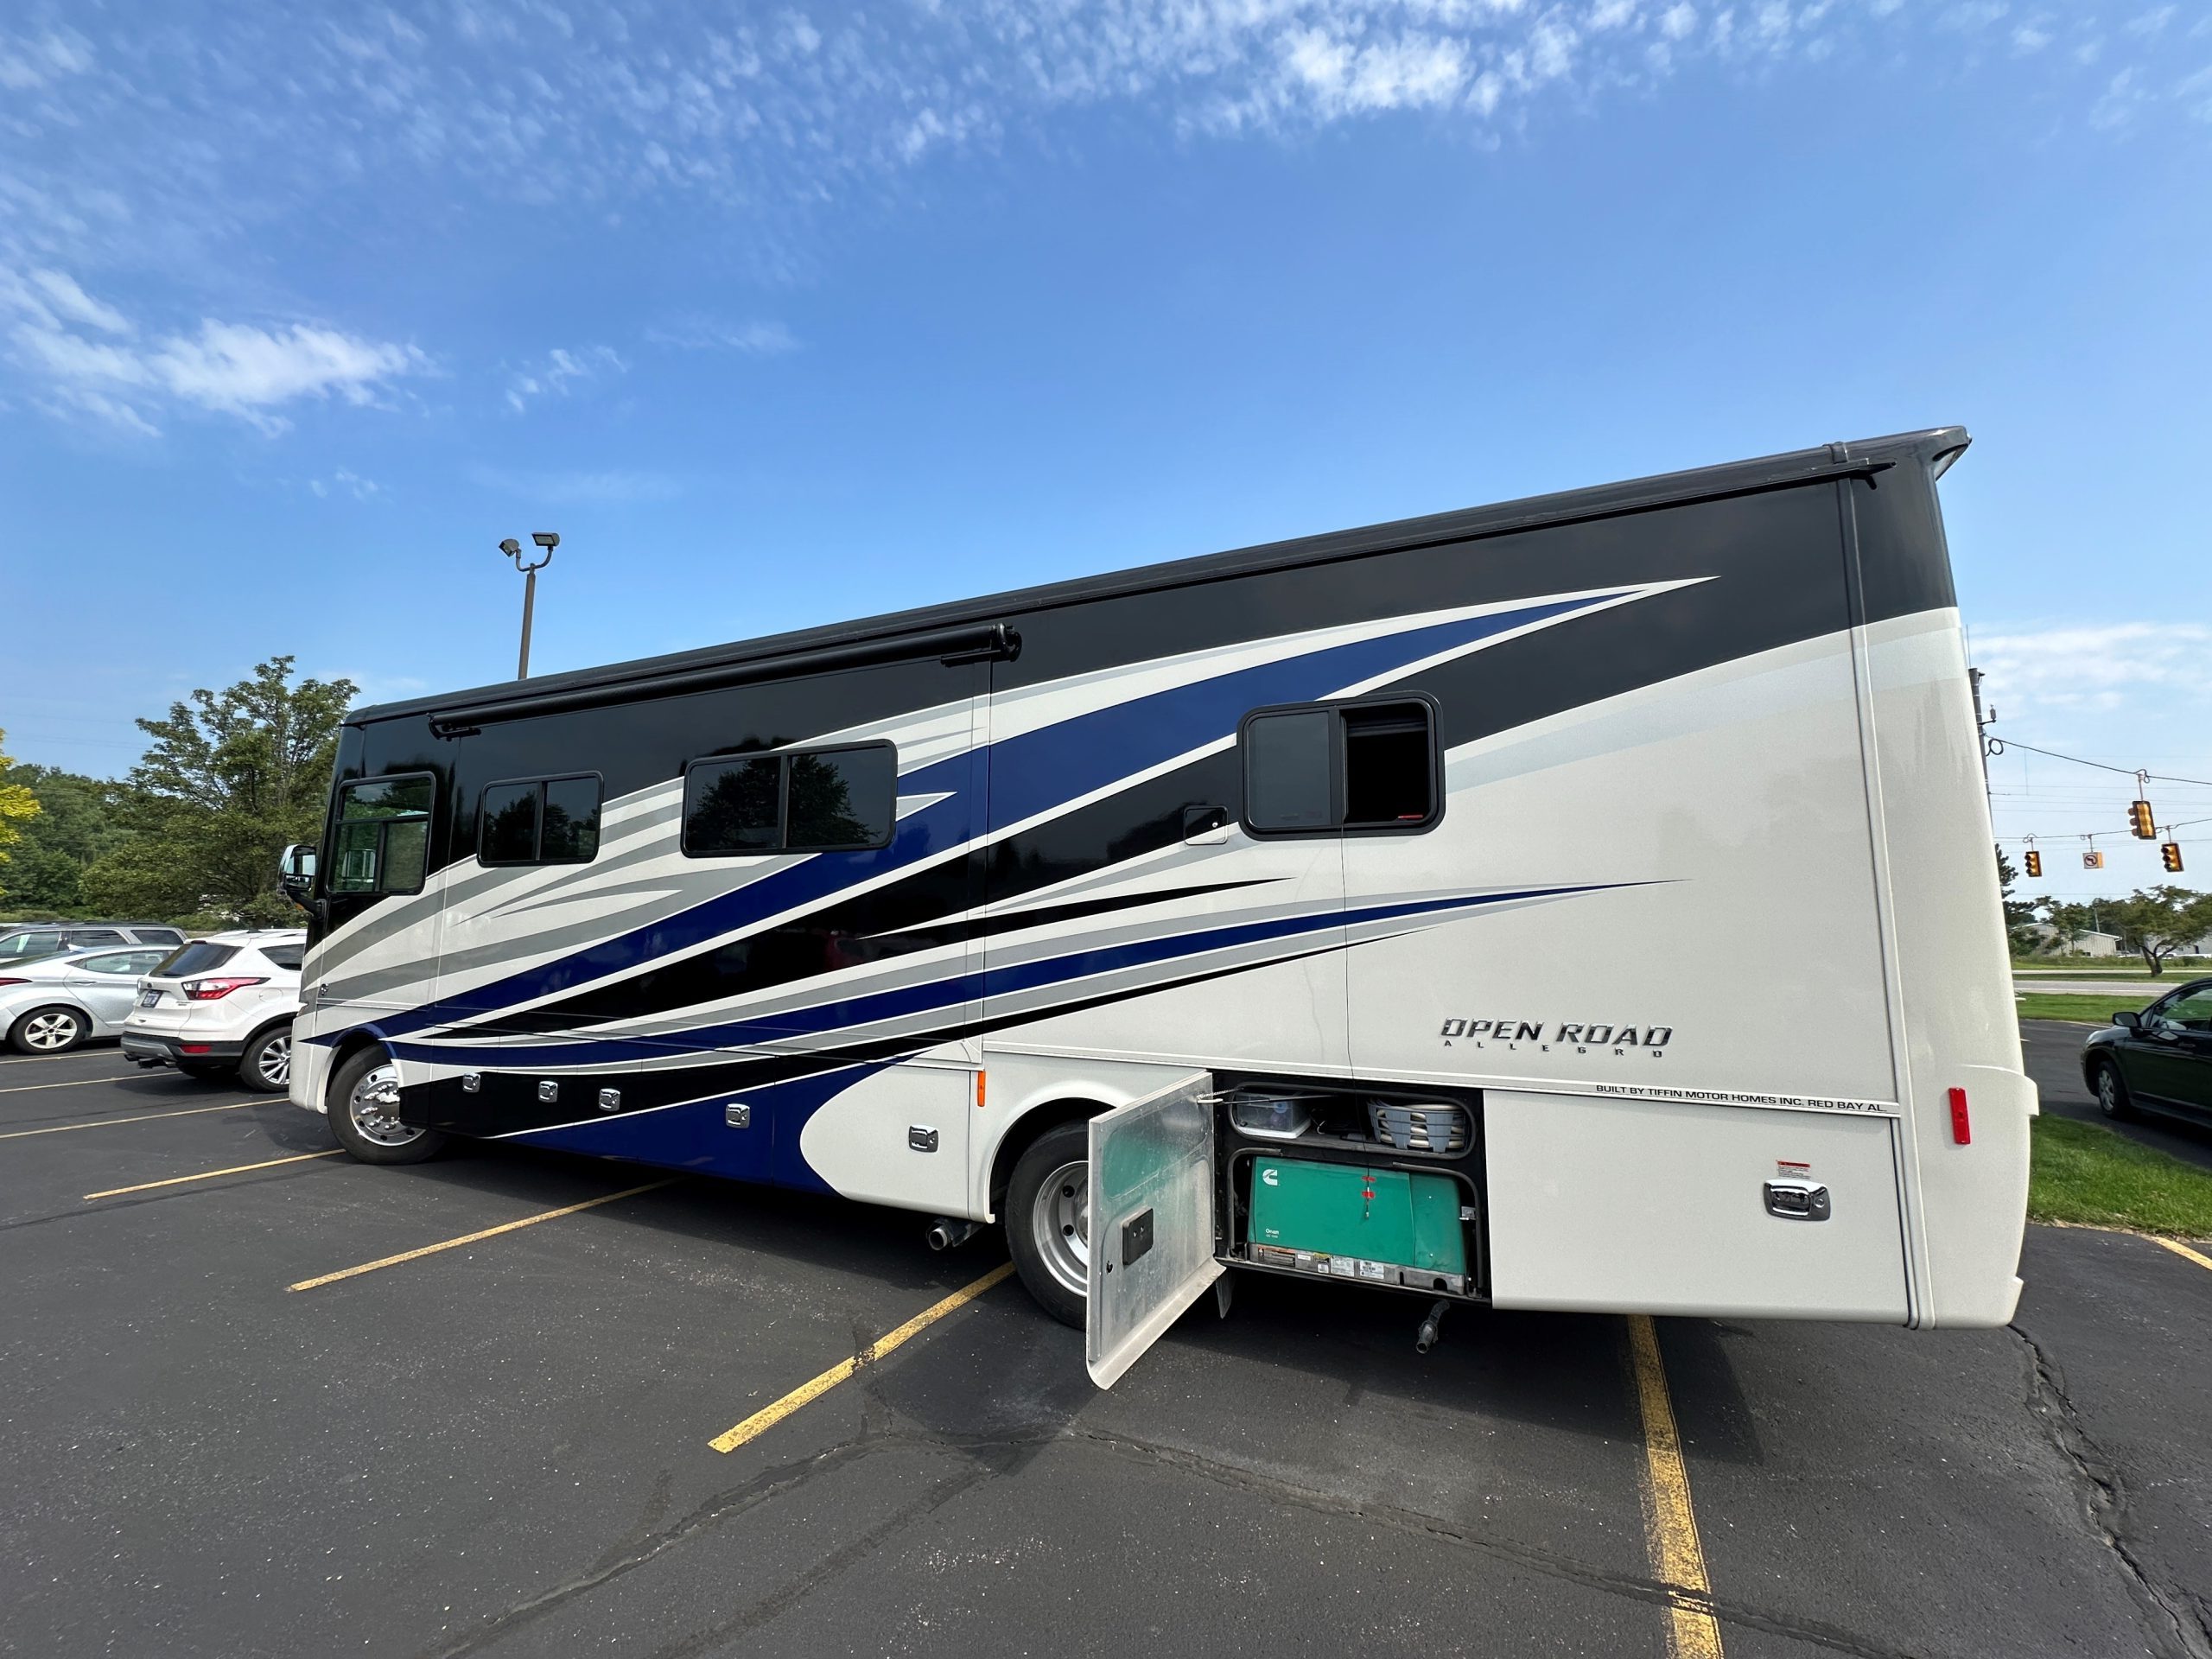
Figure 3. Accelerometer on the RV Cummins Onan 5500 generator.
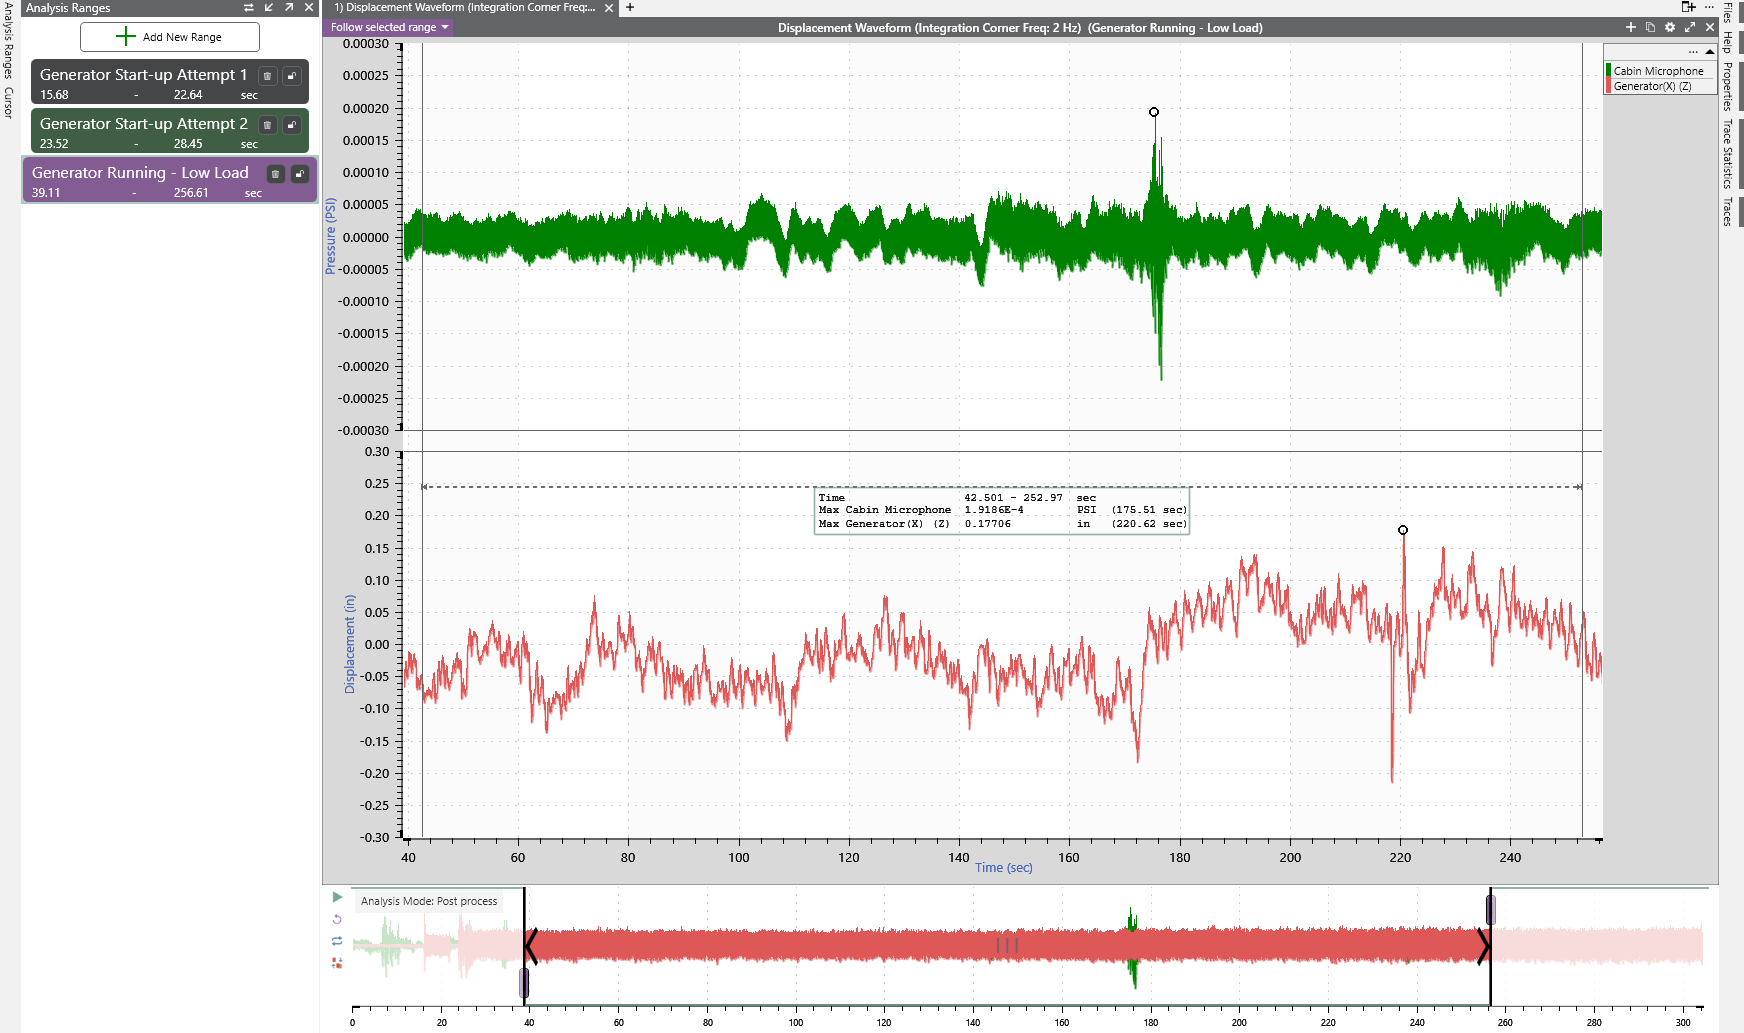
The generator had a low displacement while running, with a maximum of 0.177” the vertical plane.
The USA National Park Service (NPS) prohibits the use of generators with noise levels greater than 60 dBA at 50 feet. RV owners (and their neighbors) want RV generators to be as quiet as possible.
Data
Generator Data
The Cummins Onan 5500 generator is rated at 69 dBA at 10 feet at medium load. Our data shows that the Onan 5500 generator produced 49 dBA at 10 ft away at low load. This NVH is significantly less than expected.
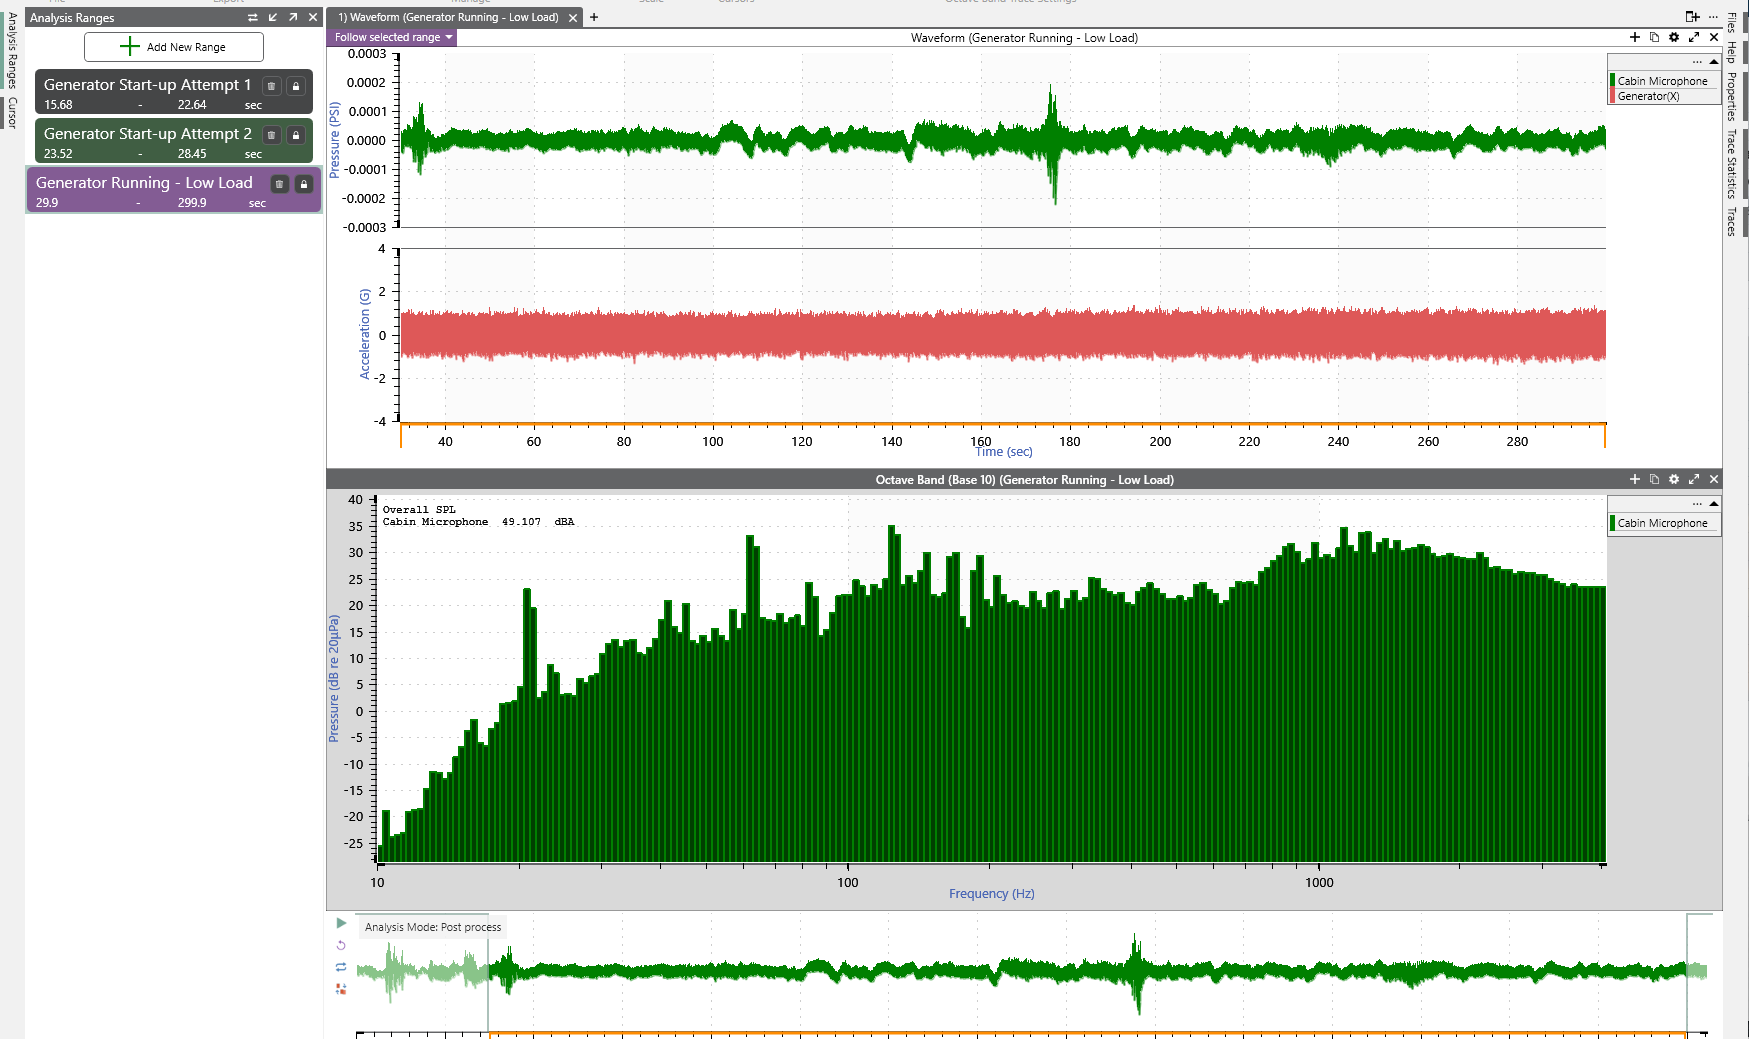
Figure 4. RV generator (Cummins Onan 5500 with low load) decibel level measured inside the RV bedroom (with window open) at 10 ft away from generator (49 dBA).
The generator had a low displacement while running, with a maximum of 0.177” the vertical plane.
Road Data
An RV can produce significant noise during travel. We narrowed our analysis to the RV noise on a smooth section and rough section of highway (driving at 70 mph). The noise level during the rough road section was 76.256 dBA. We compared the measurements to NVH data collected from a Tesla and BMW on the same section of road. The Tesla NVH was 73.520 dBA, and the BMW was 70.922 dBA.
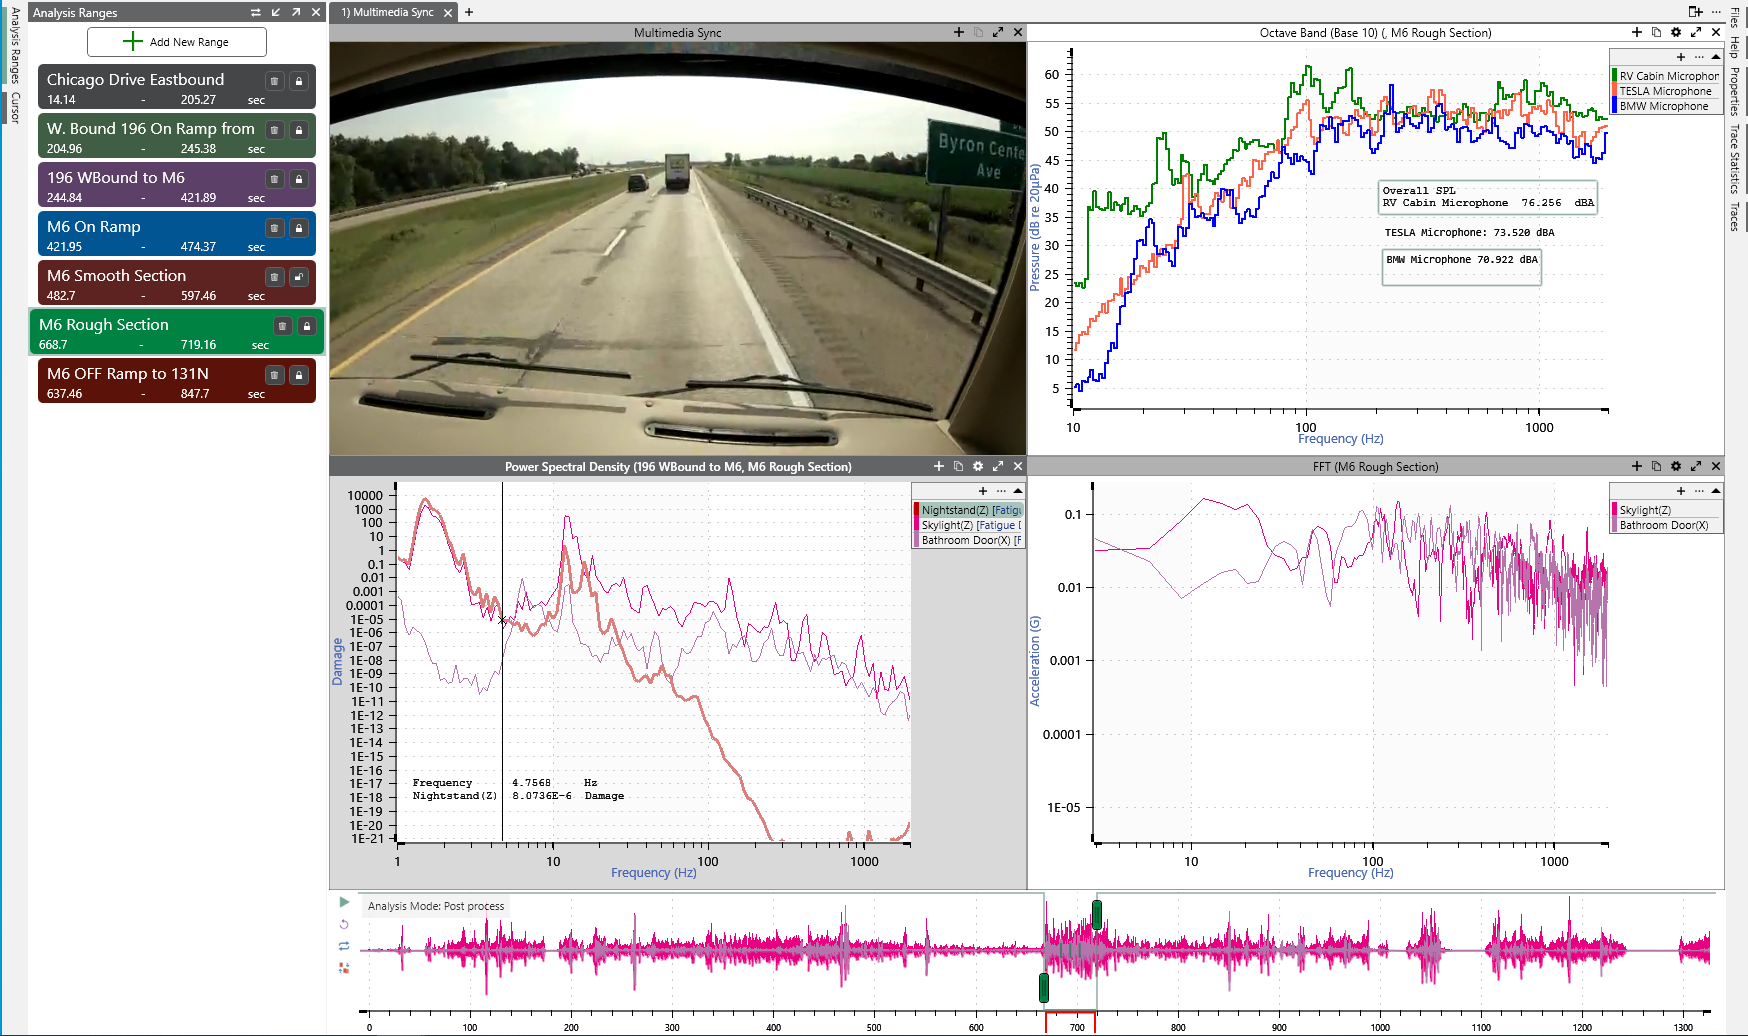
Figure 6. Decibel levels of RV cabin, Tesla, and BMW compared for same section of road. The RV cabin was noisier than the compact sedan.
Of the five environments we recorded, the skylight cover (z-axis) and the bathroom door (x-axis) produced the most vibration, as expected. The skylight cover had space to vibrate in the vertical axis. It also had space to vibrate in the forward (y) and side-to-side (x) axes, but these axes would be less stimulated by the vertical motion of the RV on the rough road. The bathroom door opened in the x-axis. It was not firmly latched but had space to vibrate in that axis.
Figure 7 displays the fast Fourier transform (FFT) and the fatigue damage plots for those two environments. The nightstand (z-axis) is shown for comparison purposes.
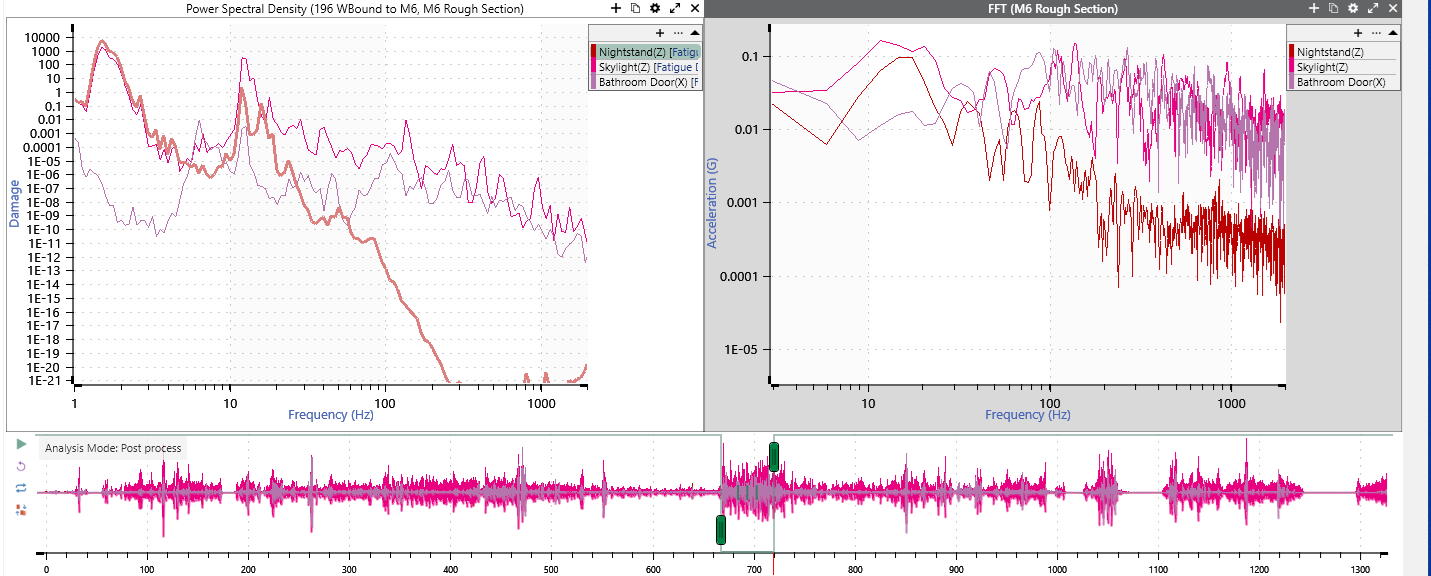
Figure 7. FFT and fatigue damage of the nightstand (z-axis), skylight (z-axis), and bathroom door (x-axis) for the RV on a rough section of road.
The RV owner thought the cabin door (x-axis) could be a main contributor to the NVH, but the data on the rough road section demonstrates that other sources contributed more to the RV noise than the cabin door.
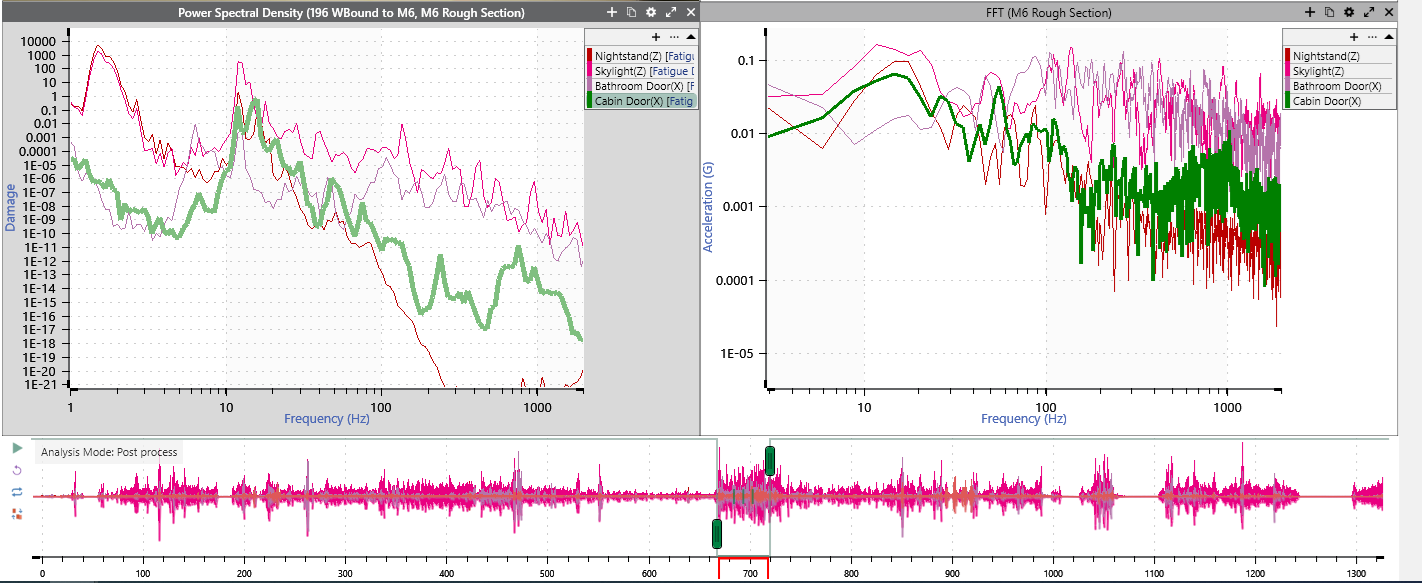
Figure 8. Cabin door (x-axis) FFT and fatigue damage compared to other environments. The cabin door does not contribute to the vibration and noise as much as the bathroom door and skylight cover. Data measured on a rough section of highway (70 mph).
Conclusion
Overall, the noise and vibration in the RV was relatively controlled. The skylight cover (z-axis) and bathroom door (x-axis) produced the most vibration and noise, which we had anticipated.
Looking at the various sets of data, we found that the measurements on the rough road was the most worthwhile to study. The smooth road section should also be examined with the same graphs, but we predict it will produce similar results (less noise and vibration, but the skylight and bathroom door will be the noisiest).
A Note on Sensor Application
The RV tested was in excellent condition. When applying our sensors to the interior of this motorhome, we did not want to leave behind residue that would damage or compromise its interior. We elected to use 3M double-sided tape as the adhesive for our accelerometers. The adhesive performs as well as other adhesives (wax, Kapton tape) but leaves no residue behind. It is easy to apply and easier to remove at the end of the test.

