Data Recording
In the Lab or On the Road
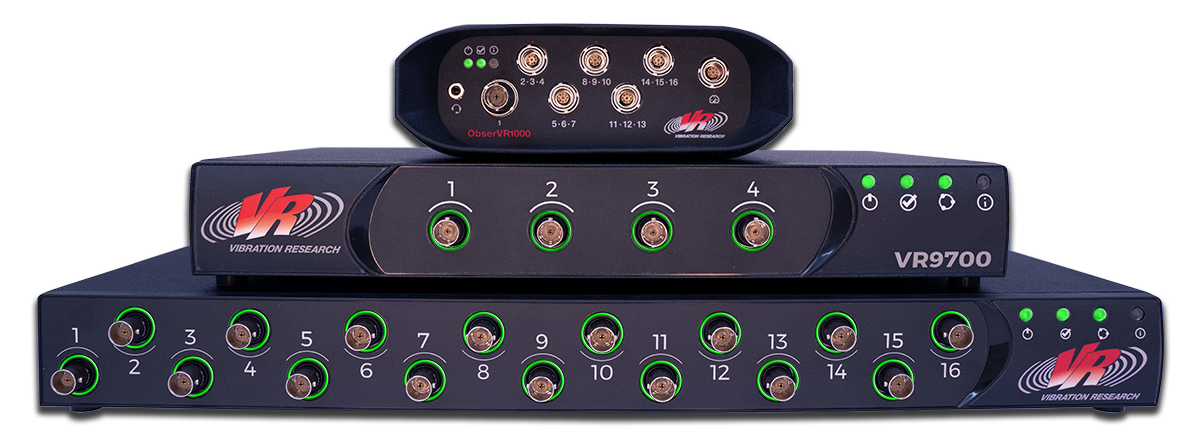
Control the ObserVR1000 data acquisition system remotely with the VR Mobile application, which runs on a smartphone or tablet using a WiFi connection. Set up, monitor, and modify field data recording without a wired configuration.
- Tachometer inputs
- GPS capabilities
- 6+ hour battery life
- On-board storage
Fatigue Testing
Creating Profiles from Field Data
VibrationVIEW includes several methods of test profile development that use recorded data to replicate the operation of a component. The result is a test profile that closely reflects—or is the equivalent to—the field environment.
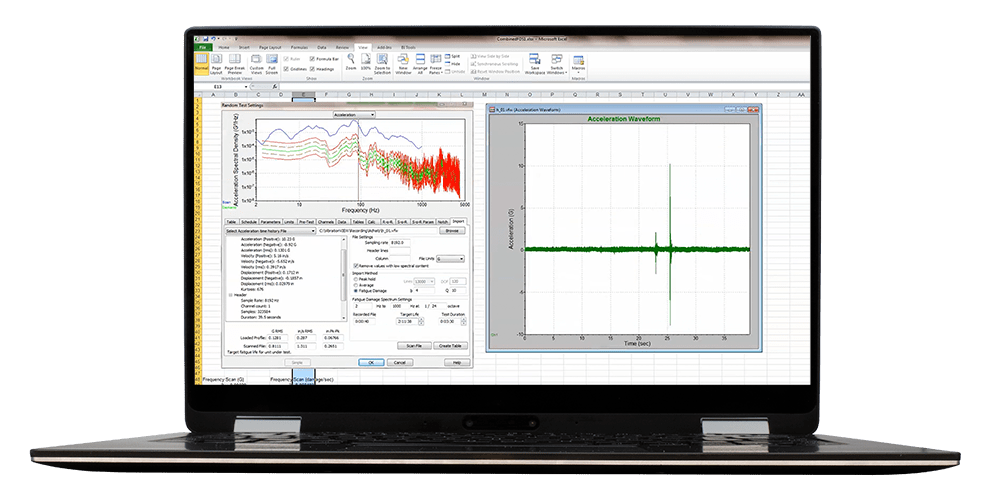

FATIGUE DAMAGE SPECTRUM
Use recorded data to create an accelerated random test that represents a lifetime of fatigue damage.

FIELD DATA REPLICATION
Reproduce recorded field acceleration measurements on a shaker. The software performs an iterative time-history playback to replicate waveforms.
![]()
SINE TRACKING, ANALYSIS AND GENERATION (STAG)
Generate an accurate representation of an environment with dominant sinusoidal vibration and background random vibration, such as an engine environment.
VibrationVIEW Software Package
Sine
Random
Shock
Sine Resonance Track & Dwell (SRTD)
Field Data Replication (FDR)
Fatigue Damage Spectrum
Instant Degrees of Freedom (iDOF)
Random Import
Evaluate Comfort
Build and Run a Shaker Test Profile
The bike tires and suspension system helps to dampen vibrations, but new parts add weight, and the motor introduces vibration. E-bike product development requires testing to evaluate comfort compared to recommended values.
- Generate vibration tests from recorded or historical data, including random, sine-on-random, and shock
- Measure amplitude at contact points such as the seat and handlebars in the x, y, and z directions
- Evaluate data with a weighted RMS value according to ISO 2631
- Output customized reports manually or on a schedule
- Examine the coupled effect of the power drive and road conditions with a transmissibility plot
Order Tracking and Analysis
Examine Rotational Behavior
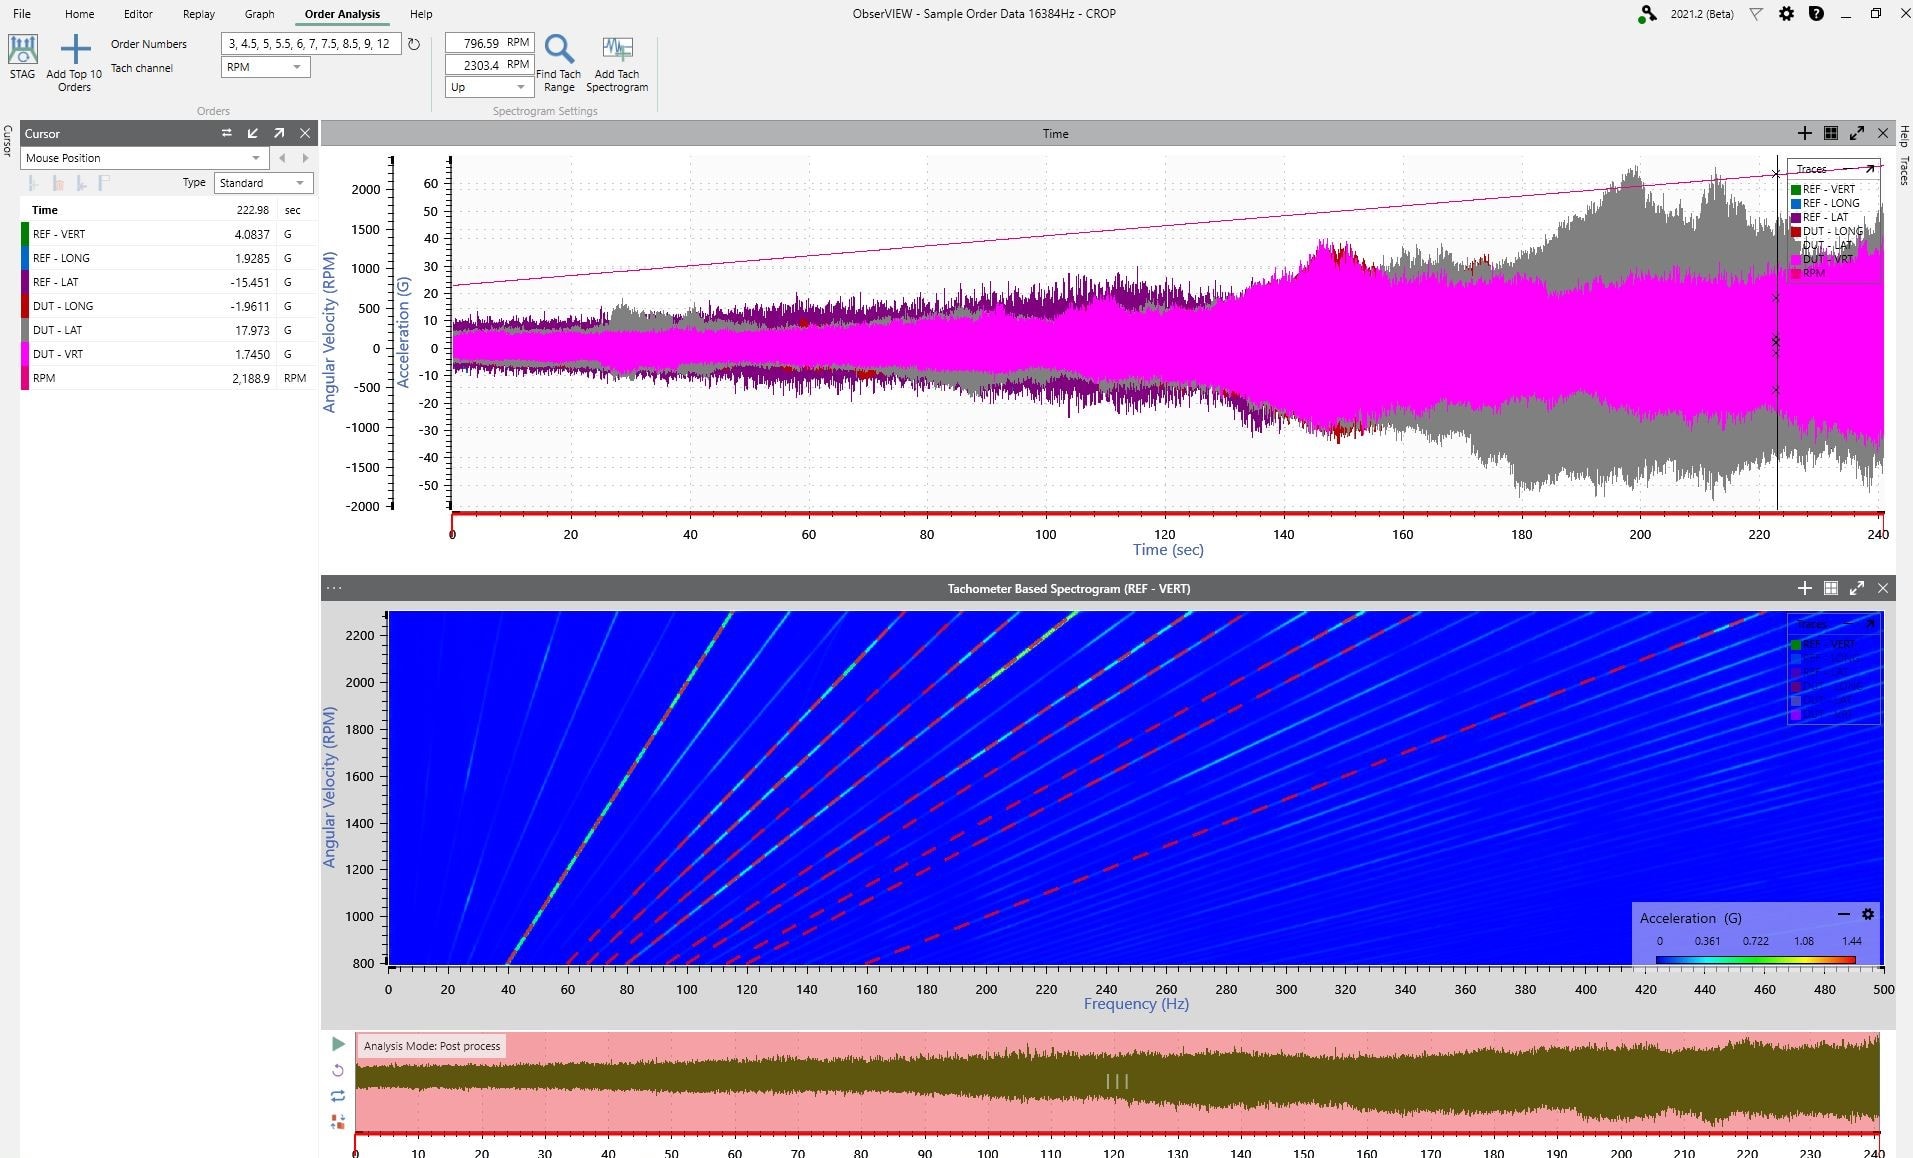
Analyze the response of the e-bike’s motor system to different RPMs and identify how the component’s vibration contributes to the overall level. Order analysis helps locate and prevent product failure relating to rotational sources of vibration.
- Analyze the noise and vibration of a motor or other rotational component
- Run a ramp up or coast down to evaluate the effects of change in speed
- Separate rotational content from the background random
- View the strength of a signal over time/angular velocity at various frequencies
- Compare data in different domains
E-Bike Analysis with ObserVIEW Math
ObserVIEW’s Math feature plots a user-defined math equation on a time or frequency-domain graph. It allows the user to implement custom math operations not defined by the current graph types.
Math channels allow for per-channel filtering, channel combining to create new channels in units of angle, or creating synthesized waveforms.
Math traces allow for templated spectrum math analysis: create an envelope or average PSDs, create trace ratios for comparison, analyze average control on recordings, or compare data to pasted tolerance lines.