All Software Features

Octave Analysis

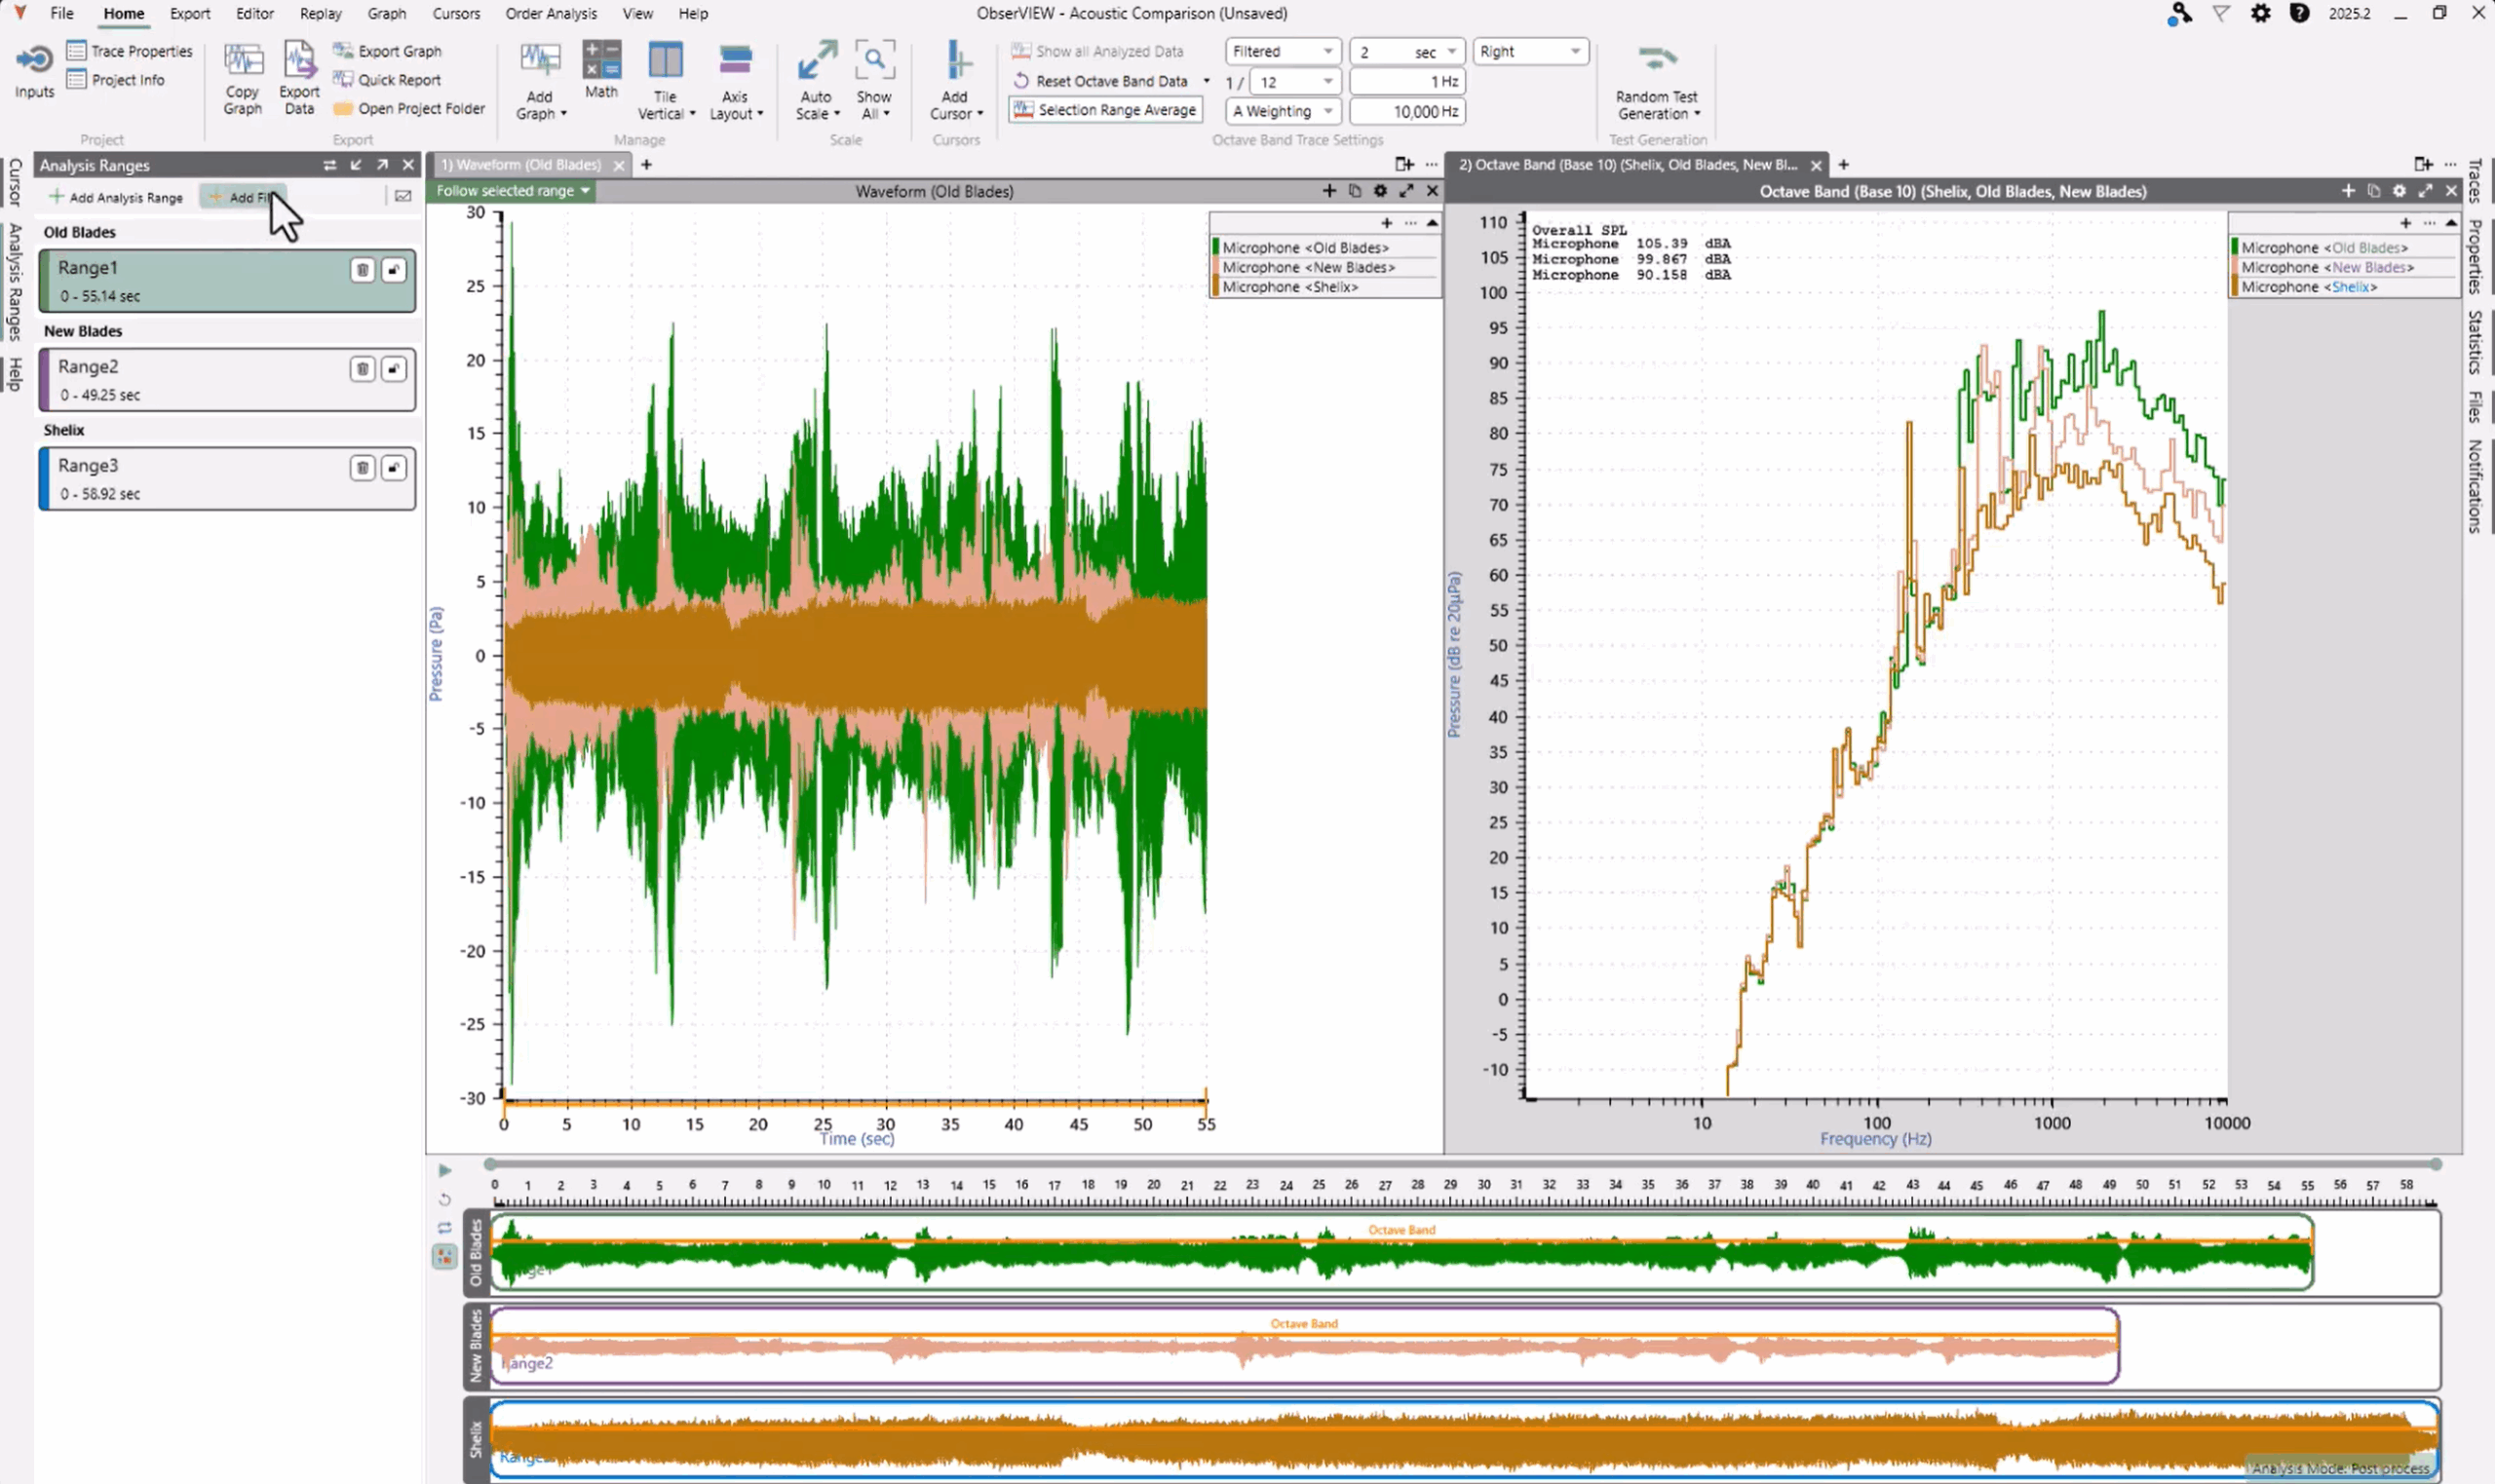
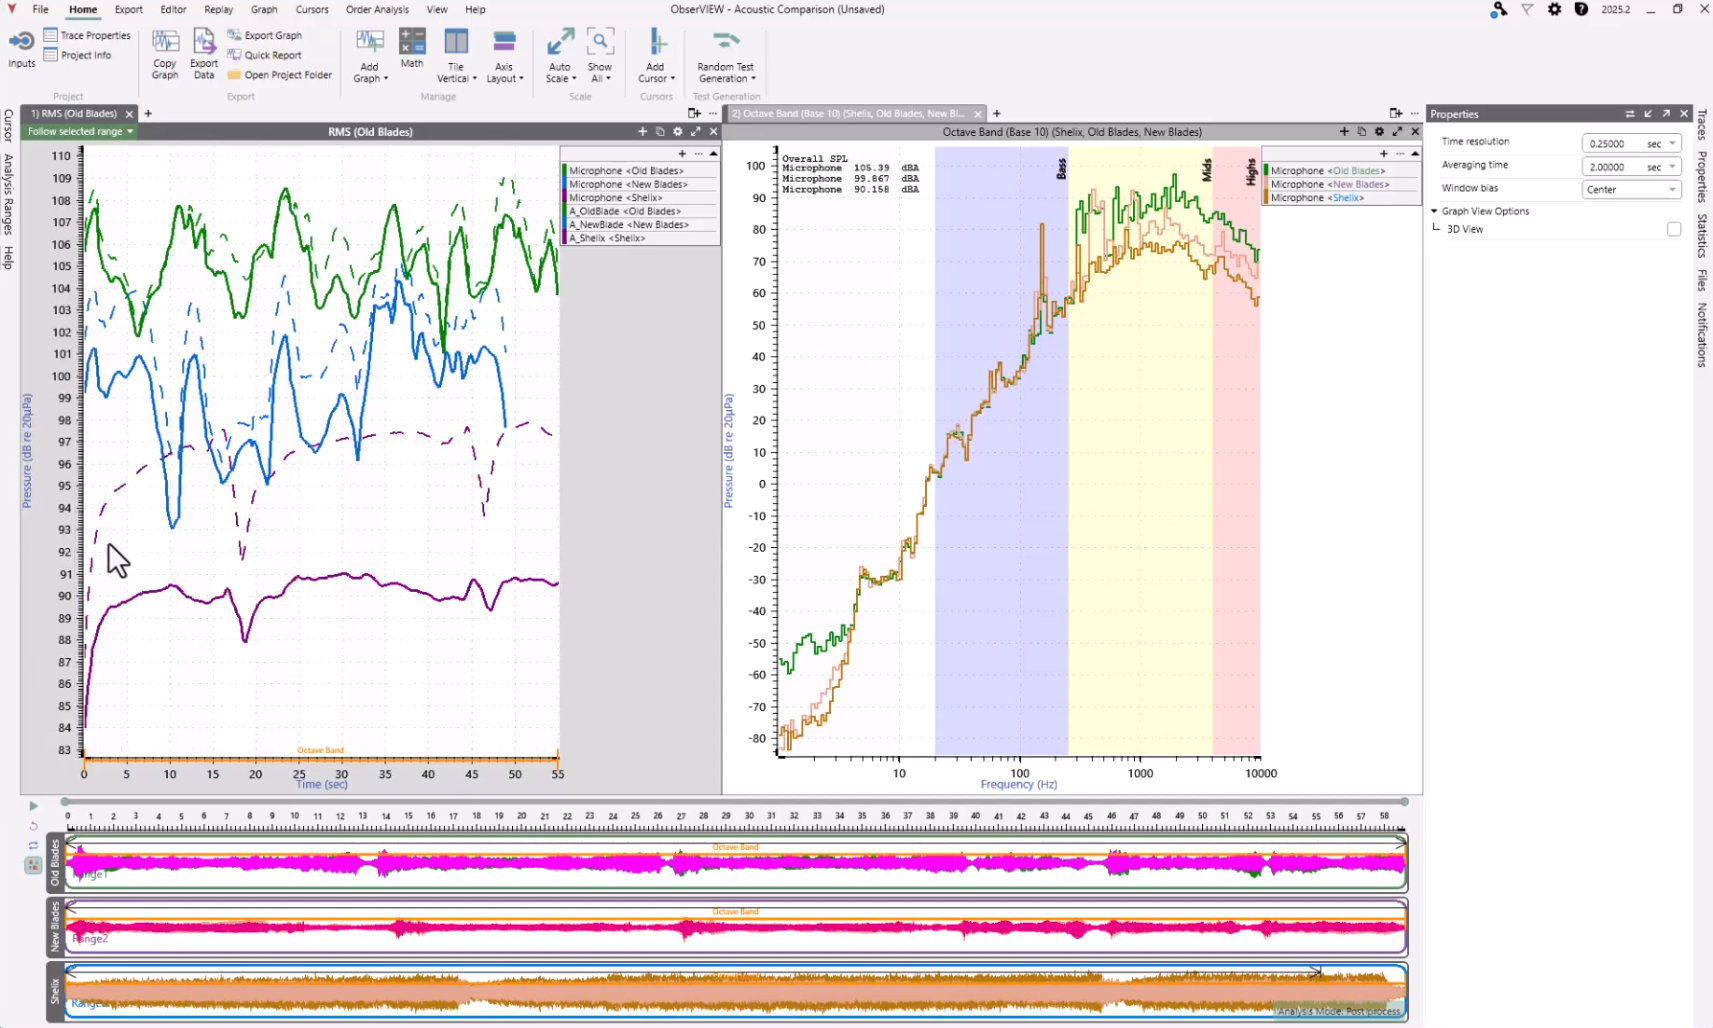
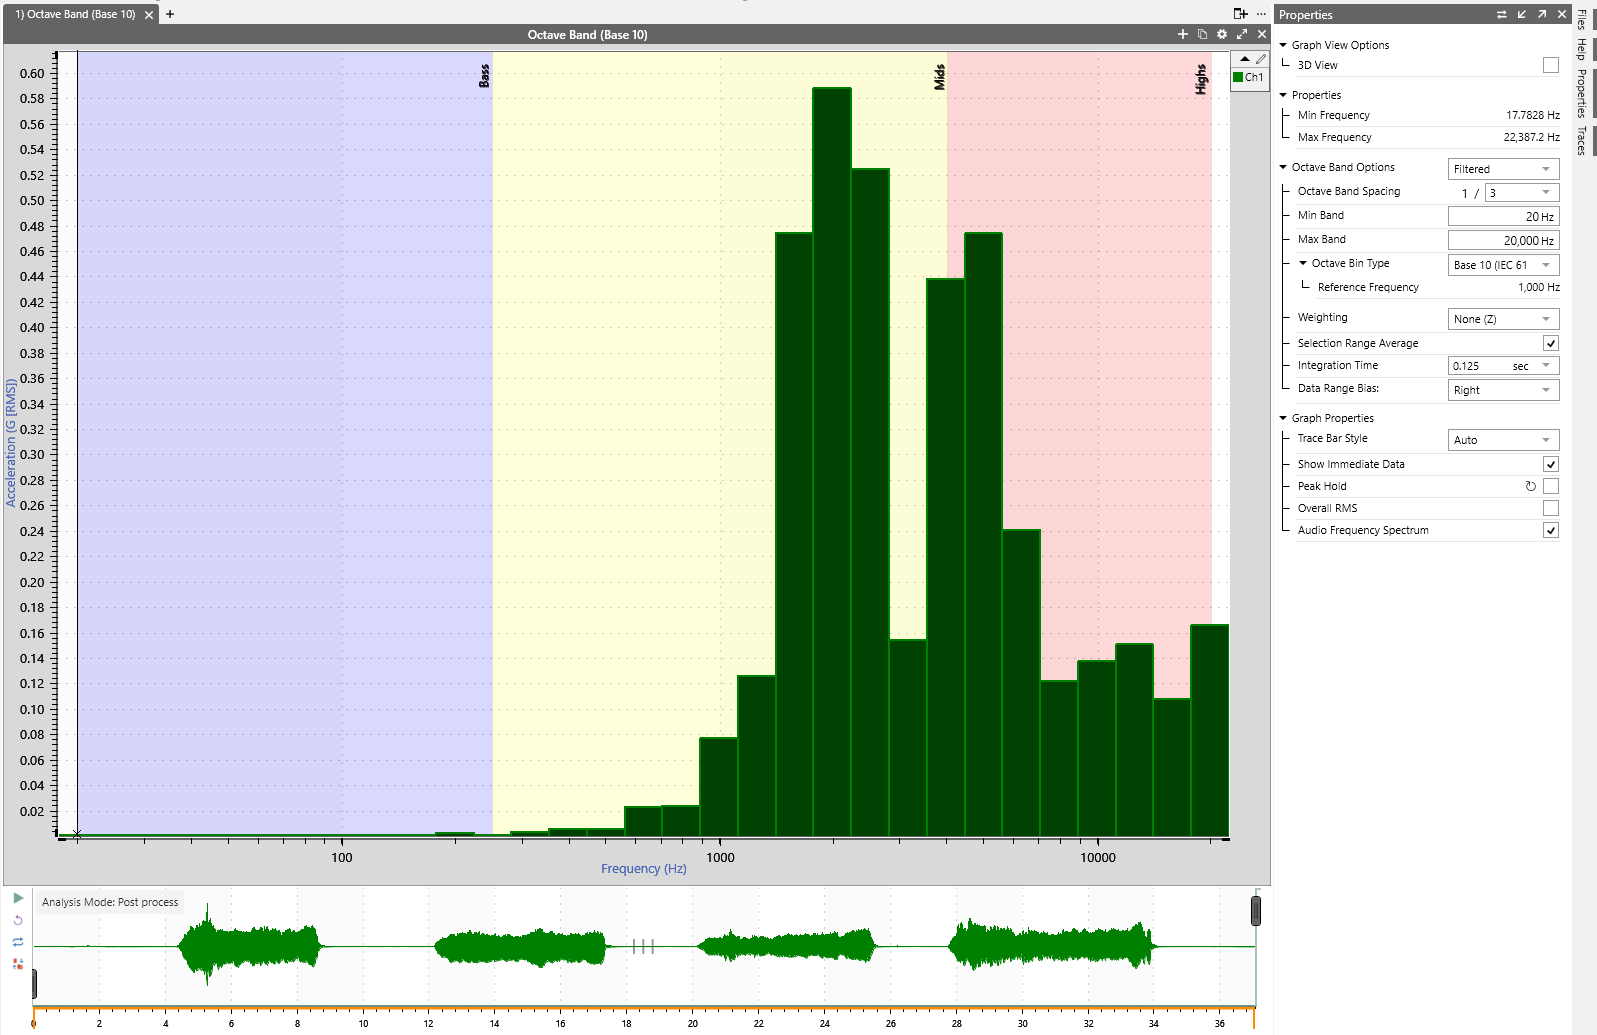
Perform live or post-process octave analysis. ObserVIEW generates octave bands with an 8th-order filter to meet IEC 61260-1 Class 1 filter specifications. It performs filter-based analysis and can apply A and C frequency weighting, linear and exponential averaging, and peak hold.

Download Demo All Software Features

Evaluate Sound & Vibration

The Octave Analysis software allows for the objective evaluation of sound and vibration by grouping the frequencies of an acoustic signal into “bins,” often to reflect how humans perceive the frequency spectrum.

The software program filters the acoustic signal and measures the sound pressure levels at the output. Then, you can apply averaging and weighting techniques in the frequency domain to correspond to their desired sound evaluation measurements.

Learn More

Software Highlights

  • Live or post-process octave analysis
  • 8th order octave band filter to meet IEC 61260-1 Class 1 filter specifications
  • Base-10 or base-2 calculation of octaves
  • Automatically computes overall RMS/SPL
  • A, C, or Z frequency weighting
  • Linear and exponential averaging
  • No limit on fractional octave bands
  • Configure reference values for each unit category
  • Peak hold and overall RMS traces (SPL for pressure units)
  • Harmonic cursor

Compare Data

In ObserVIEW, you can perform octave analysis with the support of the software’s additional tools. With analysis ranges, you can section time data into individual ranges and add multiple files to a single project. Compare ranges/files with the support of statistics traces or user-defined math traces, such as generating an SPL time-history graph channel.

Octave Analysis in ObserVIEW thumbnail

Octave Analysis in ObserVIEW

Peak Hold and Overall RMS

  • Peak hold: displays the maximum amplitude for each bin over the peak hold data range
  • Overall RMS: displays the total RMS for the integration period using the selected filter (SPL for pressure units)
  • Harmonic cursor: displays the trace values at each harmonic of the base cursor

Audio Frequency Spectrum

The audio frequency spectrum is an overlay that represents the range of human hearing. Bass frequencies range from 20 to 250Hz (purple), Mids from 250 to 4kHz (yellow), and Highs from 4k to 20kHz (pink).

Octave band analysis graph with audio frequency spectrum indicated by color.

Data Acquisition

Vibration Research’s data acquisition systems offer the functionality to acquire and analyze acoustic signals. All VR hardware includes a BNC input that supports a microphone and can perform data acquisition.

If your testing lab is already using VR hardware for vibration testing, sound acquisition and analysis are an economical addition.

ObserVR1000, VR9700 and VR10500 product stack

How Can We Help You?

Contact Us