TruClip™
Clip What Matters: Acceleration, Velocity or Displacement, Not Voltage
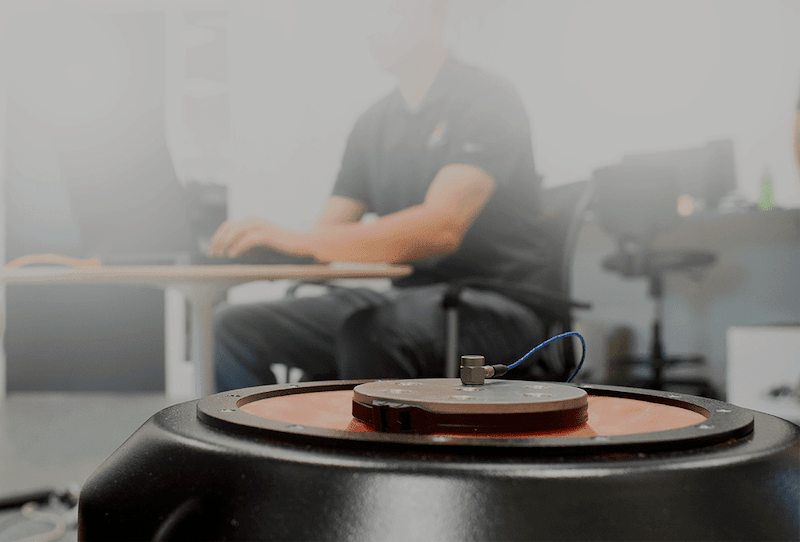
Vibration Research’s innovative clipping method reduces high sigma peaks in random test acceleration, velocity, or displacement. TruClip utilizes closed-loop control to minimize the chance of exceeding shaker limits, protecting your system and product.
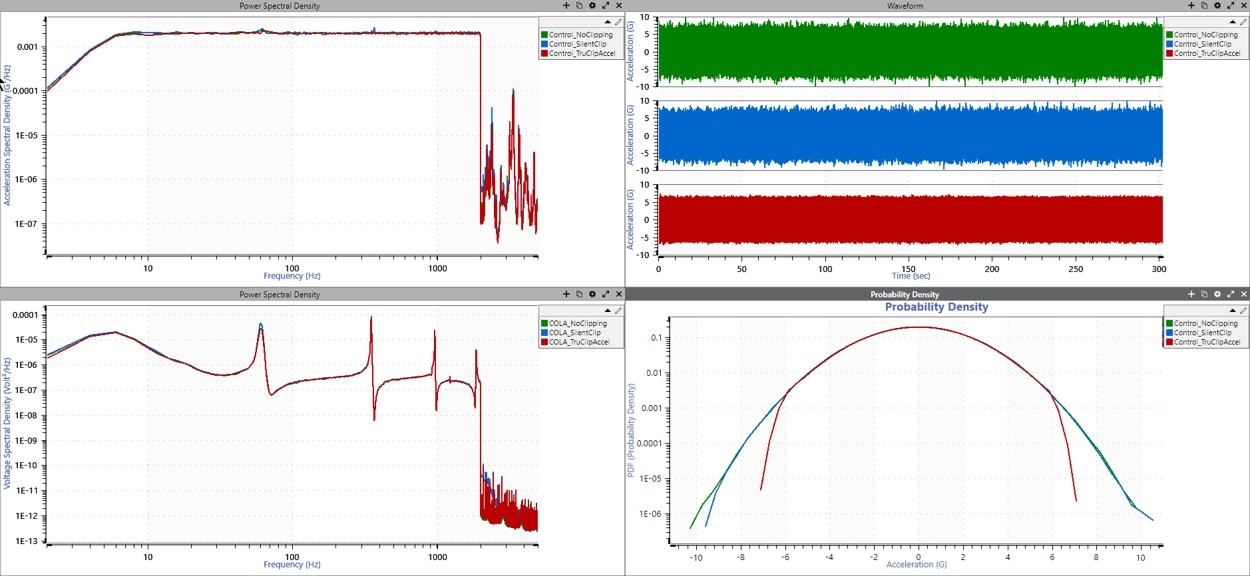
TruClip application on acceleration data.
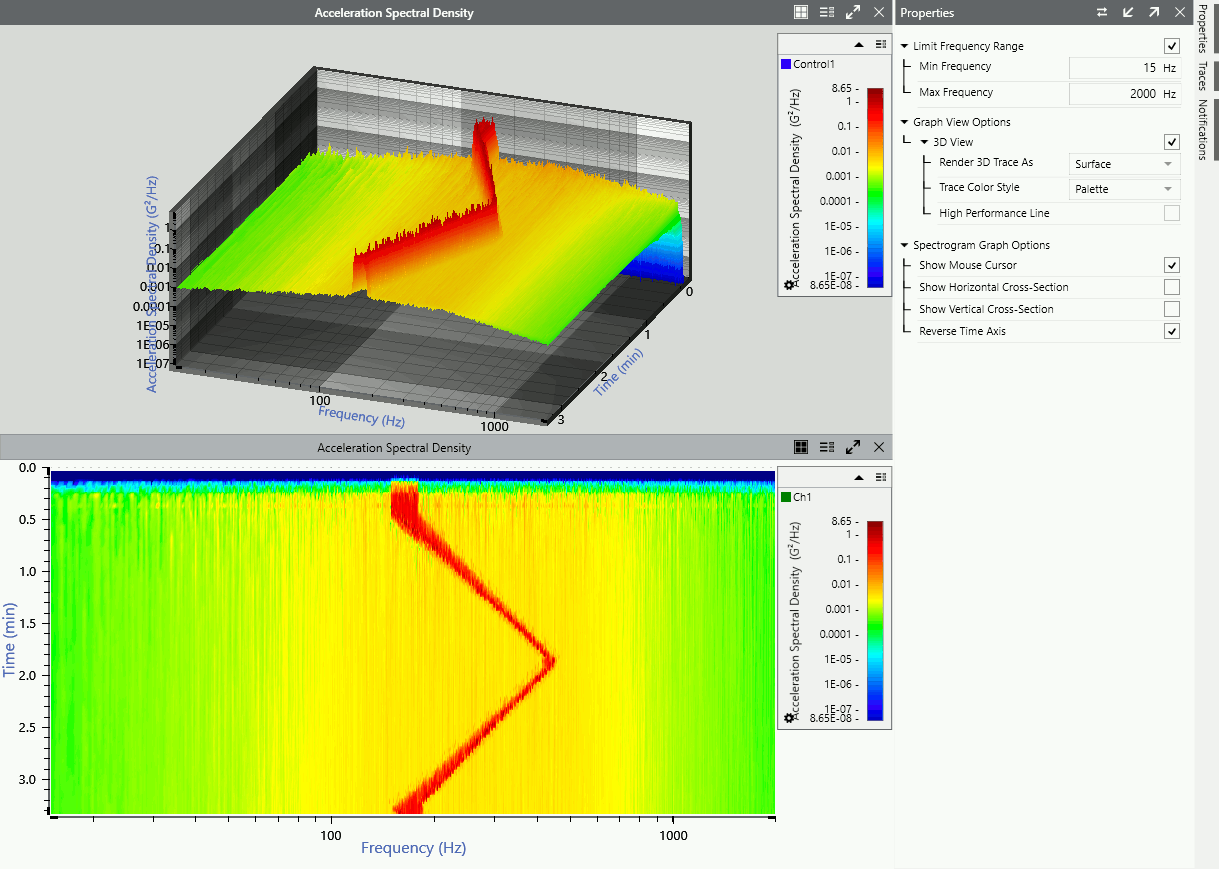
3D waterfall graph and 2D spectrogram in VibrationVIEW.
Waterfall/3D Graph/Color Map Spectrogram
A new analyzer program creates a three-dimensional plot from a set of data files or live data. It can display a 2D color map of a power spectral density (PSD) waveform or a 3D waterfall graph/color map spectrogram of a PSD waveform.
Why 3D?
- Measure changes in vibration as load changes
- Identify resonant behavior over time or a fundamental bending mode frequency
- Seeking to maintain constant conditions
- Monitor shifts in resonant frequency
Full Waveform in FDR with Live Playback
Engineers use the Field Data Replication (FDR) software to reproduce a test environment on a shaker in the lab. In FDR, the user now has the option to view the complete acceleration waveform and the position of the time signal while the test is running.
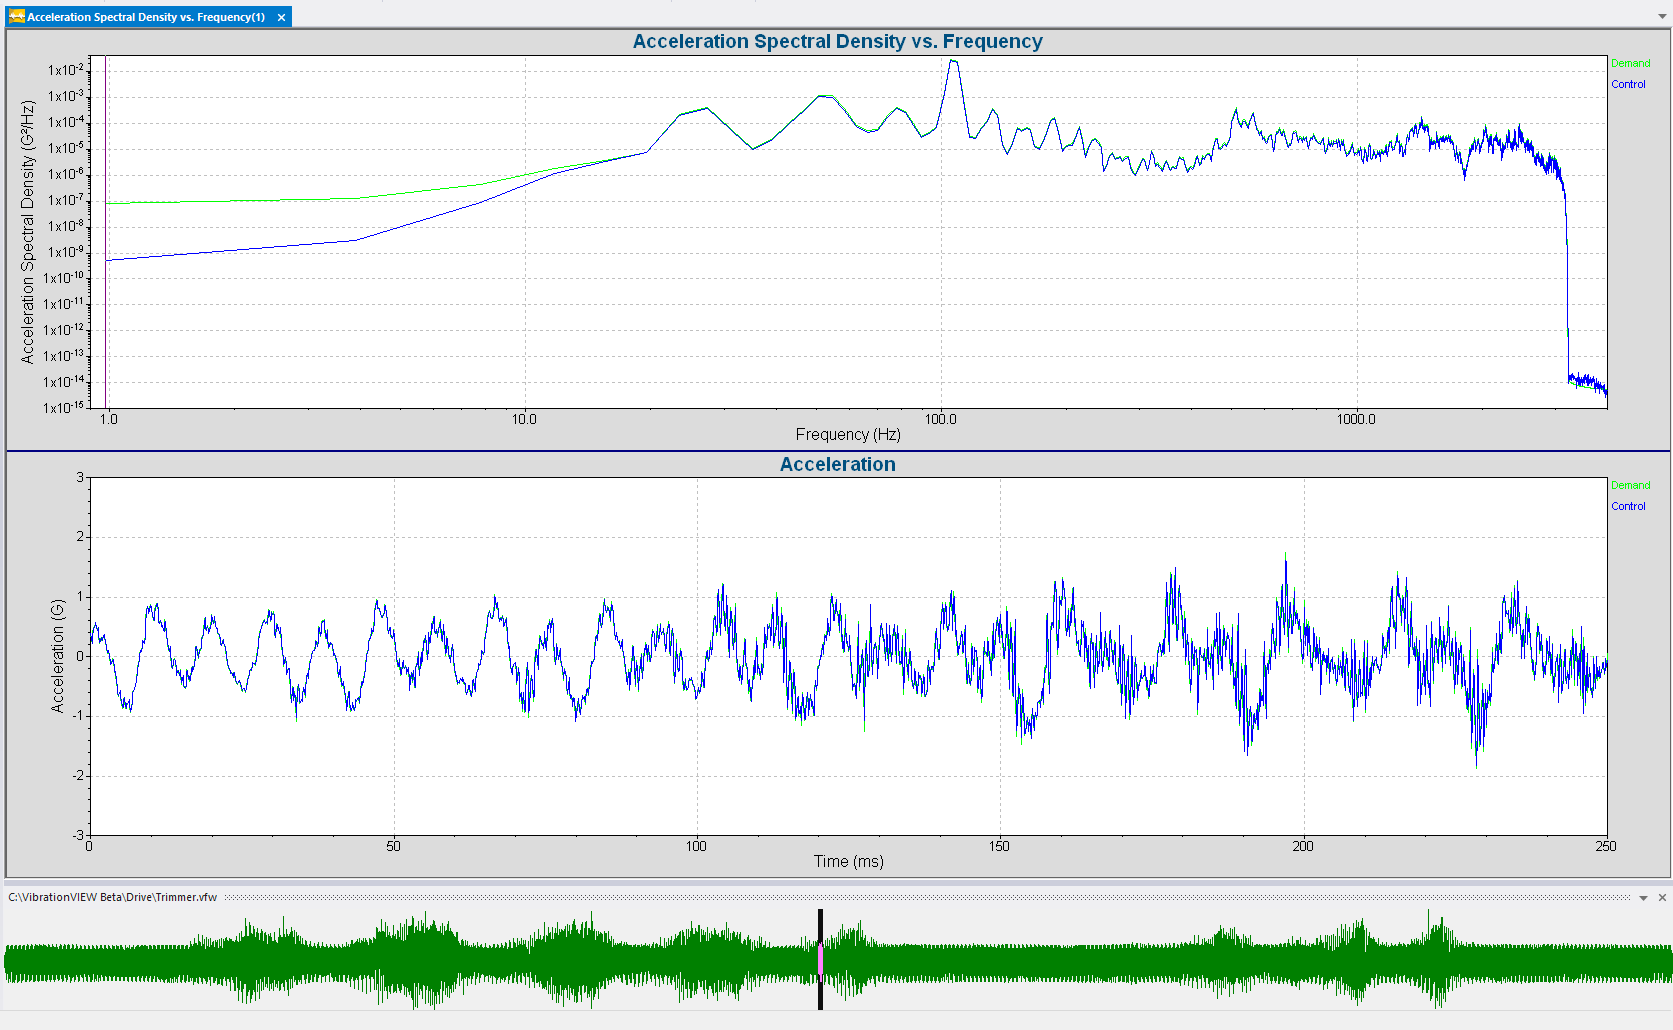
Live playback view in FDR.
Software Improvements
Memorize Notch/Boost for Level Changes
The VibrationVIEW Random software can boost/notch frequency ranges based on a response channel. Now, when the test level increases, the system maintains the overall shape of the output and accounts for the boost/notch, overriding the control when it reaches the next level.
Increased Lines of Resolution
The software now supports a maximum lines of resolution value of 104,000 with the VR10500. A greater lines of resolution value improves resonance control out to high levels.
Improved Out-of-Band Displacement Control
The out-of-band displacement control in Random is improved, so the low-frequency signal drops out significantly faster, resulting in less displacement on the shaker during these test types.
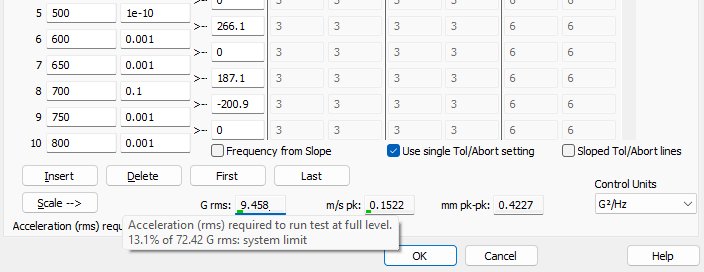
Test Profile Limits
Display as Percentage of Shaker Limits
When a user is developing a test profile, VibrationVIEW displays the maximum AVD requirements and indicates with color when the profile is close to or exceeds these limits.
The software now also displays the percentage of the AVD limit that the profile uses, allowing the user to quickly confirm the test profile shaker usage.
Simplified Test Standard Entry
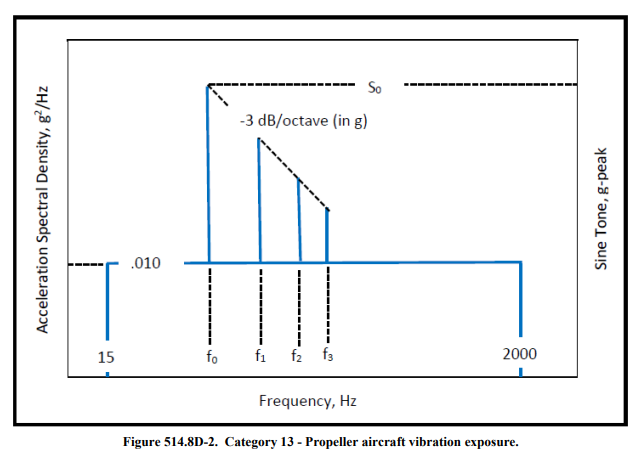
MIL-STD-810H SoR/RoR Testing
MIL-STD-810H defines the amplitude at f0, the f1, f2, and f3 frequencies are harmonics, and the amplitude requires a dB/octave slope. Users can input the slope into VibrationVIEW, and the software will automatically calculate the amplitudes for f1, f2, and f3.
Additional V.2023 Features
- Define test spectrum in units of velocity or displacement spectral density with any AVD control sensor in Random
- Specify a DC offset per channel
- Page through sets of channels with a shortcut (Ctrl + PgDn/PgUp)
- Report parameters for demand velocity and displacement in Sine
- Report parameters for amplitude and frequency in User-Defined Transient
- Report parameters for demand velocity and demand displacement in Shock
Start Using VibrationVIEW 2023
VR customers with a valid Upgrades and Support Agreement can upgrade to the latest software version for free. Anyone can download a free demo version.