You Asked. We Delivered.
VibrationVIEW 2025 is here, packed with the features you have requested. This update includes advanced notching and abort controls, multi-report features, full support for the new VR9700 hardware, and more. Experience more intuitive and precise vibration testing by downloading the update today.
2025.1 Tech Talk
VR9700 Support
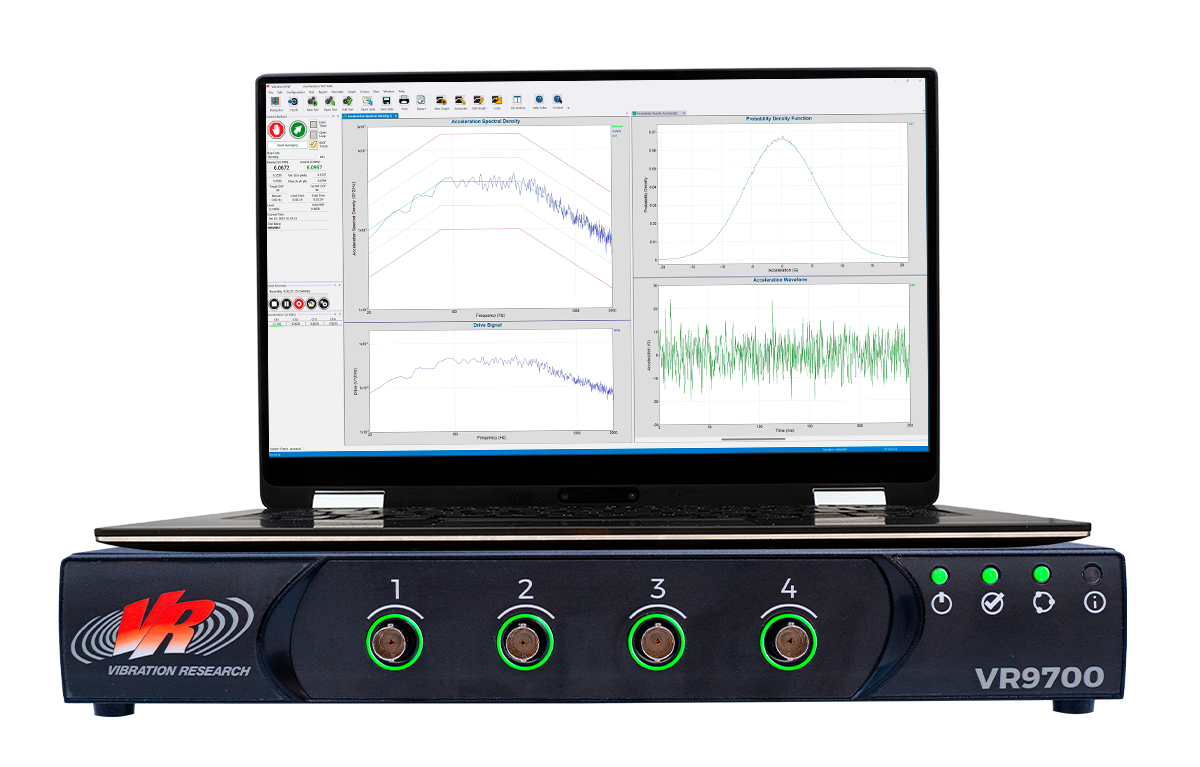
Premium Performance Hardware
VibrationVIEW 2025 supports Vibration Research’s next generation of hardware: the VR9700. The VR9700 controller is a compact and powerful device that meets many control needs, including low to medium-channel-count setups, single-axis control, and demanding data processing.
Multi-file Capabilities
VibrationVIEW’s Report Builder allows engineers to generate and save custom report templates within the software. With the v.2025.2 updates, users can better create multi-file reports, ideal for laboratories that run multiple tests.
Updates
- Copy and paste the content of multiple report files into one report
- Create a report comprised of multiple files
- Insert report parameters from multiple saved data files into one report
- Select a data file from a drop-down list when editing a report with multiple files
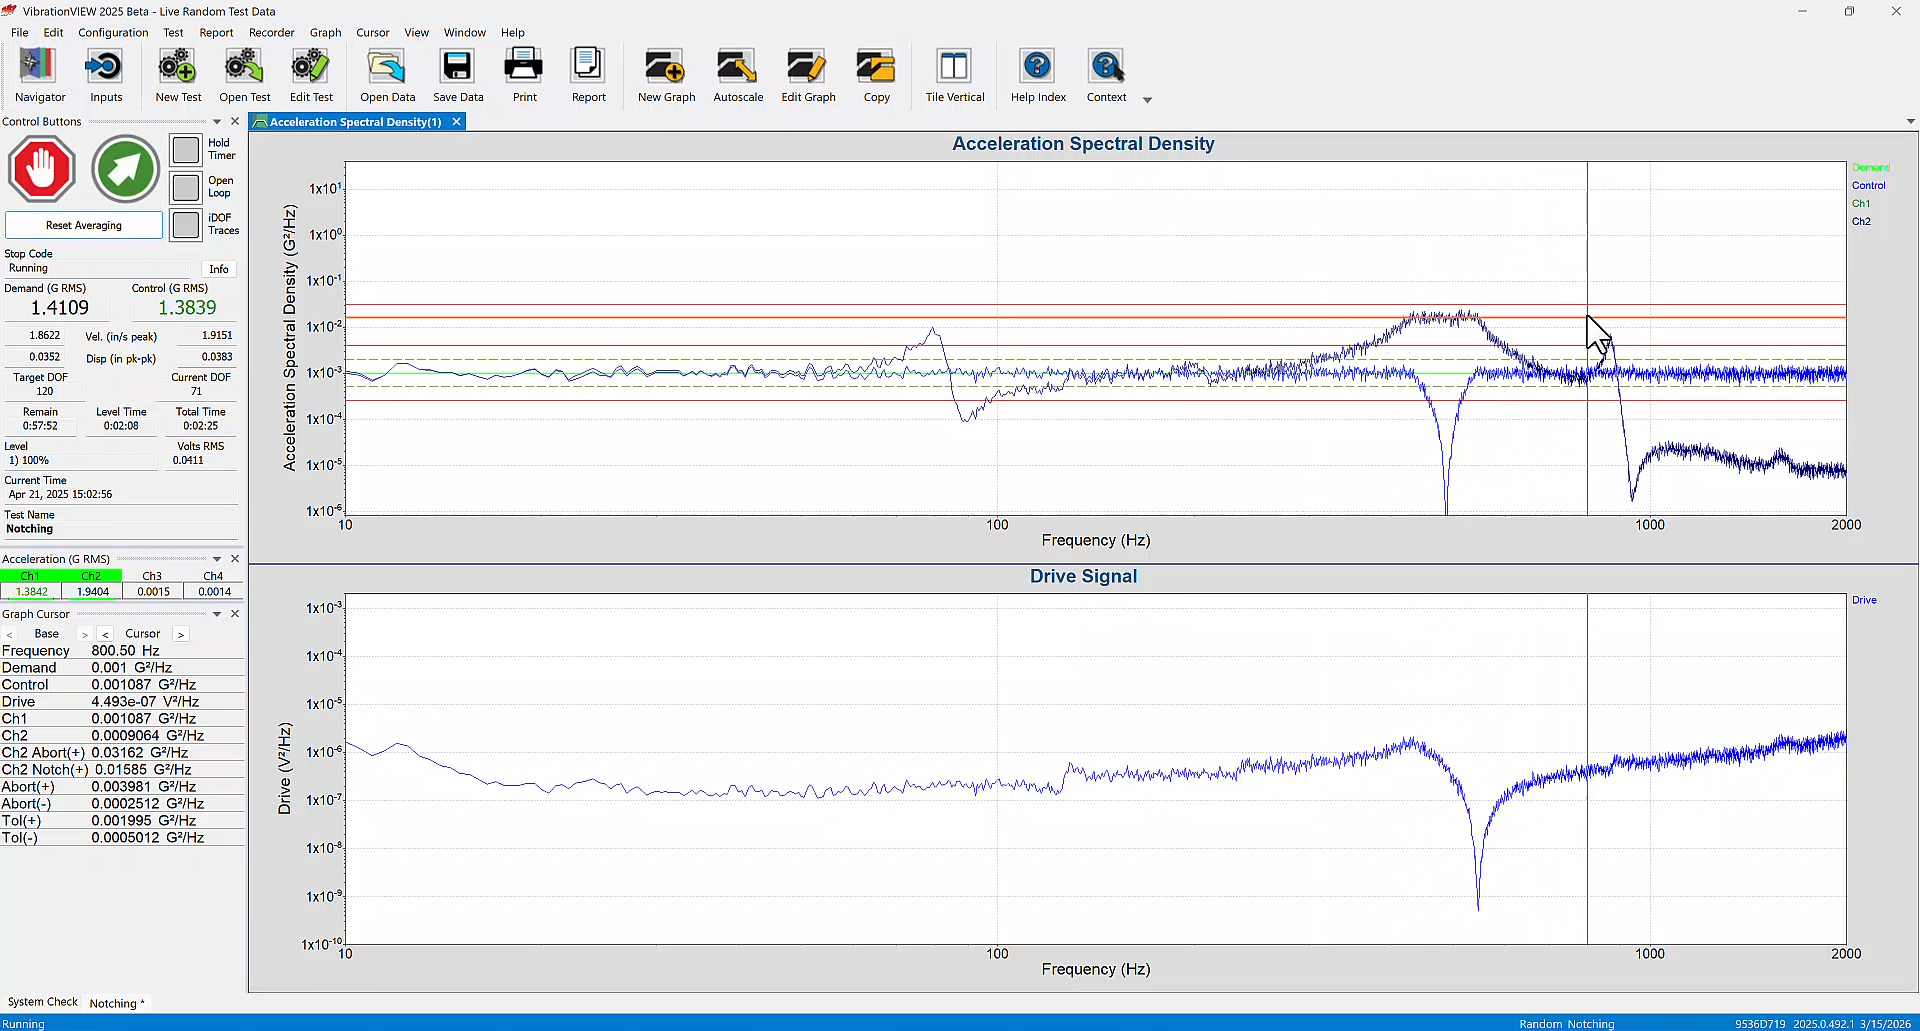
Notching Updates
Define Separate Channel Notch and Abort Tables
In Sine and Random, users can now define both a notch table and an abort table for an individual channel. Test specifications in industries such as aerospace may define a notch and abort table for inputs. This option also gives users more flexibility when defining test limits.
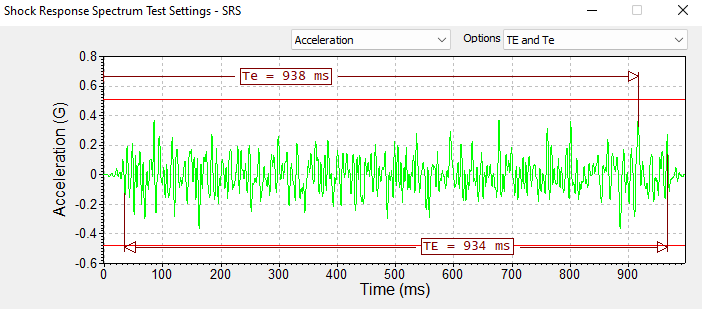
Shock Testing
SRS: Display TE Annotations
The new annotate Te/TE command adds the start and end range of the Te/TE calculation for all input channels (and the Demand) to the selected graph.
SRS: MIL-STD-810H 516.8
Test profiles associated with MIL-STD-810H 516.8: Crash Hazard Shock Test for Flight Equipment Profiles were added to the library.
Transient Capture: Test Schedule
In Transient Capture test mode and others, users can sequence actions to occur at the start/end of the test, in between levels, after an abort, etc.
3D Graphing Updates
VibrationVIEW includes an analyzer program that creates a 3D waterfall plot from vibration data files or live data. Version 2025 includes new 3D graphing options for four test modes.
- Sine: Plot a 3D waterfall graph (acceleration vs frequency vs time) to track resonance changes over time
- Random: Access more 3D graphing options
- Shock: Plot a 3D waterfall graph to show shock events and spectra over time
- Field Data Replication: Plot a 3D waterfall graph to show changing spectra and transfer functions over time
![]()
Additional Features
- Support for ObserVIEW FDS import files
- Import a list of transducers to the active database
- Enable/disable boundary box on annotations
- Copy/paste random-on-random (RoR) table into test definition
- Control on DC sensors in Random like displacement transducers or MEMS sensors
- Option to set default background color for delta cursor annotations
- Update references to ActiveX to Microsoft’s standard “Automation”
- Enhancements to TEDS sensor connection process and sensor recovery capability
- New control unit selection options in Sine
- SoR Sine tone tolerance defined in dB or %
Sine Resonance Table Annotations
VibrationVIEW 2025 includes control acceleration/velocity/displacement (AVD) and resonance AVD report vectors. With these new options, users can specify acceleration, velocity, or displacement for Sine control and response resonances regardless of the control unit of the corresponding breakpoint segment.
Event Log Pane
An event log was added as a docking pane to the toolbar. The log is a scrollable and sortable list. Engineers can view an event log in the context of the test and filter and sort events to identify those of interest.