Abstract
The angular acceleration of rotational motion is often desired when performing multi-axis testing. VibrationVIEW can be configured to calculate the angular acceleration units between two linear accelerometers.
Question
How do you calculate angular acceleration between two points?
Answer
VibrationVIEW 11 can subtract two channels from one another. In doing so, the software can calculate the angular acceleration in real time during a test. The process is outlined below.
Theory
The formula for angular acceleration between two points is as follows:
(1) 
Where α is the resultant angular acceleration in radians/second², A1 is the linear acceleration of the first accelerometer (meters/second²), A2 is the linear acceleration of the second accelerometer, and D12 is the distance between the two accelerometers in meters. A negative sign is placed in front of A2 as a correction because the A2 accelerometer is oriented in the same direction as A1.
Figure 1 displays a truck axle with two linear accelerometers mounted to the axle to measure angular acceleration. The proceeding diagram shows how the angle, α, is calculated when the axle rotates counter-clockwise.
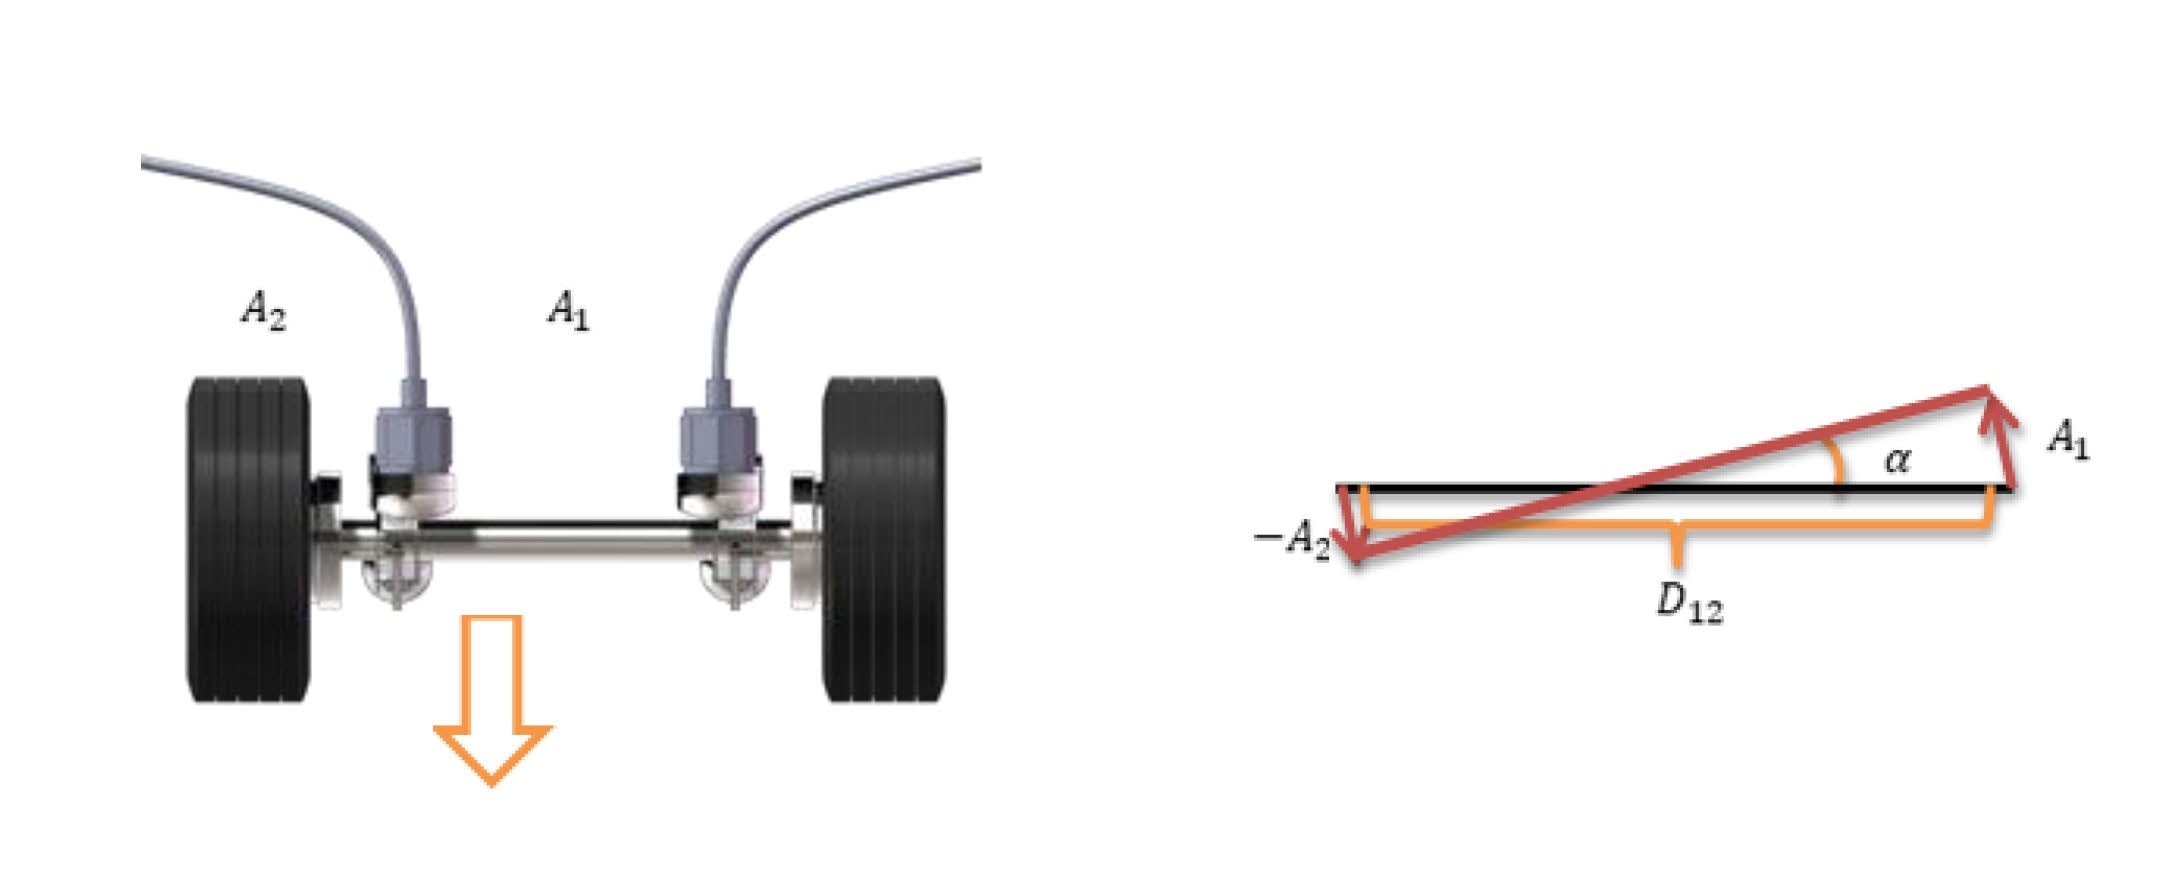
Figure 1: Angular Acceleration Calculation Diagram
The body connecting the two accelerometers is assumed to be rigid. If there is a significant amount of flex between the two points, this method of determining angular acceleration is not valid.
Application
To calculate angular acceleration in VibrationVIEW, follow these steps:
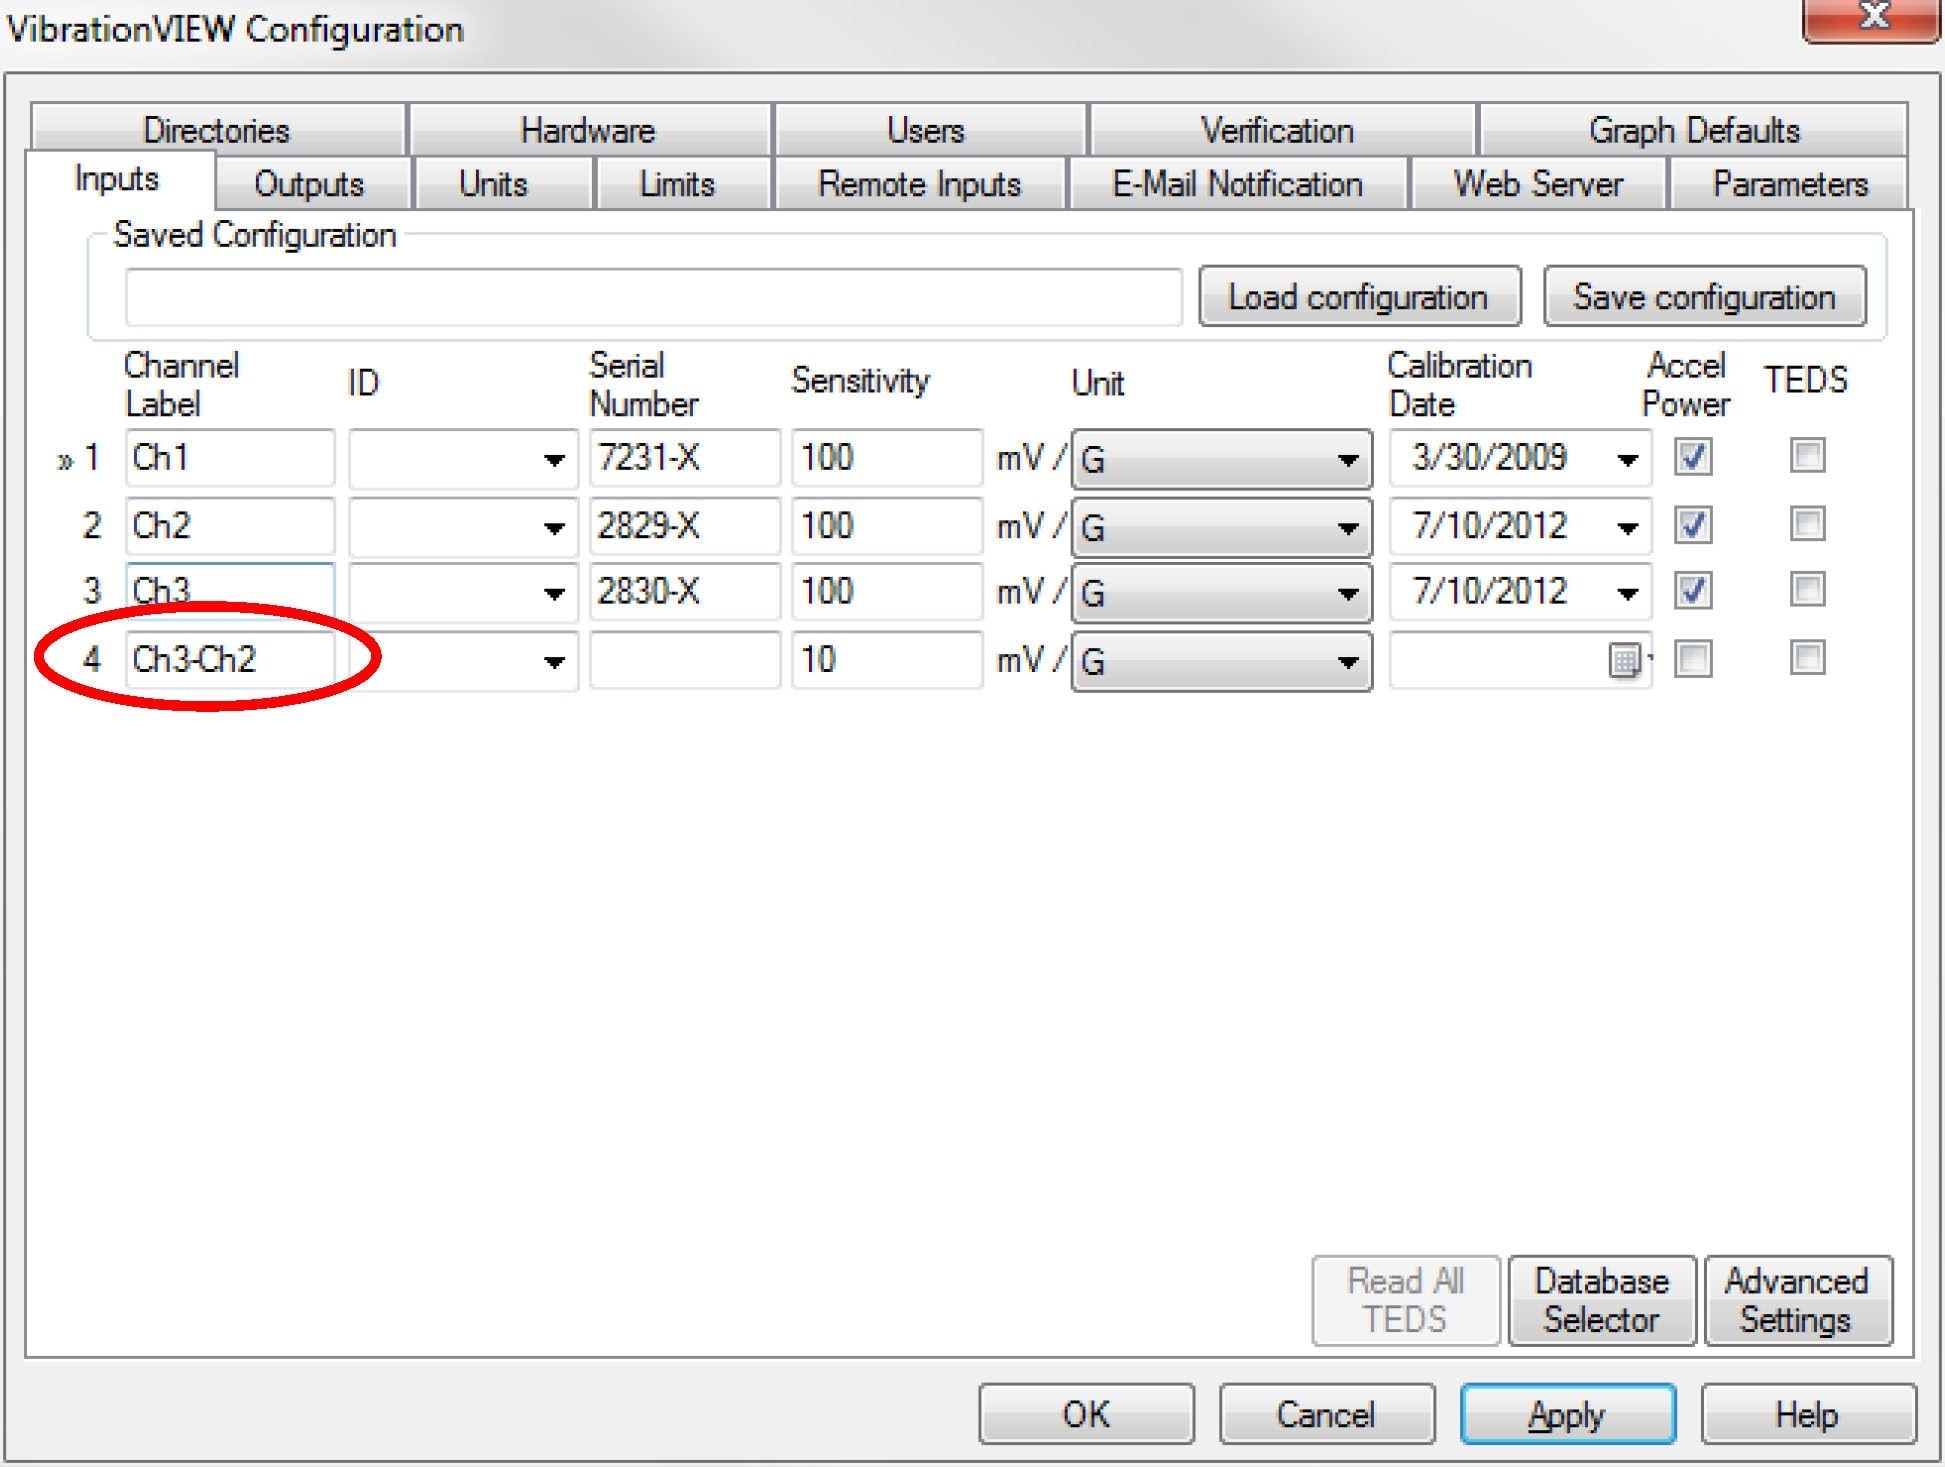
- Click Configuration > Inputs
-
- For the Ch4 channel label, enter Ch3-Ch2.
- Click Advanced Settings
-
- For Ch 4, select the Conditioner Sensitivity checkbox; a text box will appear to the right of the checkbox
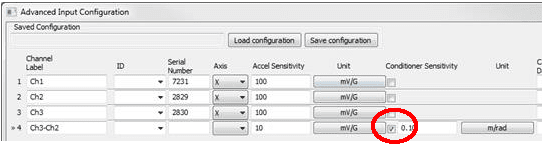
-
- In the textbox, enter the distance between Ch2 and Ch3
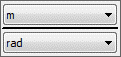
- Set the top unit to the distance unit used above
- Set the bottom unit to the angle unit to radians
-
- Click OK
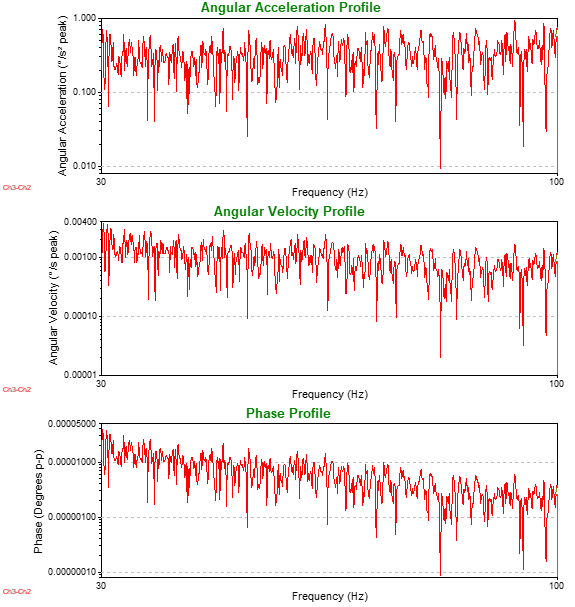
- Ch4 is now an angular acceleration measurement between Ch2 and Ch3. To view a graph of angular acceleration, velocity, and displacement in sine test mode, click New Graph
-
- Select the Acceleration vs. Freq. checkbox to make an angular acceleration graph
- Select the Velocity vs. Freq. checkbox to make an angular velocity graph
- Select the Displacement vs. Freq. checkbox to make an angular displacement graph
Note: To plot angular units on the graph’s axes, only show Ch4 (Ch3-Ch2).
Additional Considerations
A test can be controlled off the angular acceleration between Ch3 and Ch2. To do so, simply choose Ch4 (Ch3-Ch2) as a control or reference channel.
Matched accelerometers must be used to conduct a test controlled off the angular acceleration. Use the same manufacturer and model for channel pairs. If different accelerometers are used, small differences in the response between the accelerometers will likely lead to unusable results.
For best results, accelerometer pairs should be calibrated to each other. To do so, mount both accelerometers next to each other to a shaker head. Run a system check test at 100Hz and 1G. Observe the difference between the two accelerometers on a spectrum plot. If there is a measurable difference between the two accelerometers at 100Hz on the spectrum plot, adjust the sensitivity of one of the accelerometers by a small amount to see if the difference between the accelerometers decreases. Repeat this process until no decrease in difference can be obtained. Figure 2 shows an exaggerated example of a difference between Ch3 and Ch2.
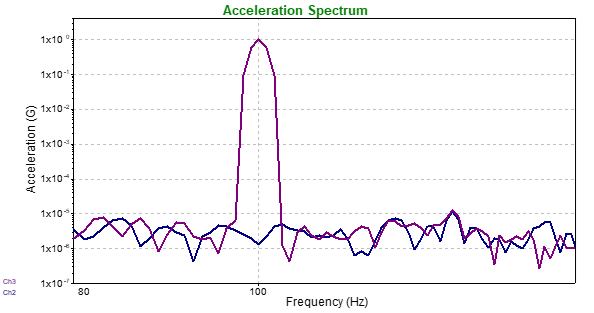
Figure 2 – Accelerometer Calibration between channel pairs