Abstract
The slew rate parameter controls how fast the drive changes during a Sine vibration test. In some instances, the default value in VibrationVIEW can be a limiting factor during a test.
Question
What does the Slew Rate control, and how do I know if the value is too low?
Answer
The default parameter values in VibrationVIEW should be sufficient for most tests, but there are exceptions.
The Slew Rate parameter determines the maximum rate at which the output changes. For example, a slew rate of 20dB/sec allows the signal to increase 10x in one second.
A low slew rate may prevent the drive from keeping up with sharp resonances. A high slew rate allows the drive to change quickly, which can cause damage.
Slew Rate as a Limiting Factor
Let’s refer to Figure 1. As the Sine vibration test ran through a resonance, the drive began to rise but could not keep up. As a result, the control signal crossed the lower abort line, and the test aborted with a “Control Minus Abort” stop code.
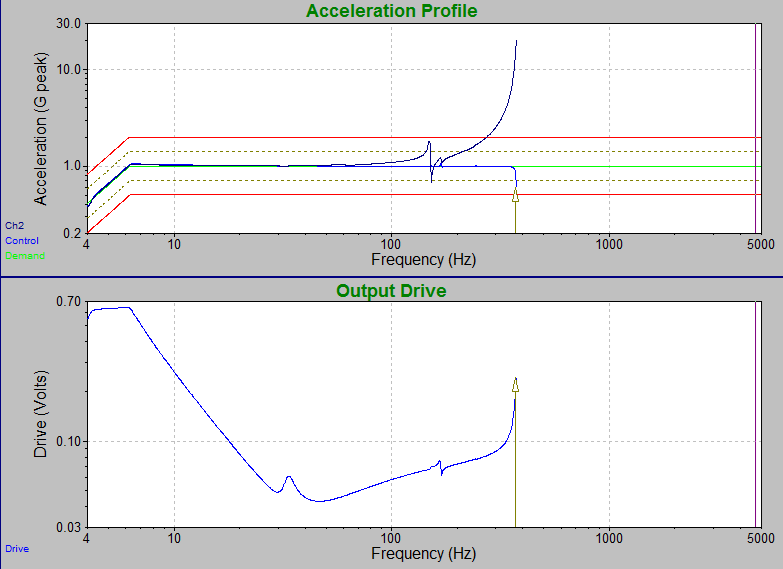
Figure 1. An aborted Sine test where the drive signal did not increase fast enough while running through a resonance.
To determine if the slew rate was the limiting factor, we need to find the drive signal’s rate of change just before the test aborted.
Figure 2 is the Output Drive vs. Time graph. To find the rate of change, we need to measure the slope of the drive trace.
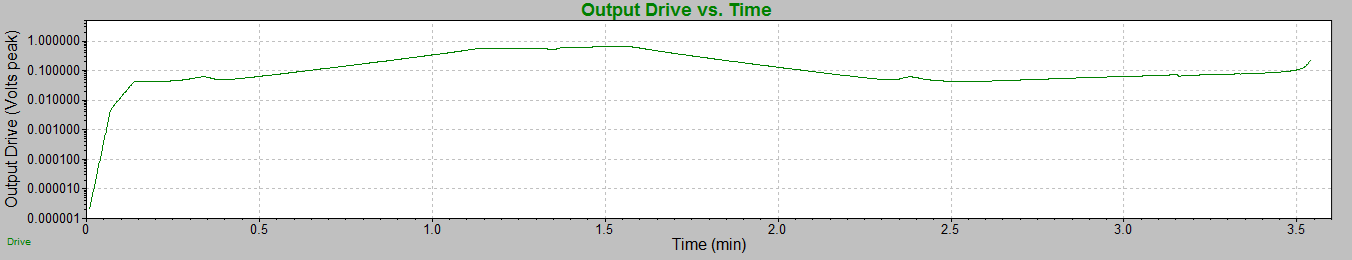
Figure 2. Output Drive vs. Time before for the aborted test.
- Zoom in to the end of the trace: hold down the right mouse button and draw a square around the end of the Drive trace.
- Open the Slope cursor: select Cursor in the main menu, navigate to Cursor Mode, and select Slope Cursor.
- Hover the cursor over the end of the trace and select the Home key. The software will insert a line at the cursor’s location.
- Move the cursor along the trace. The cursor window will display the slope of the trace between the two lines (Figure 3).
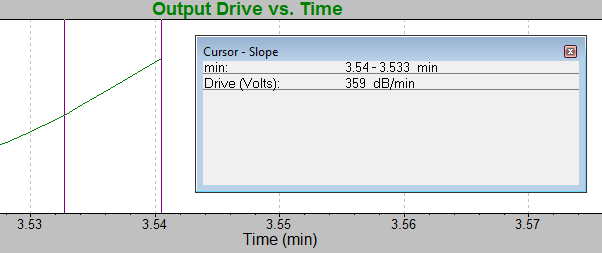
Figure 3. Slope cursor window.
In Figure 3, the slope of the line is around 360dB/min. The slew rate is 6db/sec or 360db/min. We can confirm that the slew rate prevented the drive from rising as fast as it needed to keep the test under control.
Solution
The engineer has several options to run this test successfully:
- Slow down the sweep rate through the resonance
This change increases the time spent at a given frequency and allows the drive to react more slowly. This option also has the benefit of finding the resonance more precisely.
- Increase the slew rate until the test can run and use the Output Drive vs. Time History graph to determine the test’s maximum slew rate
To determine the maximum slew rate, find the slope of the steepest part of the graph. In this example, it is about the 3.8-minute mark. The steepest slope is –1,852dB/min, which corresponds to a slew rate of about 31dB/sec. A slew rate of 30dB/sec will limit the drive for a brief period, but not enough to significantly impact the test.
In this example, both options were necessary. The Sweep rate through the resonances was reduced, and the Slew Rate was set to 60dB/sec (or 3,600dB/min). Figure 4 is the resulting Output Drive vs. Time History graph.
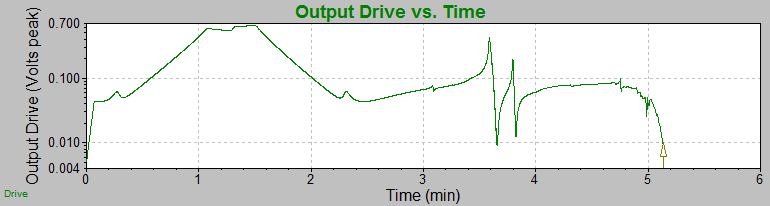
Figure 4. Resulting Output Drive vs. Time graph.