Abstract
Most random vibration testing software programs scale frequency graphs logarithmically because frequency responses are generally understood to be non-linear. However, the EN 50125-3 railway testing standard plots its railway specifications with a linear frequency axis.
Question
If one or both axes of a random test profile are linear in scale, what happens to the test profile when the software’s graph scaling is logarithmic?
Answer
Test standards for random vibration testing provide a random breakpoint table, which defines the frequency and amplitude points for the test profile and, potentially, their crossover slope.
A power spectral density (PSD) plot displays the breakpoint values as acceleration over frequency. The acceleration root-mean-square (gRMS) is the standard measurement of the overall random vibration acceleration.
After an engineer defines the PSD, the gRMS value does not change. As such, engineers can compare a PSD to a test specification with a required gRMS value. They can also use this value to compare two PSD plots with the same parameters and verify that their measurements have the same amount of energy.
Log-log Interpolation
Most frequency graphs (and, thereby, related test specifications) are presented in log-log axes because frequency responses are generally understood to be non-linear.
For example, music is organized in octaves rather than linear steps. To move from A, above middle C (440 Hz), and to the next A, we multiply the value by 2x to get 880 Hz. The octave below it is 220 Hz. This principle of doubling or halving frequencies applies to mechanical vibration in the same way as sound.
Sound and vibration amplitudes are typically expressed in a decibel (dB) or log scale because the sound volume is not perceived linearly but logarithmically.
Log-log interpolation is necessary to compute the RMS for a PSD correctly. This explanation of the RMS calculation helps to explain why. So, what happens if a random breakpoint table is interpolated in linearity?
Linear Axis on a Random Breakpoint
If one or both axes of a random test profile are linear in scale, what happens to the test profile when the software’s scaling is logarithmic? One example comes from the EN 50125-3 railway testing standard, which plots a railway specification with a linear frequency axis. The standard defines multiple random tests, all with linear spacing for the frequency axis. It also gives the required RMS for each breakpoint table.
Currently, the VibrationVIEW software only allows for logarithmic slopes between breakpoints, as this spacing is correct for the frequency domain. After entering the EN 50125-3 breakpoints into VibrationVIEW, the overall RMS is noticeably higher than the expected value.
Additionally, the resulting graph has a large, curved gap when we create a slope between the linear-linear and log-log lines. This difference relates to the area under the curve, which is also responsible for the difference in calculated RMS. The following four graph comparisons show the area under the curve for different logarithmic/linear variations compared to the log-log scale.
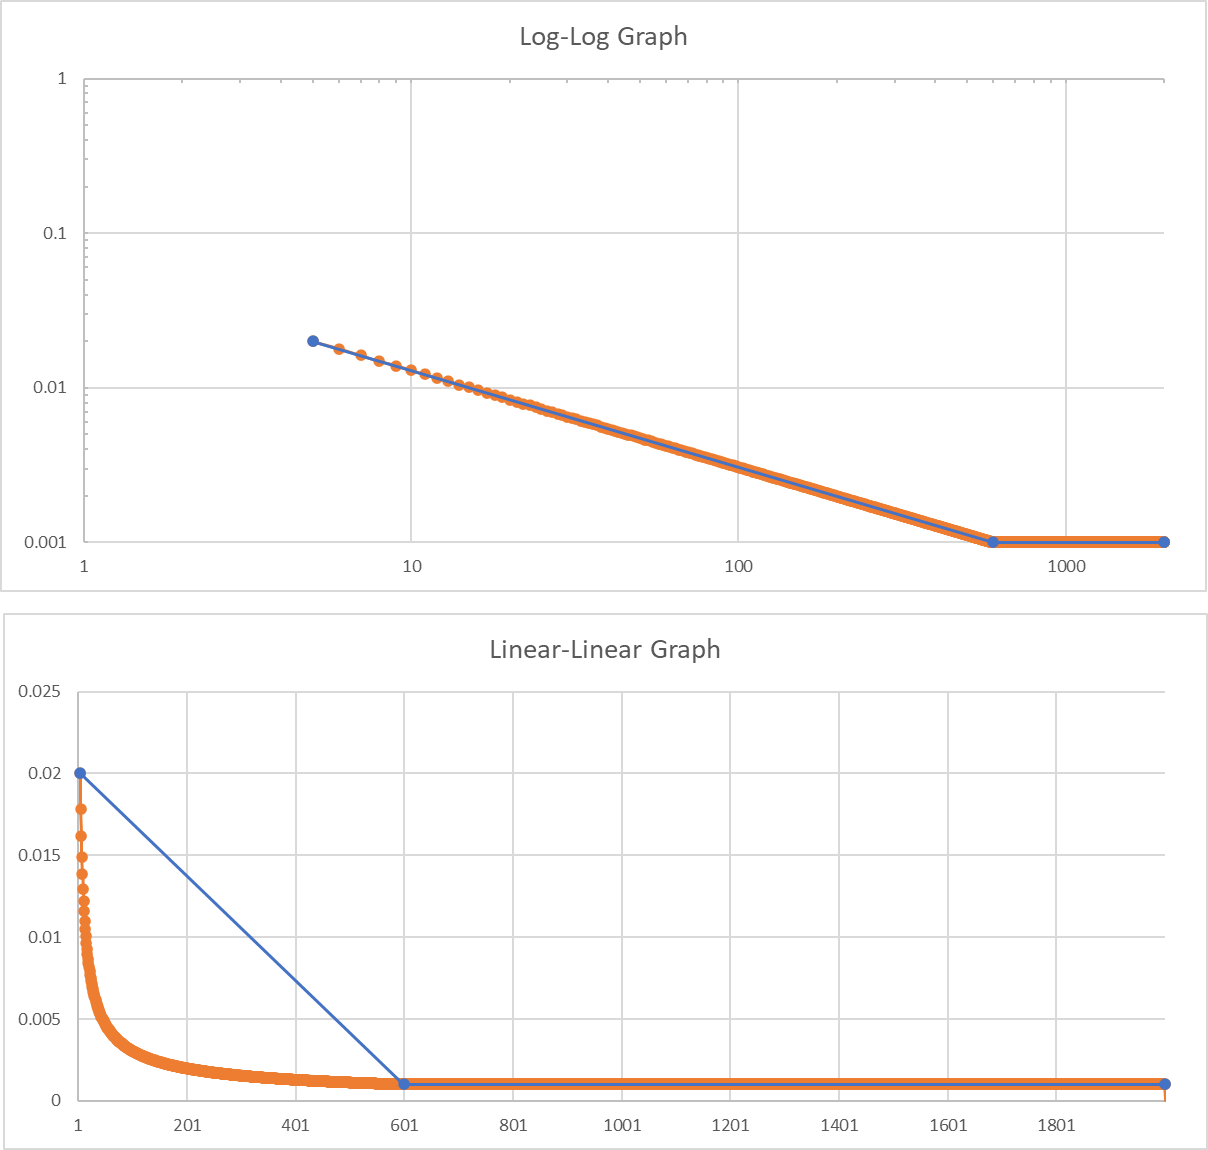
A log-log graph compared to a lin-lin scale.
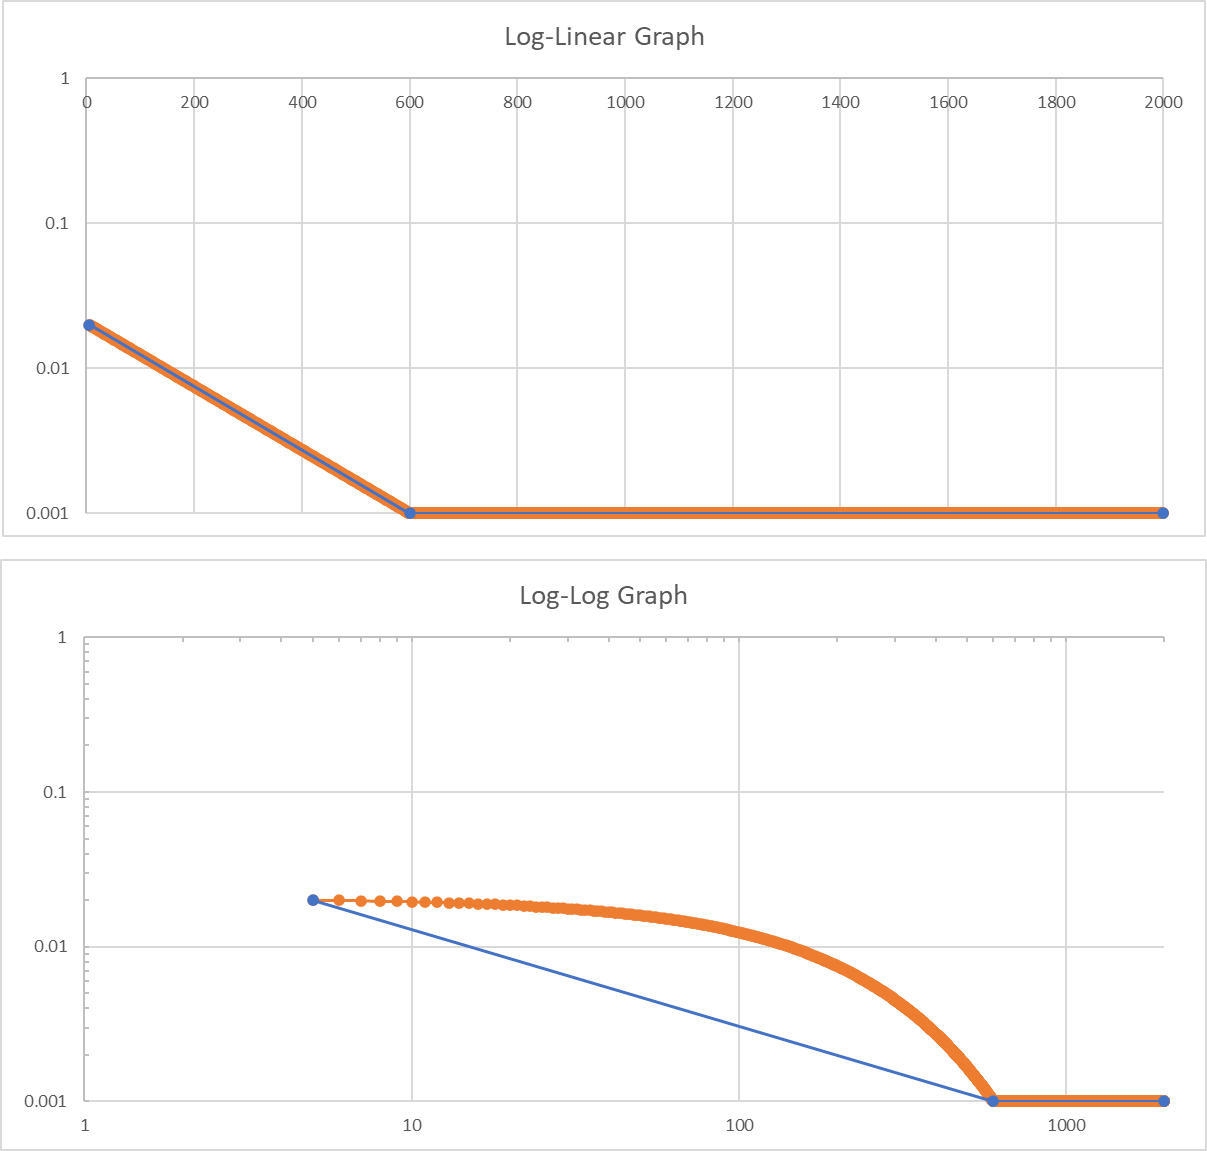
A log-lin graph compared to a log-log scale.
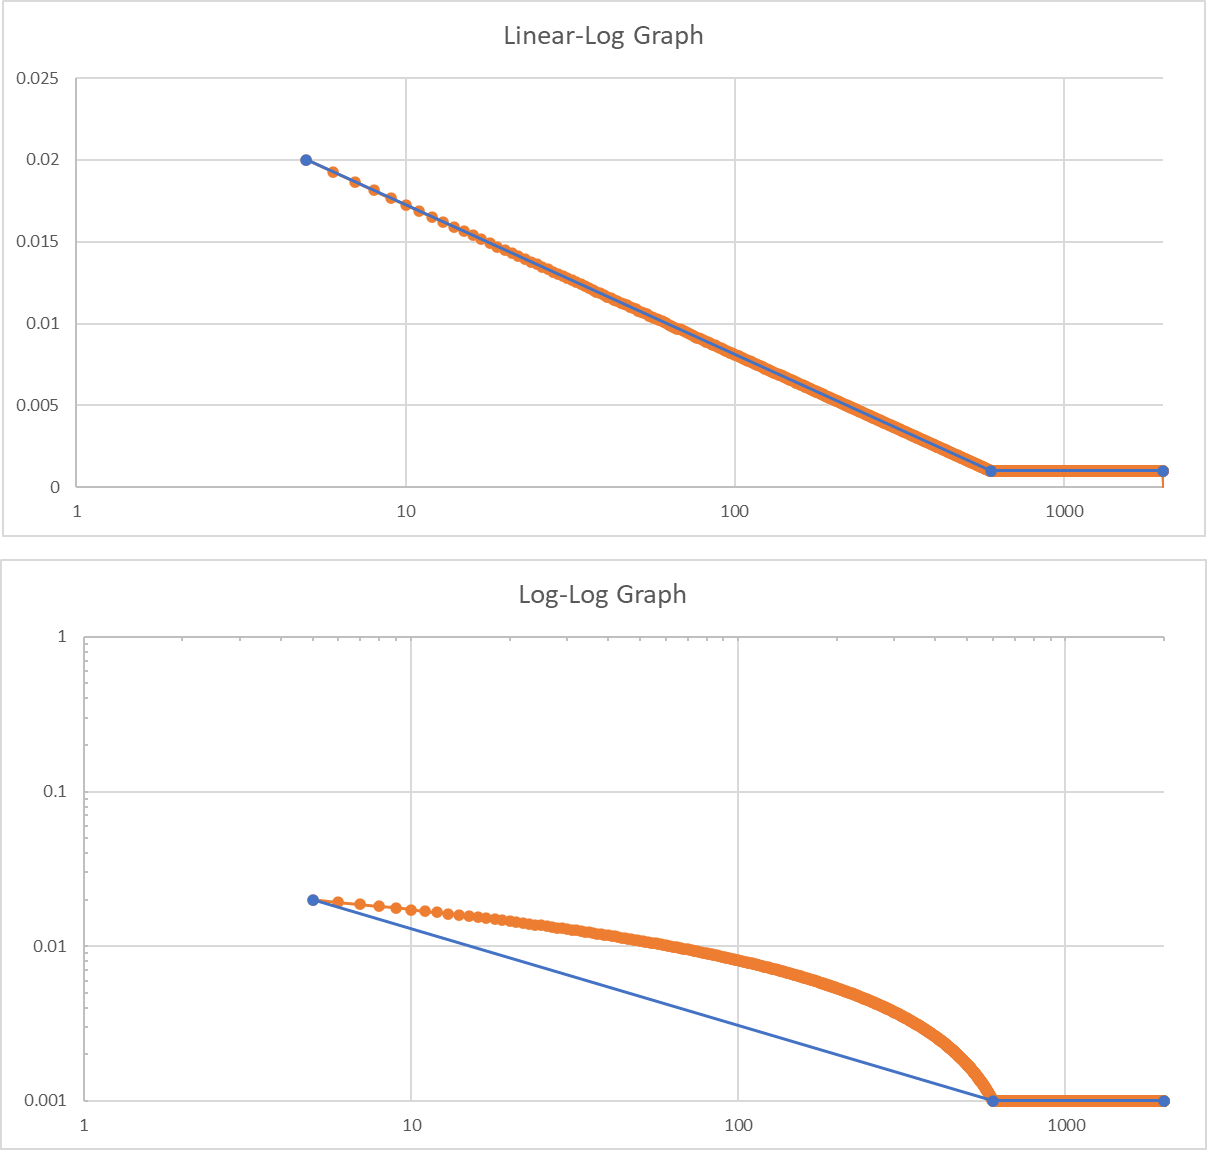
A lin-log graph compared to a log-log scale.
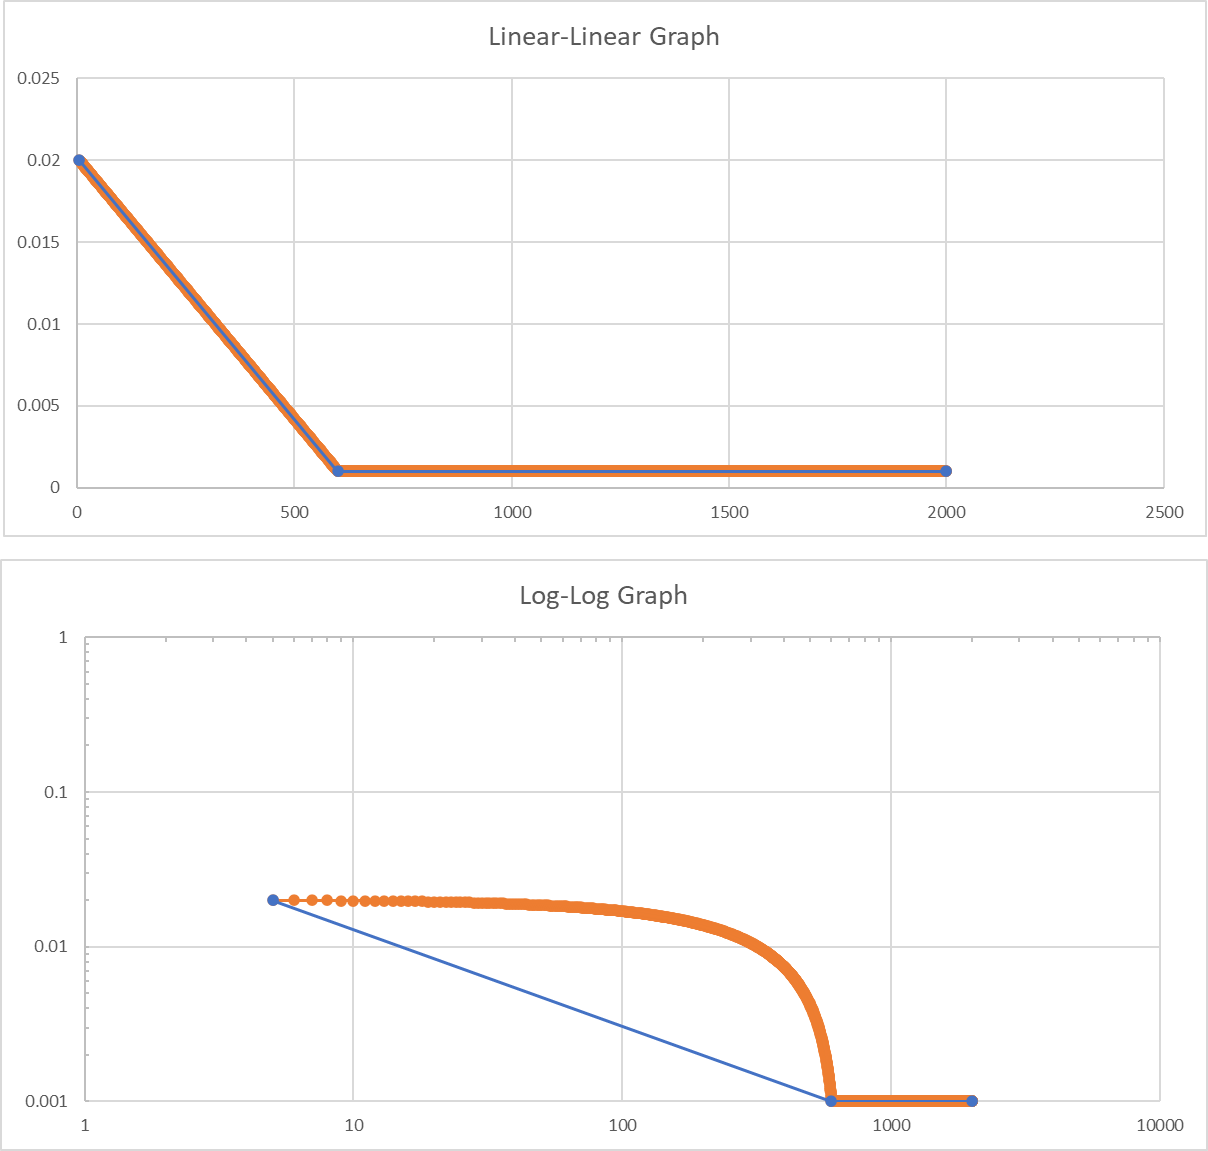
A lin-lin graph compared to a log-log scale.
Solution
As mentioned, this issue will not present itself often, as the correct spacing on a frequency graph is log-log. However, we can work around the logarithmic scale by creating a breakpoint table with many points in the sloped line so that the result is nearly linear. A linear-linear interpolated breakpoint table with points spaced at 1Hz intervals will effectively create a linear-linear PSD breakpoint definition.
The attached spreadsheet interpolates slopes for all combinations of log and linear axes. You can insert an entire breakpoint table, and it will automatically calculate the slopes between the target breakpoints.
Pick the axes combination in the bottom tabs, then input the desired breakpoint table.
- Lin-Lin
- Log-Lin
- Lin-Log
- Log-Log