Introduction
Many vibration test facilities perform random testing because real-world excitation is often non-repetitive and non-deterministic, and engineers seek to replicate a product’s operational environment. However, real-world vibration is not always solely random. Some products, such as a machine on tracks or treads running on concrete, experience repetitive high random peaks that mimic transient events. These peaks have a lower amplitude than shock events but are distinct from the surrounding background random vibration.
When engineers use conventional random averaging techniques to analyze this “impulse-on-random” field data, it averages the high-G level impulses down toward the random signal levels, hiding them from the test while increasing the test’s root-mean-square (RMS) to account for them. The test profile no longer accounts for the field data’s distinct vibrational pattern, and the engineer runs the risk of a false pass.
This paper presents a method of generating impulse-on-random tests using the fatigue damage spectrum (FDS) and a proprietary method of kurtosis control. Engineers can apply it to field data with repetitive impulse events that result in high kurtosis over background random frequency content. This paper validates the test generation method by comparing 1) the FDS of the generated test to the field recording FDS and 2) the shock response spectrum (SRS) of the generated test to the field recording SRS to validate the amount of test acceleration.
Impulse-on-random Environments
Impulse-on-random environments are primarily random with repetitive impulse noise. Two telling characteristics are a high mean kurtosis (k>5) and evenly spaced, high acceleration peaks. Unlike a purely random waveform, the peaks have a uniform repetition rate, and, unlike a shock waveform, the signal includes random background noise. To identify an impulse-on-random environment, engineers can listen to the data’s audio for indications of repetitive impulses, identify patterns in the peak accelerations, and review the data’s kurtosis values.
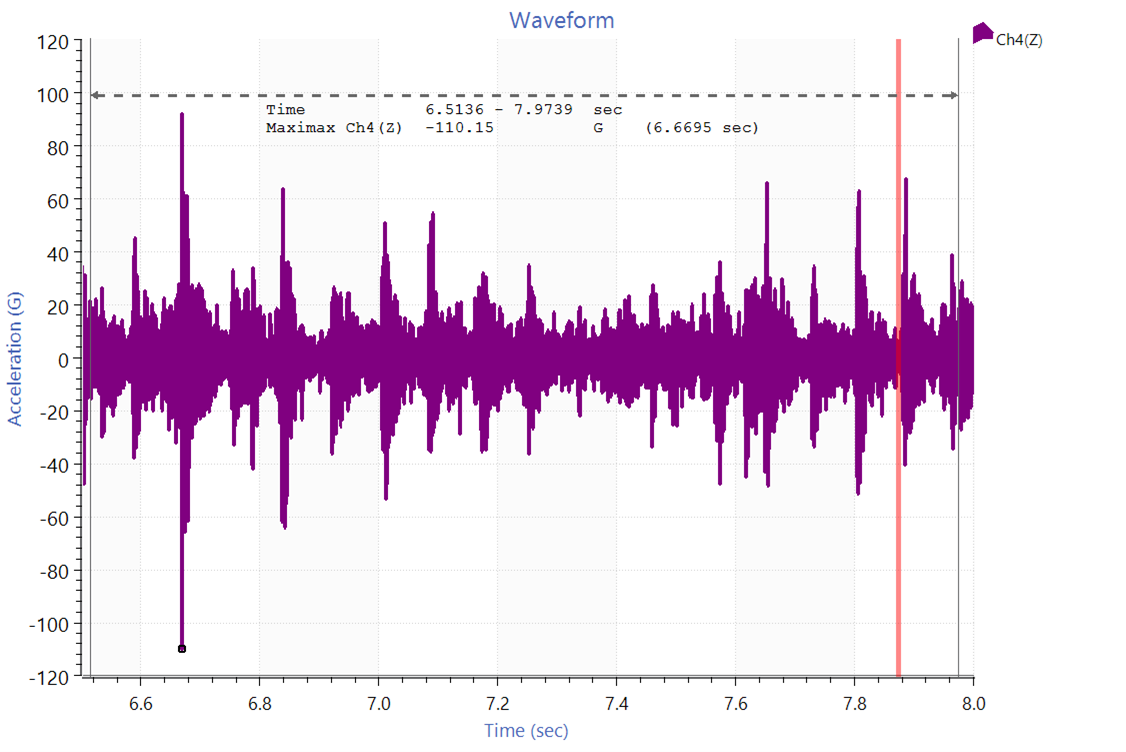
Figure 1, for example, is a recorded time waveform from a tracked machine. A magnetic accelerometer was mounted to the machine, and an ObserVR1000 data acquisition device recorded the vibration data as the machine drove forward and in reverse on a compacted dirt path. Note the evenly spaced peaks with acceleration values significantly higher than the random background.
Test standards often define random vibration test profiles as a PSD. An individual PSD can be created by an infinite number of waveforms, but the test’s overall energy—represented by the root-mean-square (RMS)—will not change after the PSD is defined. As such, engineers can match a test PSD to the specification and determine if the RMS meets requirements. They can also use the RMS to compare two PSD plots with the same parameters and verify that they have the same amount of energy.
The PSD displays the average energy at each frequency over a set period. As the average collects more frames of similar data, the overall variance will decrease, the accuracy will increase, and the PSD will appear much smoother.
Averaging and High Kurtosis
For purely random data, the PSD estimates the distribution of a signal’s strength across a frequency spectrum. Random data is assumed to be Gaussian with a kurtosis value of 3, meaning its peaks are assumed not to deviate more than 3 sigma from the mean. As such, PSD averaging produces a fairly accurate estimation of purely random data.
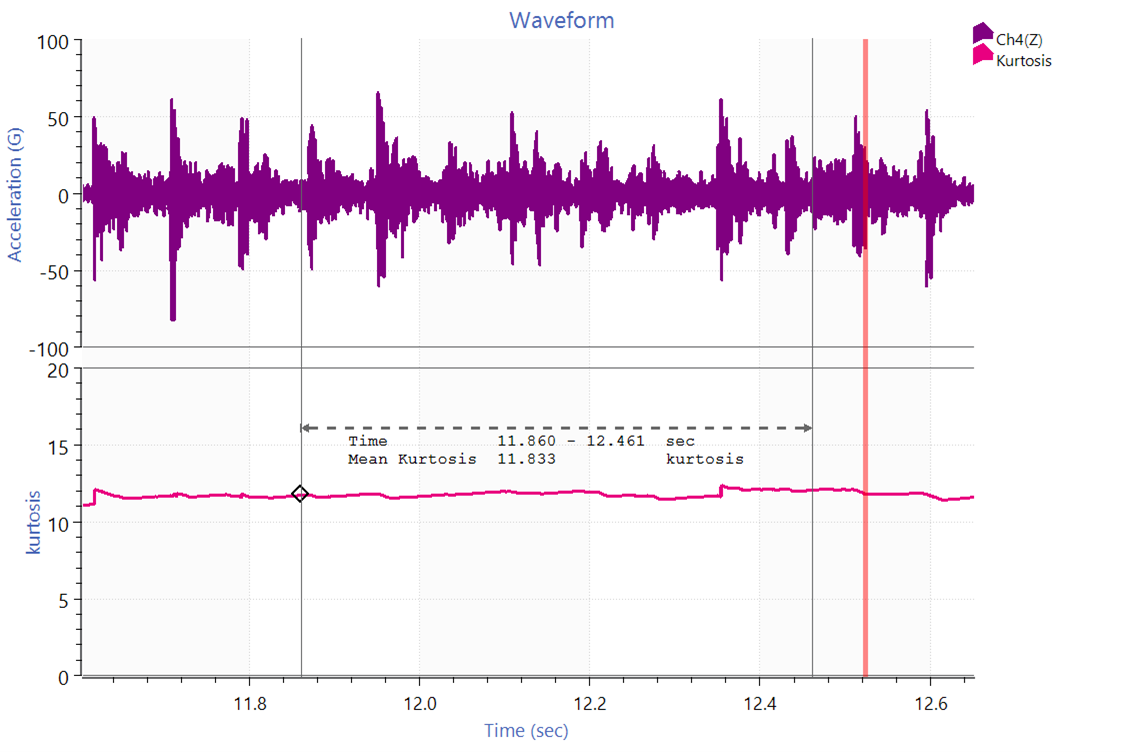
However, impulse-on-random data may have kurtosis values that exceed 3. Figure 2 displays a mean kurtosis value of near 11 for the recorded time-history waveform in Figure 1.
When engineers use conventional PSD averaging techniques to analyze this type of field data, it averages the high-acceleration impulses down toward the Gaussian random background vibration, hiding the impulses from the test while increasing the random RMS level to account for them.
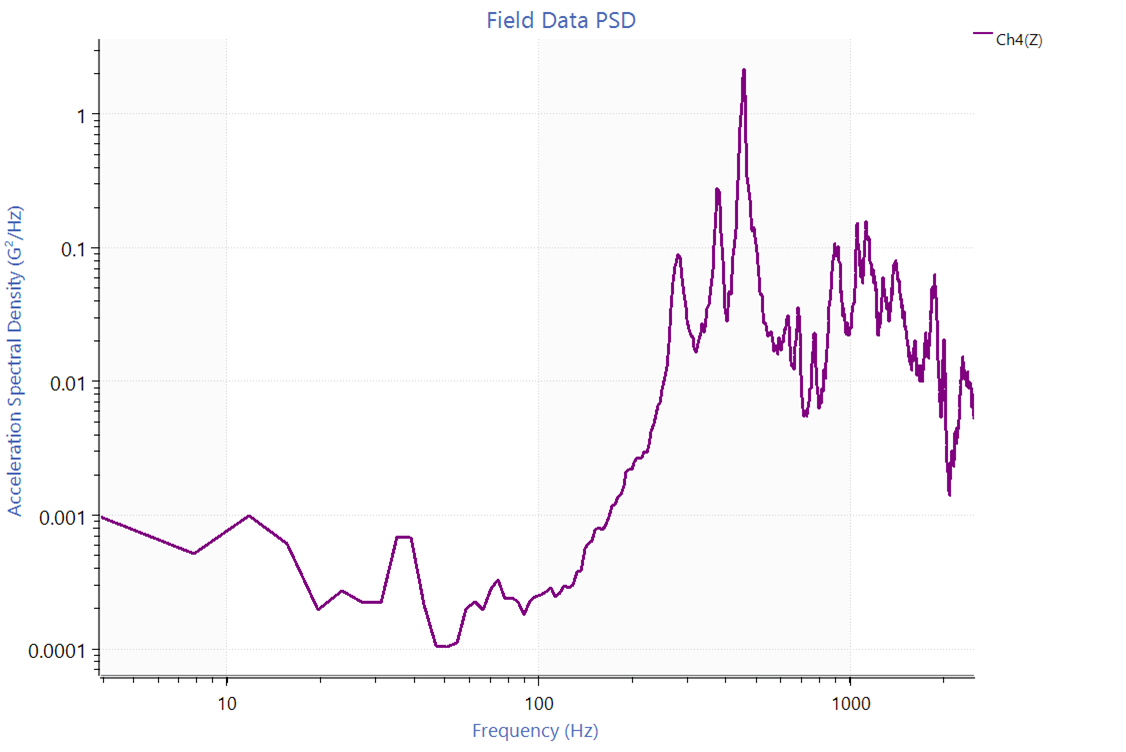
Figure 3 is a PSD of the recorded time-history waveform from Figure 1. It shows a high amplitude peak from about 400 Hz to 600 Hz, which was attributed to the repetitive impulses in the data. The PSD is typical for a random vibration test profile, but this peak would make it difficult to create an accurate random test due to the process of PSD averaging.
Table 1. Properties of PSD in Figure 3.
| PSD Properties | |
| Min frequency | 5 Hz |
| Max frequency | 2,500 Hz |
| Analysis lines | 16384 |
| Overlap | 50% |
| Analysis frames | 92 |
| Averaging DOF | 182 |
A test profile close to the product’s end use contributes to an efficient testing process and a quality product. Averaging out impulse-like events could result in a false pass, where the product passes in the laboratory but fails in the field. A component may fail due to high-G level impulses in the field versus low-G level random vibration at equivalent RMS power during a conventional k=3 test.
For example, electrical connectors wear and loosen over time, and this fatigue often relates to more severe shock or sine-like motions rather than lower amplitude random vibration. Properly recreating these impulses can potentially save the laboratory time and money.
If a product experiences impulse-on-random vibration, a random vibration test will not wholly reflect its operational environment. Engineers need to develop a more suitable test profile to ensure product durability and longevity. This paper recommends an impulse-on-random test developed with the fatigue damage spectrum (FDS).
Impulse-on-random Test Development with the FDS
The FDS quantifies the stress-strain loads placed on a product. Engineers use it to develop a random PSD test profile that is the damage equivalent to the weighted time-history files of the product’s operational environment. An FDS-correlated PSD is a cumulative spectrum that represents the relative damage experienced by the product for all the combined and weighted environments.
For impulse-on-random environments, the FDS method of test development offers several advantages over the PSD. First, engineers can add kurtosis control, which re-introduces peak acceleration values into the random test that PSD averaging would hide. Engineers also have the option of accelerating the random test.
Most importantly, FDS data processing accounts for all peak-to-valley stress cycles, meaning it sums every shock event and small oscillation. In comparison, the PSD is an average, and irregular, non-random data can easily skew the result.
Kurtosis Control
Kurtosis control increases the number of high acceleration peaks in a random vibration test. It converts some of the average accelerations to peak accelerations and lowers others to minimal accelerations, thereby maintaining the test’s total energy while increasing the number of peak accelerations1.
Figure 4 compares an FDS-correlated PSD of the recorded time-waveform data in Figure 1 to the linearly averaged PSD in Figure 3. Kurtosion® time compression in the VibrationVIEW control software was enabled for the FDS test spectrum.
The test profiles are similar, but the FDS-correlated PSD accounts for the data’s higher kurtosis, whereas the PSD averaged out the peaks from the impulses. When the FDS-correlated random test is run with Kurtosion control, the peaks observed in the recorded data will be restored rather than hidden or averaged away like conventional PSD analysis.
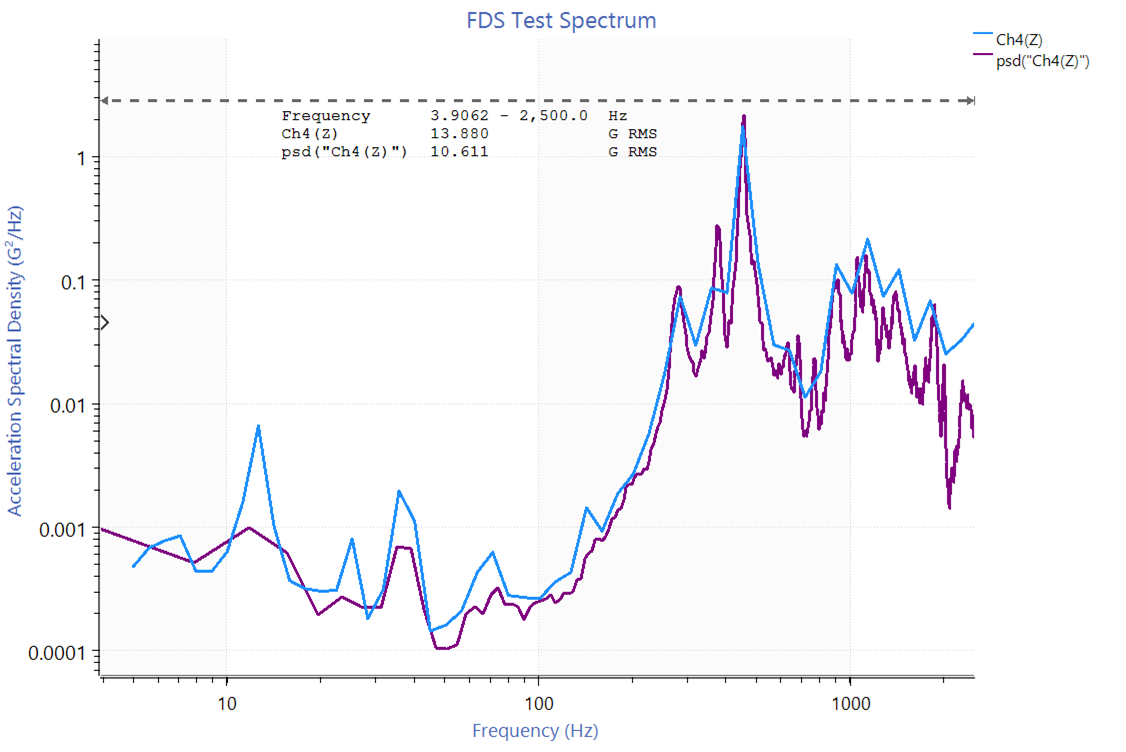
Figure 4. FDS-correlated PSD with kurtosis control compared to linearly averaged PSD using the same data.
Table 2. Properties of FDS-correlated PSD in Figure 4.
| FDS Test Spectrum Properties | |
| Target life time | 5,000 hr |
| Test duration | 100 hr |
| Kurtosis | 12 |
| Transition frequency | 12 |
| Clip above | 9 sigma (recommended by VibrationVIEW) |
When setting a kurtosis value, engineers should consider the balance between test compression and kurtosis value.
Repetitive Impulses
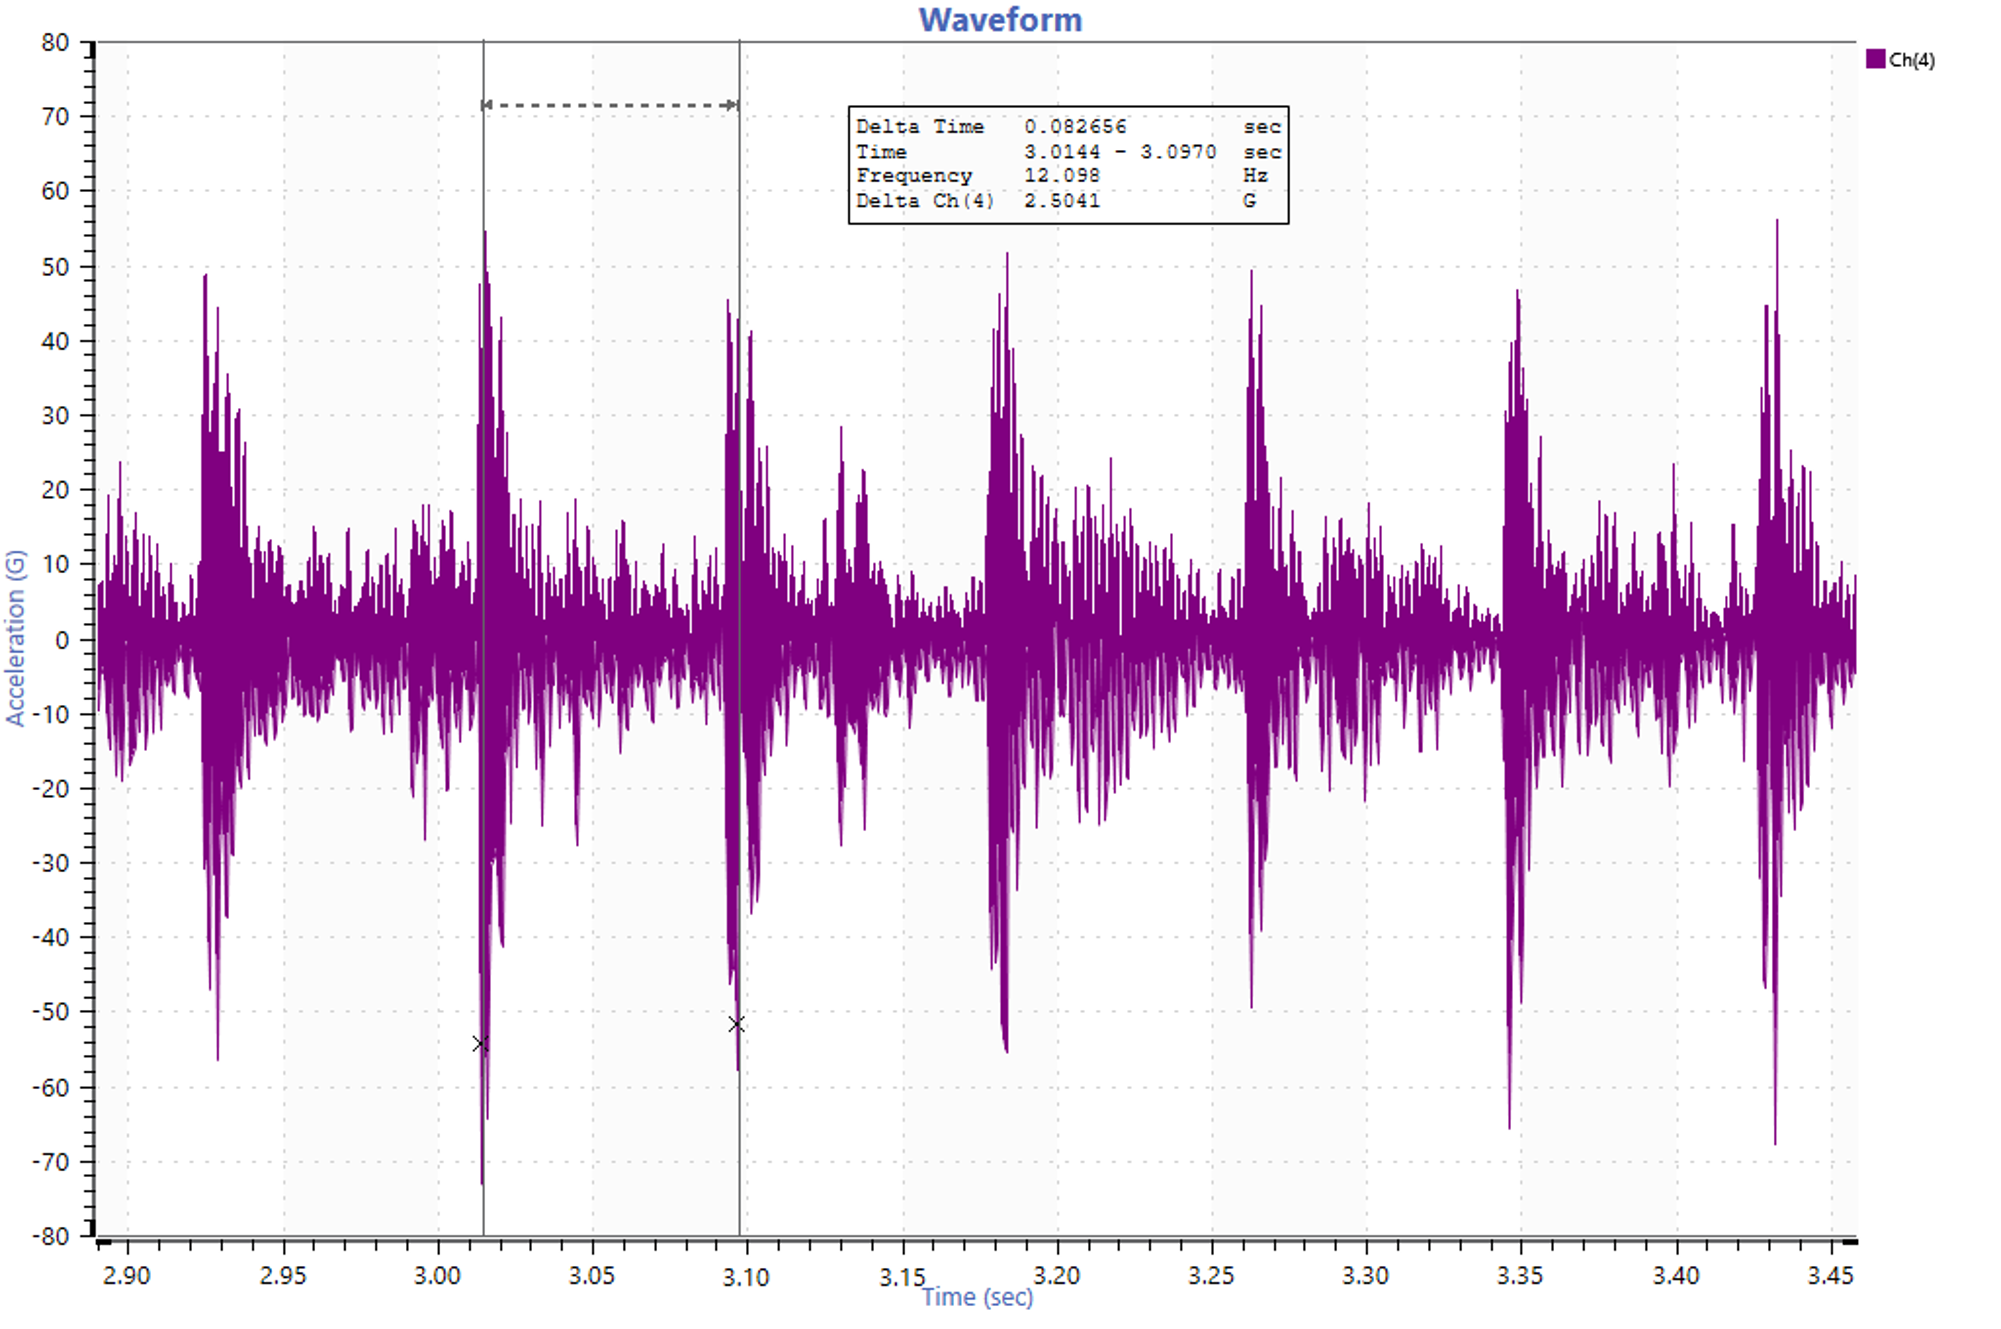
The kurtosis control parameters were adjusted to a constant rate and amplitude to replicate the repetitive impulse behavior on top of the random waveform. This adjustment spaced apart the repetitive impulses generated by kurtosis control at 12 Hz intervals to match the field waveform’s impulse repetition rate (Figure 5). It also ensured a consistent amplitude on each pulse.
Figure 6 compares the recorded time-history waveform and the Kurtosion-controlled impulse-on-random test.
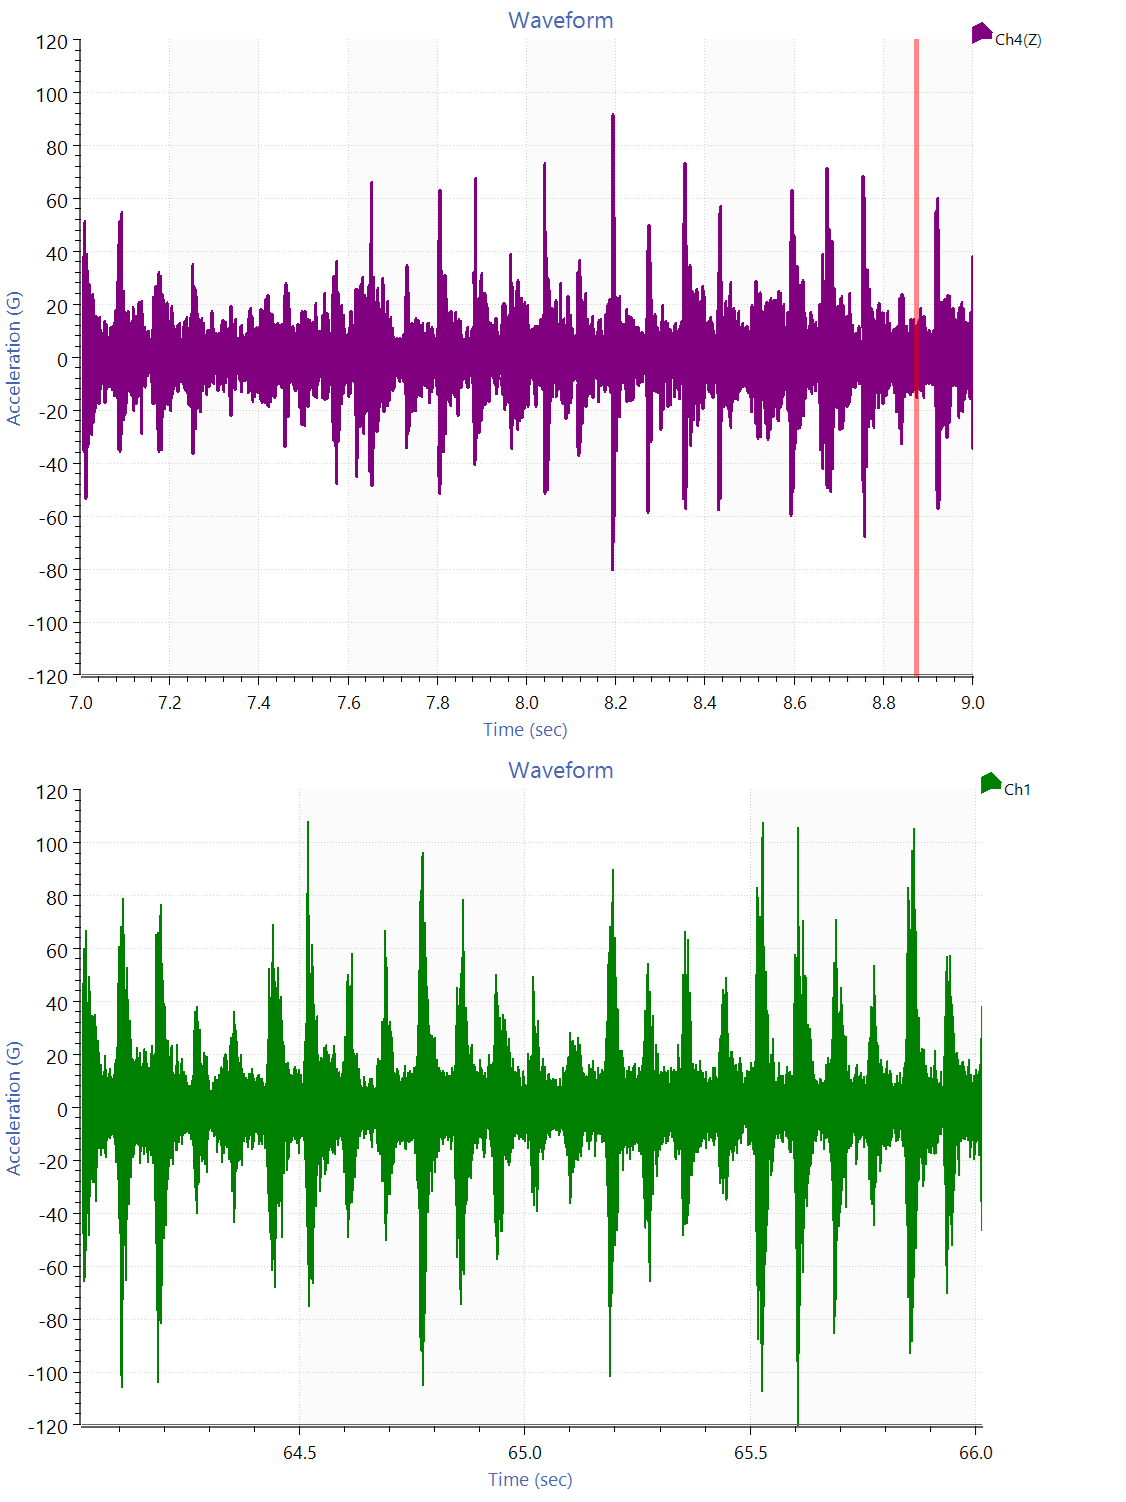
Figure 6. Comparison of original time-history waveform (top) and a Kurtosion-controlled impulse-on-random test (bottom).
Validating the Test Profile
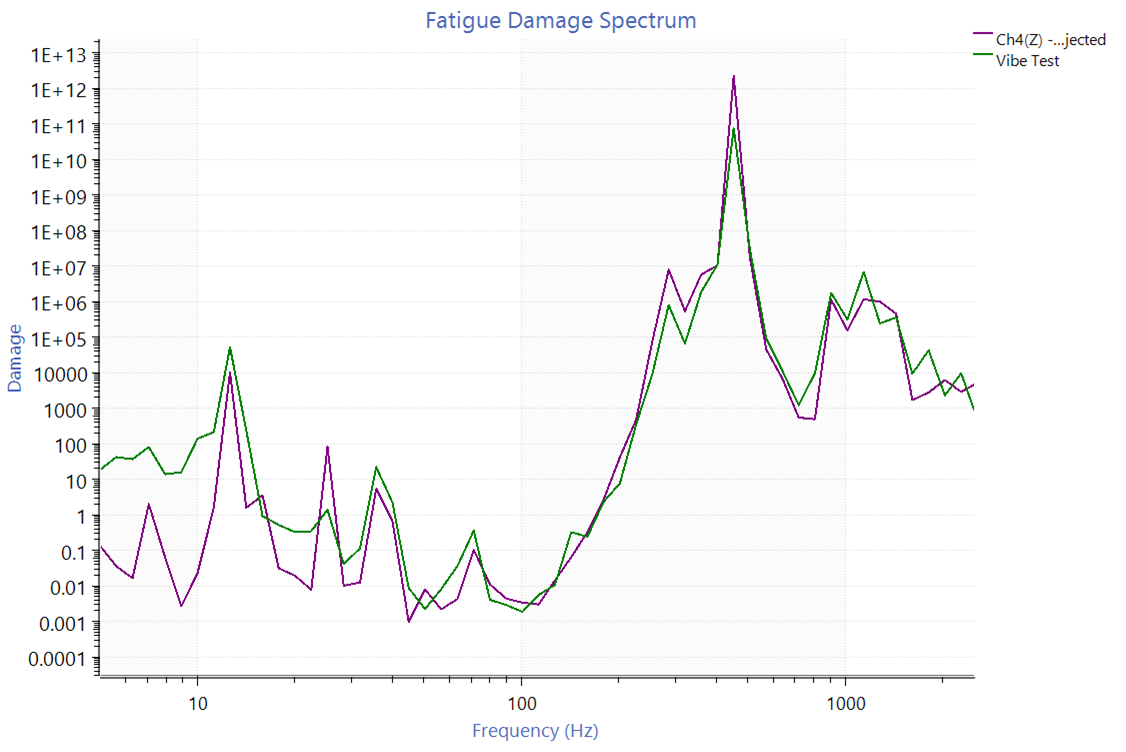
Figure 7 compares the fatigue damage of the recorded time-history waveform and FDS-correlated test profile. Both FDSs were scaled to equivalent damage of 5,000 hours by projecting the potential damage 20 sec snippet of the vibration test to 10 hours. The FDS of the recorded waveform should align with the FDS of the vibration test, which is the case.
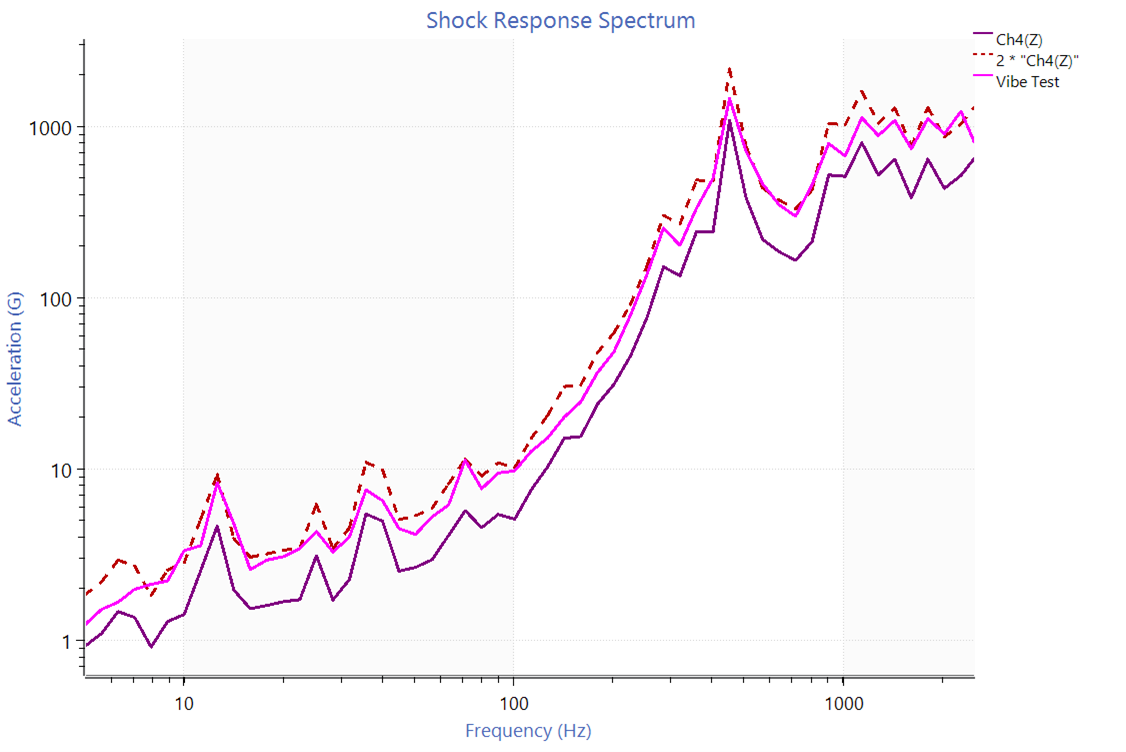
The extreme response spectrum (ERS) can validate if a test acceleration is reasonable. A rule of thumb is that the ERS of the accelerated test should be less than 2x the SRS of the time-history waveform2.
The ERS is typically calculated with a closed-form equation that converts the accelerated random PSD to an ERS3. However, this conversion assumes a kurtosis of 3, and the Kurtosion test had a kurtosis of 12. Therefore, an alternate method was used to estimate the ERS, where the accelerated test was synthesized for 60 seconds, and an SRS of the waveform was calculated. The Kurtosion test SRS was equivalent to the ERS and less than the SRS of the time-history waveform except from 50 to 110 Hz. The engineer can be confident that the test is not over-accelerated.
Conclusion
Understanding a product’s operational environment and using quality field-recorded data to develop a vibration test helps mitigate risk and minimizes the probability of issues later in the development process. A purely random vibration test may under-test products exposed to impulse-on-random environments due to PSD averaging, particularly regarding high accelerations. The FDS offers a potential solution for time data with a mean kurtosis greater than 5. It can incorporate kurtosis control to re-incorporate potentially damaging peaks and accelerate test profiles for faster processes. Engineers can validate an FDS-correlated PSD by comparing the test profile’s fatigue damage and SRS to that of the recorded data.

