All Software Features

Test Acceleration

Test a product for years of service in a fraction of the time

Generate an accelerated vibration test profile to estimate a test item’s life expectancy and determine the potential failures with standard use. ObserVIEW includes three industry-leading methods for accelerating test profiles: FDS for random, SRS for shock, and STAG for sine-on-random.

Download Demo All Software Features

Fatigue Damage Spectrum (FDS)

FDS LogoUse recorded data to create an accelerated random test that represents a lifetime of fatigue damage.

The fatigue damage spectrum (FDS) can create a test profile that replicates a test item’s lifetime operation, weighing its different operational environments based on typical use. The resulting random test is the damage equivalent to that which the test item will experience in its lifetime.

The FDS is based on Miner’s rule of damage: Fatigue damage accumulates over time until it reaches a level that causes a crack or other deformation.

The ObserVIEW software offers the FDS for fatigue damage analysis and random test profile development. Engineers can use the Random Test Generation option to create an accelerated random PSD profile from one or multiple time-history files. The resulting test profile is the damage equivalent to the imported files, accelerated to an appropriate level to save test time.

FDS Software Features

Multi-waveform Projects
Calculate the combined fatigue of multiple weighted waveforms. Overlay and compare multiple waveforms in a single project.

Time-history Statistics
Quickly identify waveform statistics. Random Test Development calculates the RMS, standard deviation, kurtosis, etc. of each time-history file.

Acceleration Validation
Validate the test acceleration level with an extreme response spectrum or shock response spectrum display.

Export Options
Export the accelerated PSD random profile to VibrationVIEW for control on a shaker system.

Sine Tracking Analysis and Generation (STAG)
Sine Tracking Analysis Generation (STAG) software icon VRGenerate an accelerated Sine-on-Random test reflective of an environment with dominant sinusoidal vibration. 

STAG is a real-world evaluation for products that experience dominant rotational vibration rendered as sine tones on a shaker table.

Standard random vibration test acceleration cannot accurately replicate an environment with dominant rotational vibration because both the sine and random background vibration must be analyzed and generated. The more accurate option is a combination of sine and random testing. A sine-on-random test can replicate dominant sinusoidal vibration and its orders as well as produce more consistent results than a random test.

The STAG software performs the tasks necessary to generating an accelerated sine-on-random test. It extracts orders for analysis, accelerates the sine tone profiles, and combines the tones with an FDS analysis of the remaining random content. With the FDS, the STAG tool allows for the analysis, acceleration, and generation of a real-life test.

STAG Software Features

Processing in Seconds
Save time and reduce transposition errors by performing all analyses in the same program. ObserVIEW extracts the orders from the recording before processing the background time waveform so that the FDS accelerates random data only.

Analyze Order Content
Orders of importance can be manually chosen or automatically detected. Analyze the frequency ranges with dominant sine tones and modify the sine tone profile as necessary, including minimizing the low amplitude content or concentrating on a particular peak.

 thumbnail

Shock Response Spectrum (SRS)

SRS software icon VRModify wavelets associated with a time-history waveform to meet SRS demand.

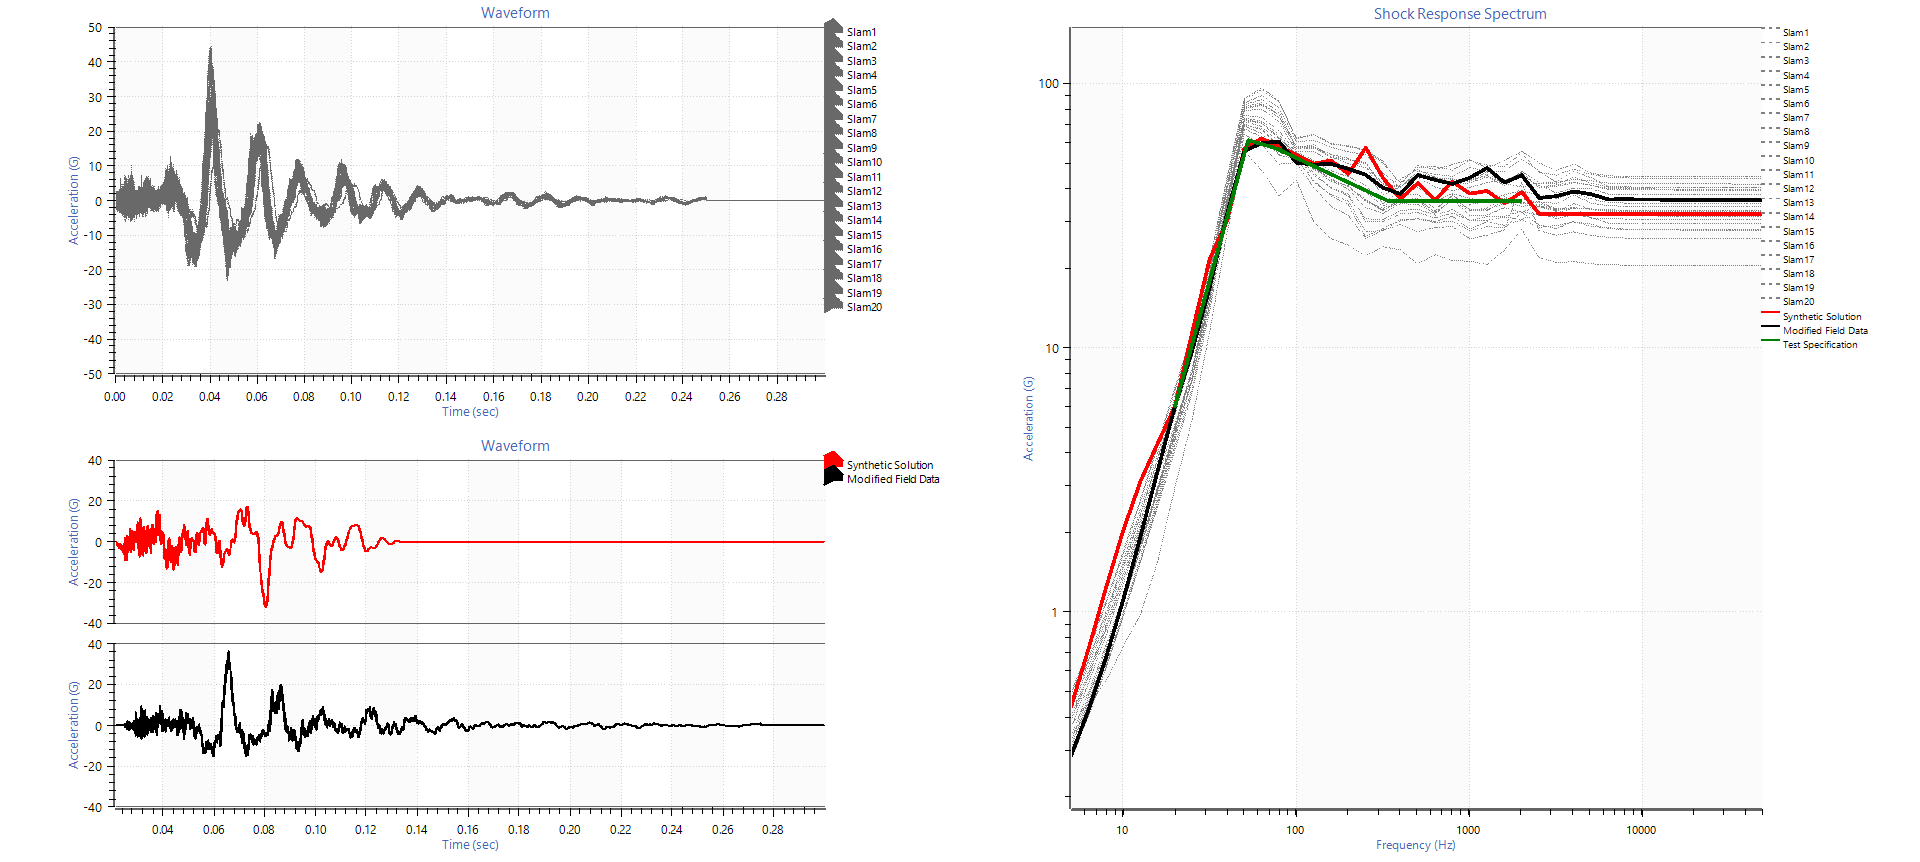
The SRS characterizes a complex shock environment. Engineers can use SRS analysis to define a shaker test profile using enveloped data from multiple shock events.

The SRS allows engineers to better visualize the effects of a shock on a system. They can view the maximum dynamic load of various components or assemblies of a total system under test as a function of frequency. This information can be correlated to the damage potential based on an input response.

ObserVIEW can generate an SRS test profile from one or multiple recorded shock events. From there, engineers can export the SRS trace to VibrationVIEW for synthesis. They can also use the SRS trace to validate a test profile before running it on a shaker, using the tolerance lines feature to confirm that each pulse reaches the SRS demand and is in tolerance.

Test Development with Recorded Data

Free VRU Course

VRU test acceleration courseIn vibration testing, test engineers seek to create test profiles that reflect the real world as close as possible. This helps to ensure that the product can withstand the vibration events it will experience in its lifetime. There are several test development methods where the original environment of a product can be replicated using actual field data. The result is a test profile that closely reflects—or is the equivalent to—the end environment.

In this course, you will learn:

  • Analyzing statistics from a time-history recording
  • Replicating a time-history waveform
  • Calculation of the fatigue damage spectrum (FDS)
  • Generating a Sine-on-Random using field-recorded data
  • Generating an SRS test using field-recorded data
VRU Course

How Can We Help You?

Contact Us