A new version of VibrationVIEW (2025.1) is available for download. In this latest software release, access support for the new VR9700 controller, expanded notching capabilities in Sine and Random, and more.
VR9700 Support
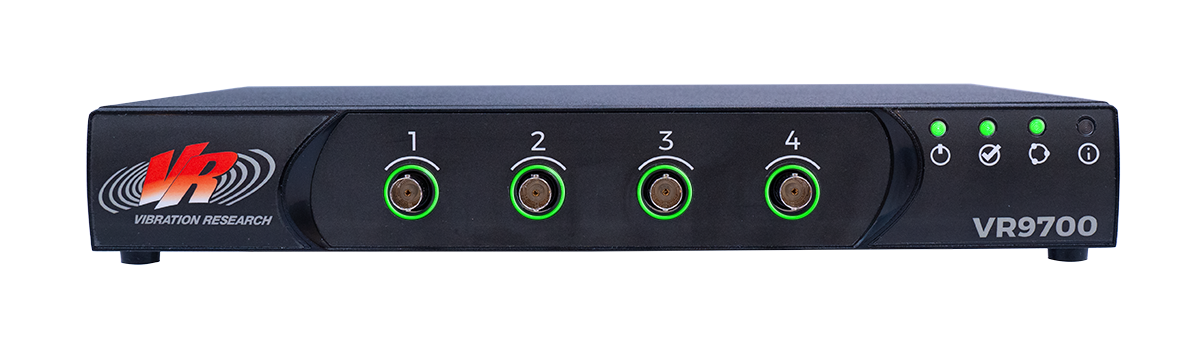
VibrationVIEW 2025 supports Vibration Research’s next generation of hardware: the VR9700. The VR9700 controller is a compact and powerful device that meets many control needs, including low to medium-channel-count setups, single-axis control, and demanding data processing. It has an updated architecture similar to the VR10500 and increased processing power, allowing VR to implement more advanced software features in the future.
Notching Updates
Define a Channel Notch Table and Abort Table
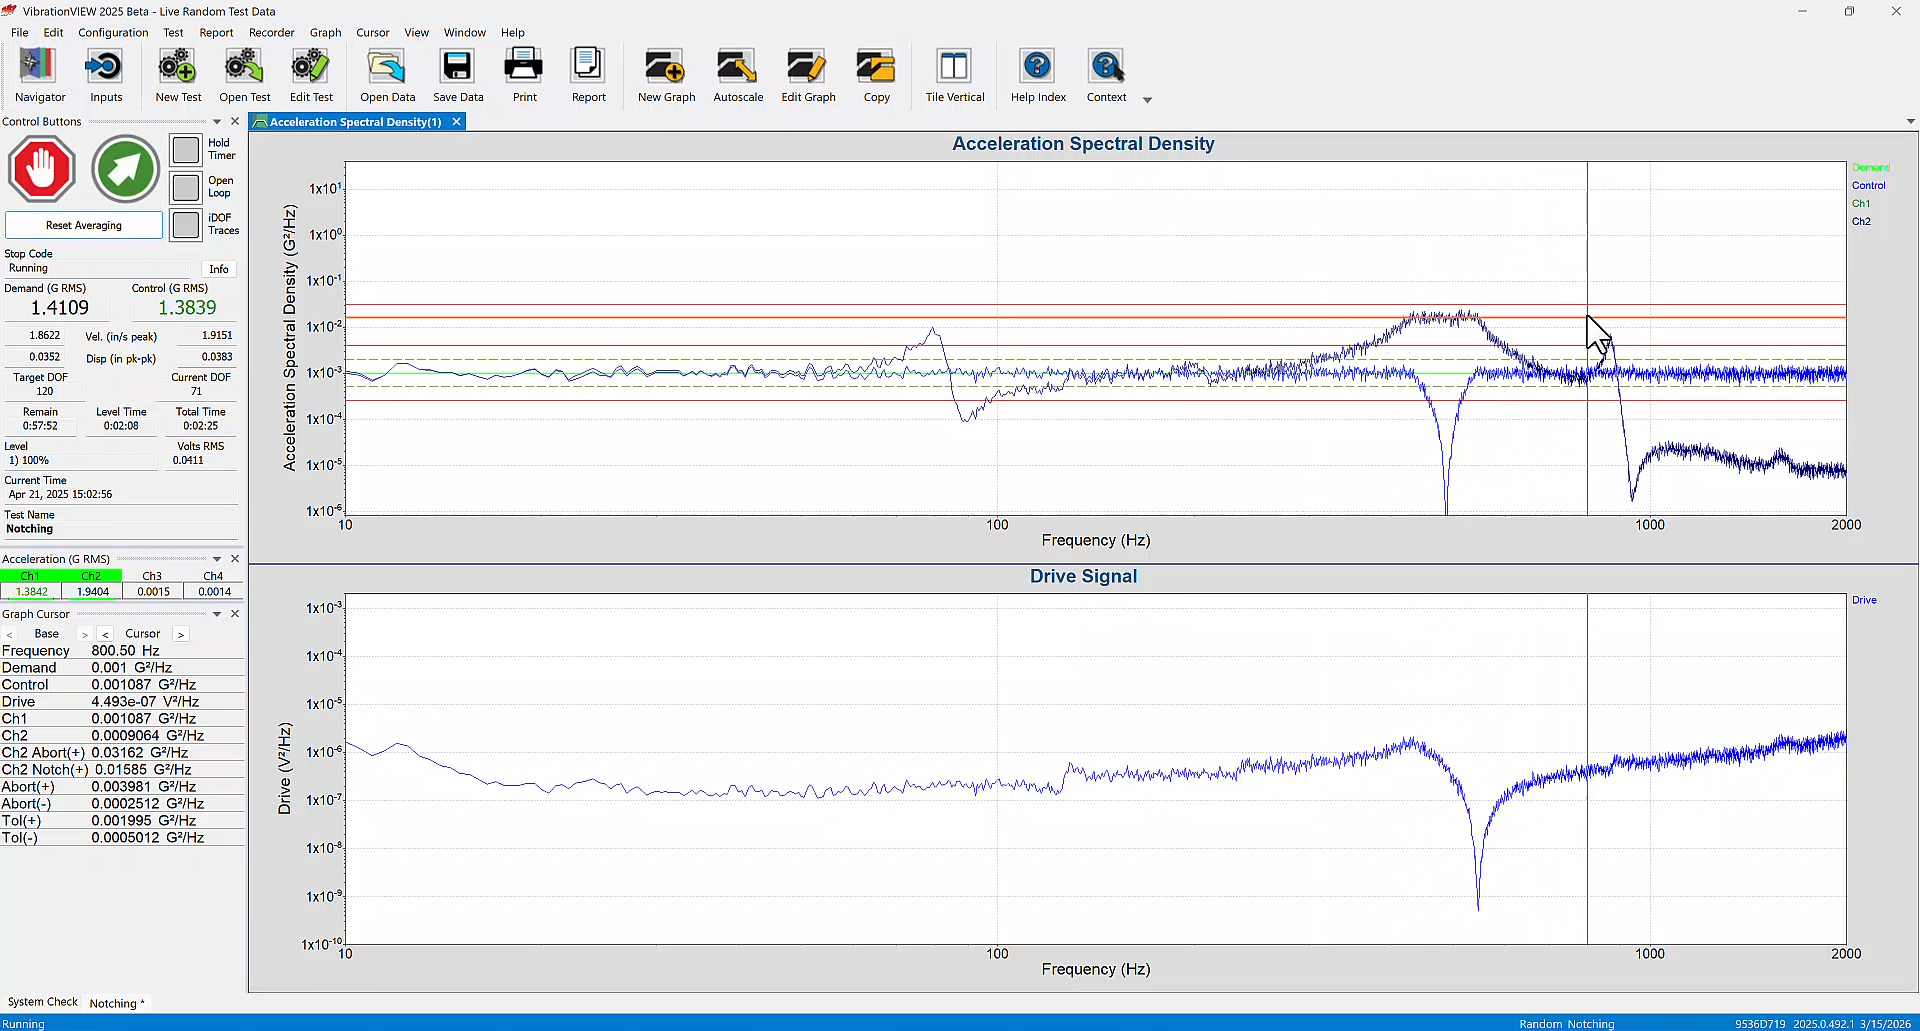
In Sine and Random, users can now define both a notch table and an abort table for an individual channel. This change is reflected in the new channel notch and abort tabs in the Sine and Random test settings.
Test specifications in industries such as aerospace may define a notch and abort table for inputs. This option also gives users more flexibility when defining test limits.
Applications
- Define a channel abort on a notched channel as a fixed dB above demand; if the notch is not successful, the test will abort
- Define a channel abort on a notched channel as a breakpoint table; if the notch is not successful, the test will abort
- Specify the number of lines that must be above the channel abort for the test to abort
- Specify the lines that must be above the channel abort for the test to abort as a percentage of the defined abort trace
- Use the same lines setting on a channel abort as other limits
- View limits on the channel abort tab when using the same limits for the channel abort as the normal limits
Specify Notch Abort Max Outliers Independent of Profile Limits
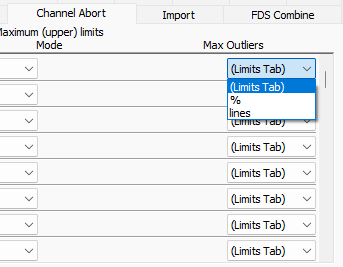
Max Outliers drop-down list on the Channel Abort tab.
In previous versions of Random mode, users could set abort limits using the profile limits or by notching on an individual channel. In version 2025, users can specify maximum notch abort outliers independent of the profile limits’ maximum outliers. In the new Channel Abort tab, version 2025 includes the option to define a specific number or percent of lines for a channel abort, ensuring the test will abort appropriately.
A user may want to define a channel abort over a narrow band rather than the full bandwidth of the test. In version 2025, for example, they could set a single abort limit on the notch table with a 10% maximum outlier for the demand trace.
This feature may be beneficial when:
- The user expects the abort percentage/lines to apply to the ranges of the abort table and not the entire test bandwidth
- The user wants to see the value of the corresponding global limit on the channel abort tab
Sine Report Parameters for Notch Tables
Users can assign notching profiles to individual channels in the Sine and Random test modes. Upper limits “notch” the drive output amplitude at the specified maximum value, and lower limits “boost” the drive output if it drops below the specified minimum value. Notching profiles can be displayed on acceleration/velocity/displacement vs. frequency graphs.
New report parameters have been added to version 2025 so users can easily report Sine notching configurations.
Shock Testing
Display Te/TE Calculation Start and End on SRS Graph
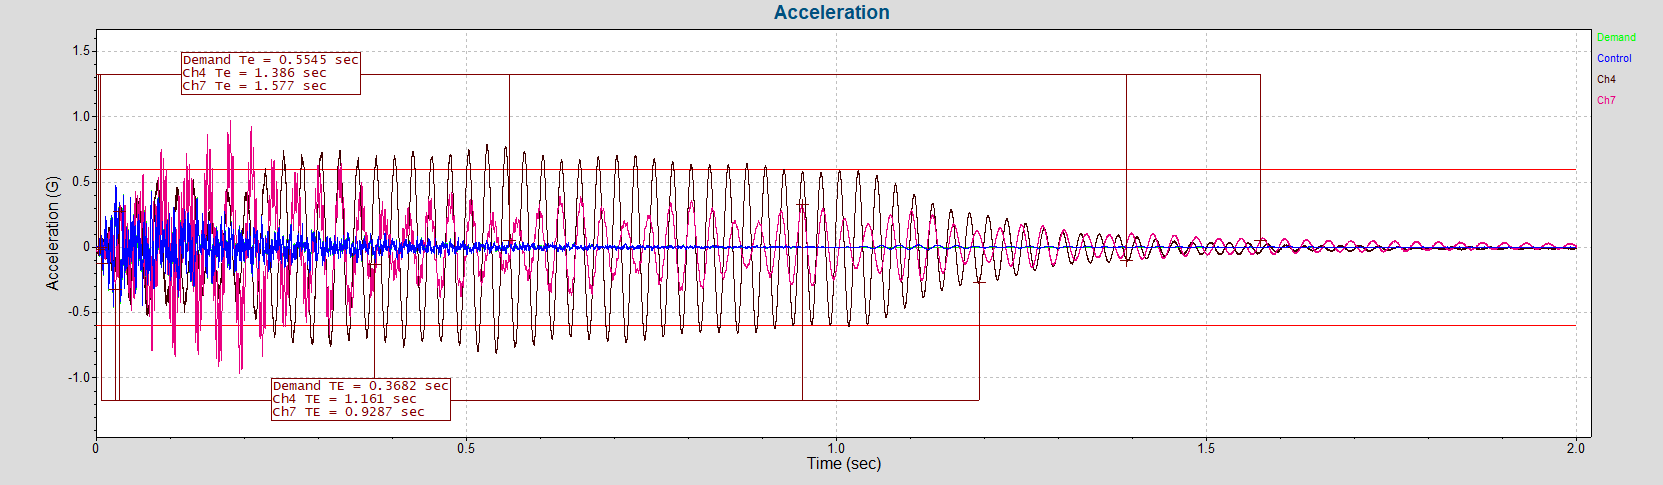
Te and TE are parameters defined by MIL-STD-810 for Shock Response Spectrum (SRS) tests. The new annotate Te/TE command adds the start and end range of the Te/TE calculation for all input channels (and the Demand) to the selected graph.
Applications
- View the Te/TE SRS values in a report graph
- View the source of Te/TE values to more easily interpret the data
To add/edit/remove the Te/TE annotation, navigate to the Schedule tab in the Test Settings dialog and point to the top right corner. The Options drop-down list includes the display options.
MIL-STD-810H 516.8 Test Profiles
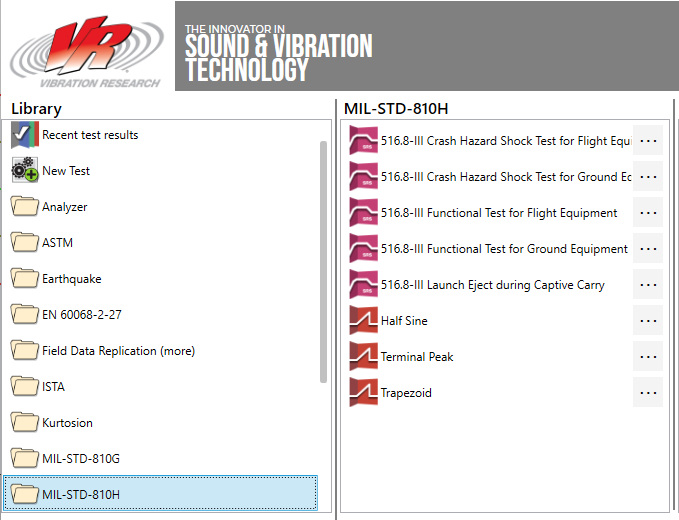
MIL-STD-810H 516.8 test profiles in VibrationVIEW’s Navigator.
Test profiles associated with MIL-STD-810H 516.8: Crash Hazard Shock Test for Flight Equipment Profiles were added to the library in version 2025. These are shock response spectrum (SRS) tests for flight and ground equipment.
Test Schedule in Transient Capture
![]()
A Schedule tab has been added to the Transient Capture test mode in version 2025, allowing for better sequencing of events. In this test mode and others, users can sequence actions to occur at the start/end of the test, in between levels, after an abort, etc. Additionally, they can use Forms, Reports and Execute functions from other test types.
Many Transient Capture tests are single shock pulses, so the scheduled actions will likely occur before or after the control system runs the pulse. The Transient Capture schedule options include:
Enter Form
Example use: A form appears after the system runs the transient pulse but before the program generates a report so a user can add additional information to the report.
View Report
Example use: The program automatically generates a report after the system runs the transient pulse so the engineer can review the response before running the pulse again.
Save Report
Example use: The program automatically saves a report, and then the system repeats the transient pulse event.
3D Graphing Updates
![]()
VibrationVIEW includes an analyzer program that creates a 3D waterfall plot from vibration data files or live data. Version 2025 includes new 3D graphing options for four test modes.
- Sine: Plot a 3D waterfall graph (acceleration vs frequency vs time) to track resonance changes over time
- Random: Access more 3D graphing options
- Shock: Plot a 3D waterfall graph to show shock events and spectrum over time
- FDR: Plot a 3D waterfall graph to show a changing spectrum and transfer function over time
In Sine, the most common application of 3D graphs is overlaying sine sweeps or transmissibility graphs from repetitive sweeps.
In Random, the most common application is graphing regularly sampled slices over the duration of the test. This display helps users visualize changes that may occur over the duration of the test. Changes in resonance, drive voltage, and other characteristics are clear when data are viewed as historical comparisons from the beginning to the end of the test.
To plot data as a waterfall, right-click the trace and select the Make Waterfall Graph option.
Sine Resonance Table Annotations
Report vectors allow users to insert tables of vector data into a report template. Resonance table vectors include the frequency, acceleration, and peak value at resonance.
VibrationVIEW 2025 also includes control acceleration/velocity/displacement and resonance velocity/displacement vectors. With these new options, users can specify acceleration/velocity/displacement (AVD) for Sine control and response resonances regardless of the control unit of the corresponding breakpoint segment.
Applications
- Show the control value for each resonance in the same category of the corresponding segment in the sine breakpoint table
- Specify the AVD unit for control or response resonance vectors where the control unit for the corresponding segment is not AVD and display the entries in the control unit of the segment
Event Log Pane
An event log was added as a docking pane to the toolbar. The log is a scrollable and sortable list. Engineers can view an event log in the context of the test and filter and sort events to identify those of interest.
Transducer Database Converter Tool
The Transducer Database allows the user to store their transducers’ information in a central location, simplifying input configuration. The Import option imports a list of transducers to the active database, saving time from manual entry.
In version 2025, the VibrationVIEW team built a program to convert a .csv file to a database file (.db) for import into VibrationVIEW.
Additional Features
- Support for ObserVIEW FDS import files
- Enable/disable boundary box on annotations
- Copy/paste random-on-random (RoR) table into test definition
- Control on DC sensors in Random like displacement transducers or MEMS sensors