Simulate random vibration reflective of the real world
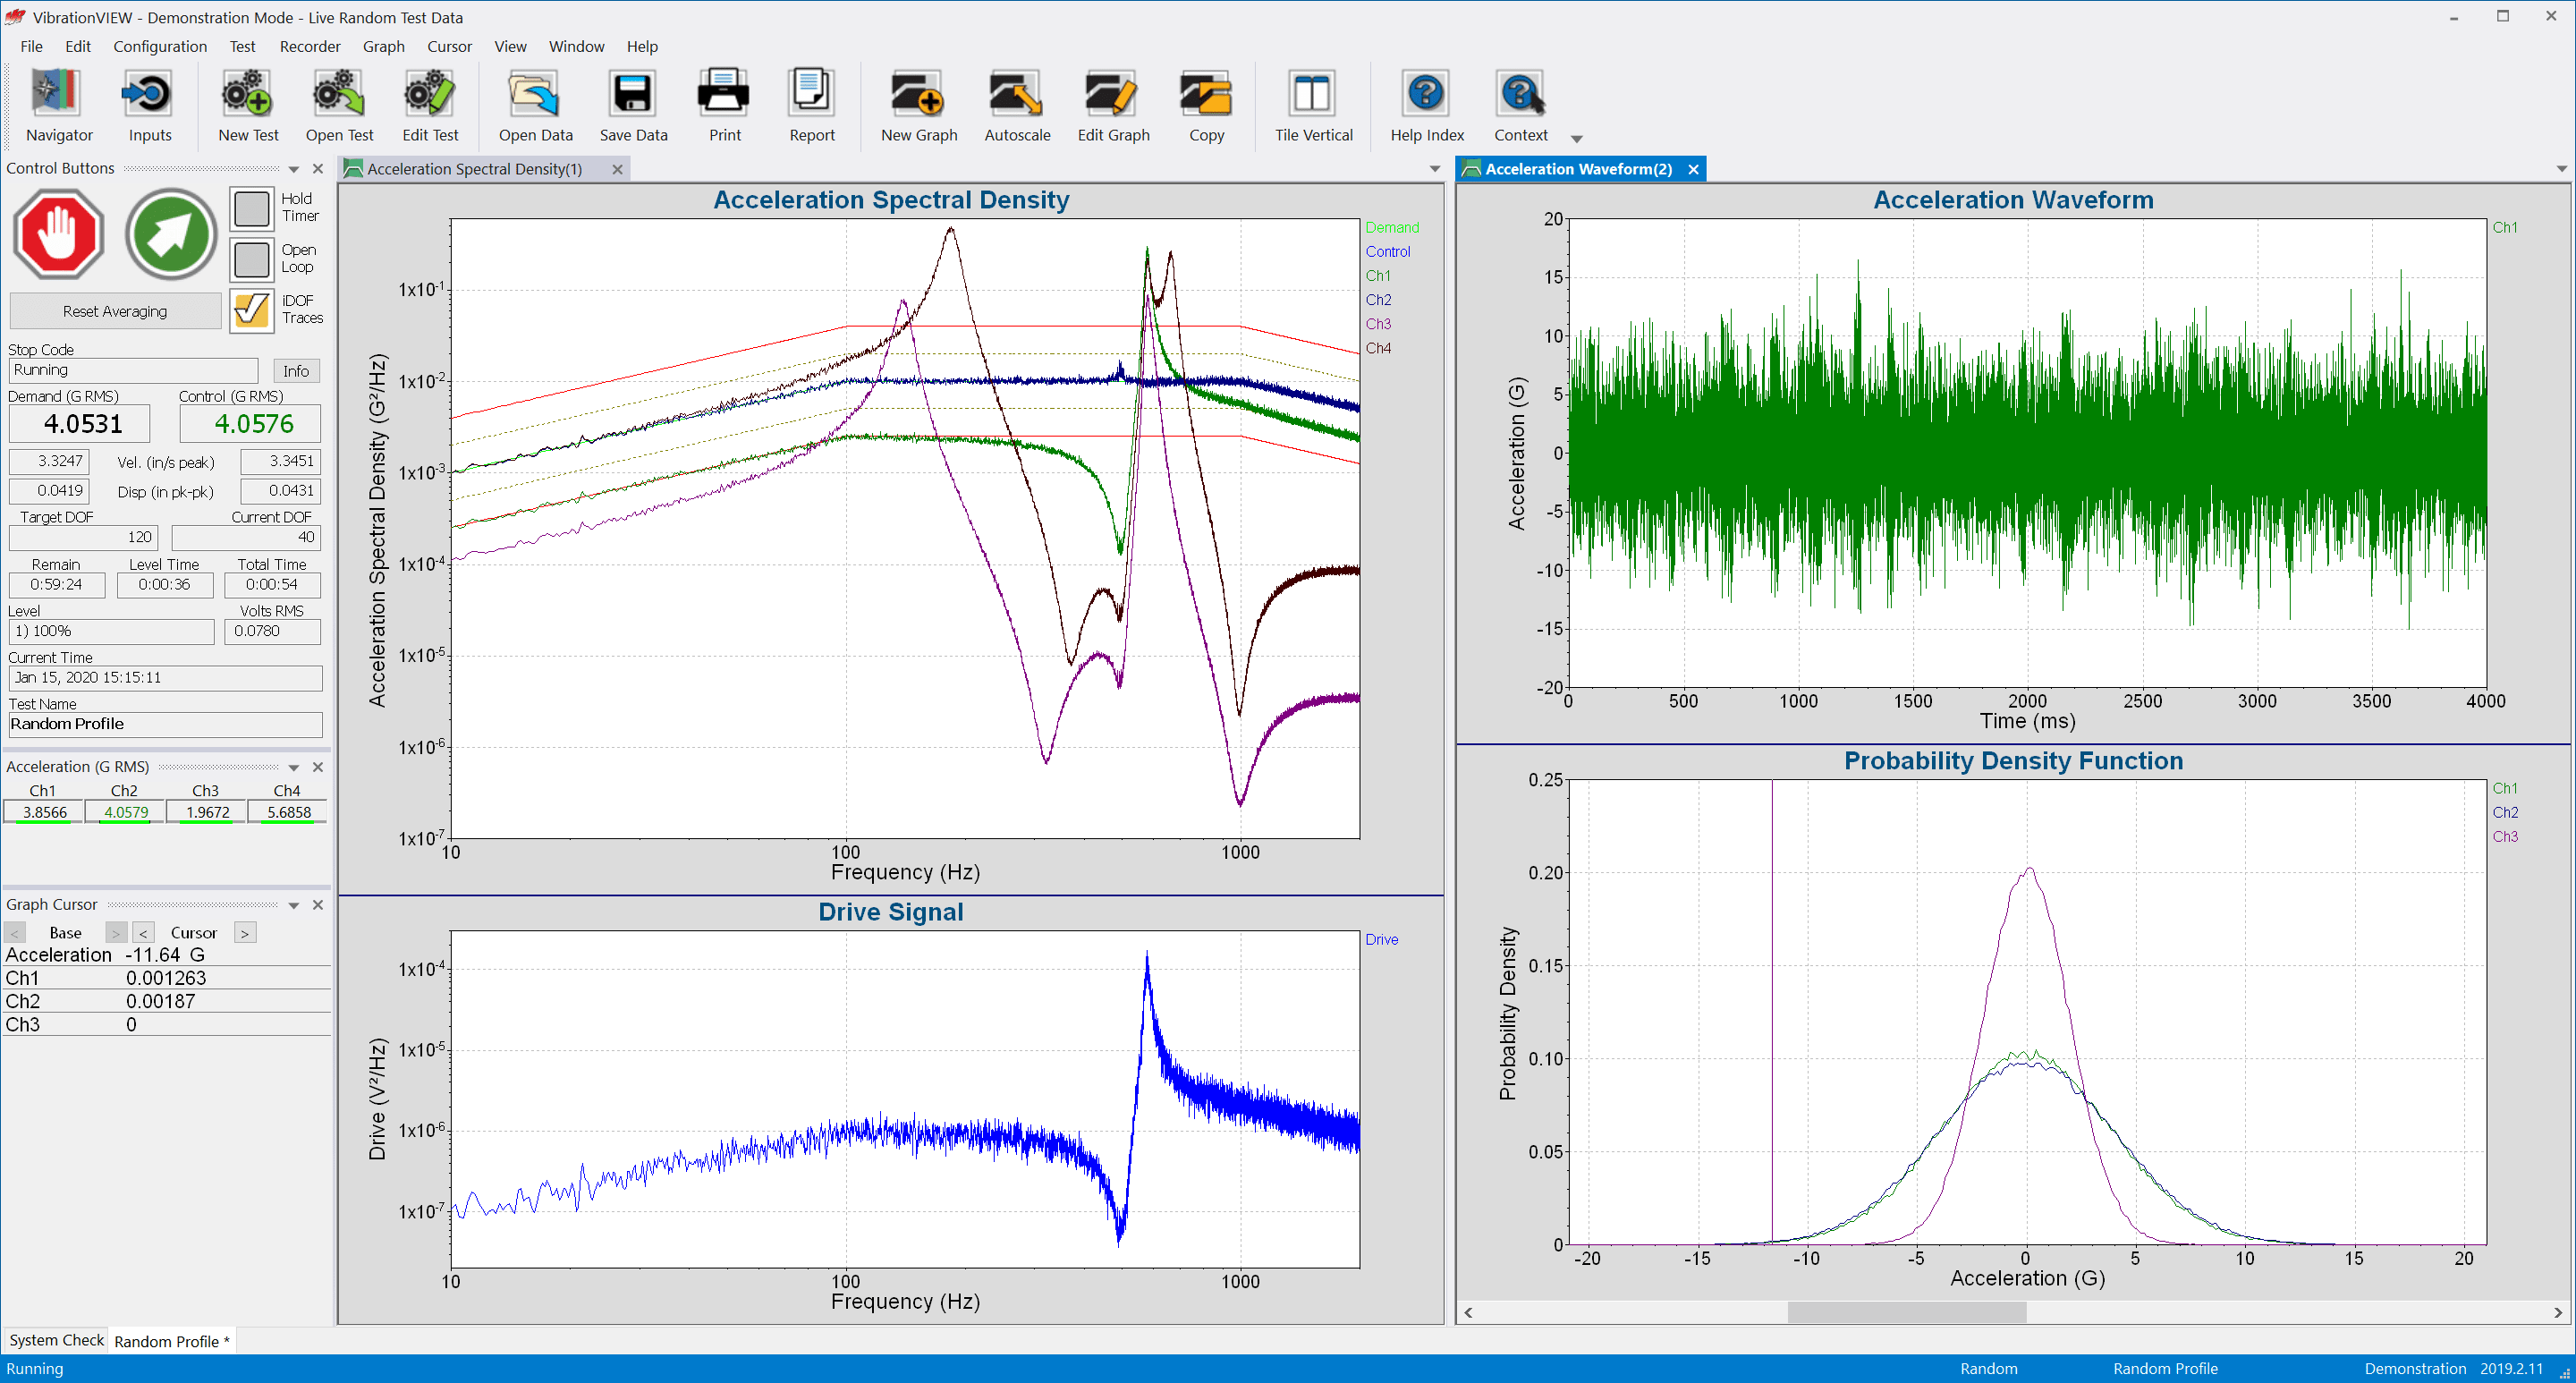
Gain a comprehensive understanding of a product’s response to the vibrations it will encounter in its environment of use. With 104,000 lines of control, Random provides the highest possible control in an easy-to-use format. Analyze random data with a comprehensive suite of graph display options or generate a test from recorded data with our advanced test development options.
VibrationVIEW supports 104,000 lines of control to meet your test’s required frequency resolution. The standard frequency range is DC-4,900Hz, which can be extended up to 50,000Hz with the high-frequency option (VR9203).
Easy Test Entry
Enter frequency or amplitude breakpoints in an easy-to-read, tabular format. VibrationVIEW supports over 9,999 breakpoints, suitable for virtually any test specification.
Control constant or ramped acceleration, velocity, or displacement.
Automatically calculate the intersection frequency between any constant acceleration, velocity, or displacement.
Input Configuration
Use one input channel for control or configure up to 512 input channels with multi-channel averaging or multi-channel notching. You can enable individual channel tolerances for spectrum and RMS limits.
One to 4 control loops can be run simultaneously to control up to four shakers independently with four individually configurable and statistically independent waveforms.
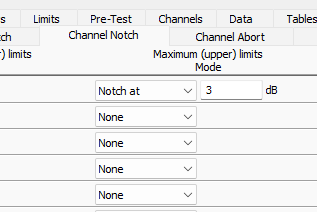
Independent Notching Profiles
Assign notching limits to individual channels and, if necessary, the software will notch the drive output to keep the channel input below the defined profile. Notching limits can be a decibel level relative to the demand profile or scaled from the demand profile. Minimum limits can also be defined to boost the drive output.
You can apply abort limits to individual channels simultaneously with a notch/boost limit. The test will safely shut down if the channel reaches the abort limit.
Virtual Channels
Engineers can reference virtual channels when configuring notches/aborts in Random, using them in the same way as a response channel from a physical sensor. Virtual channels are the result of user-defined expressions that combine input channels. They perform linear math in the time domain and can reference channels across hardware units.
Virtual Channels turn raw data into insights, eliminating the need to process data in external tools.
Part number 9200
VR9100
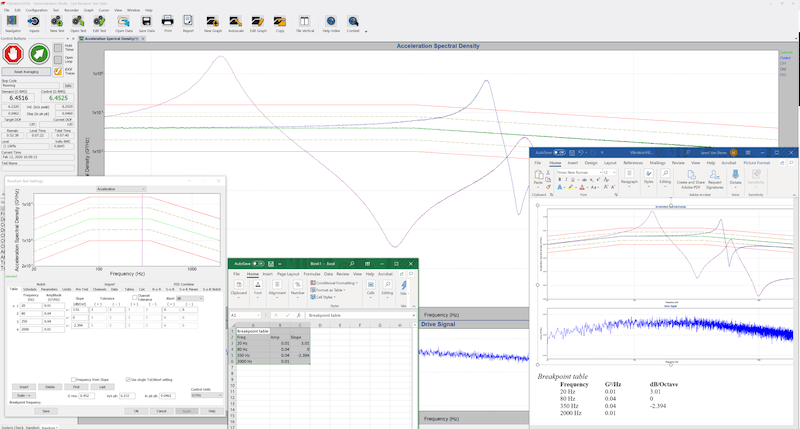
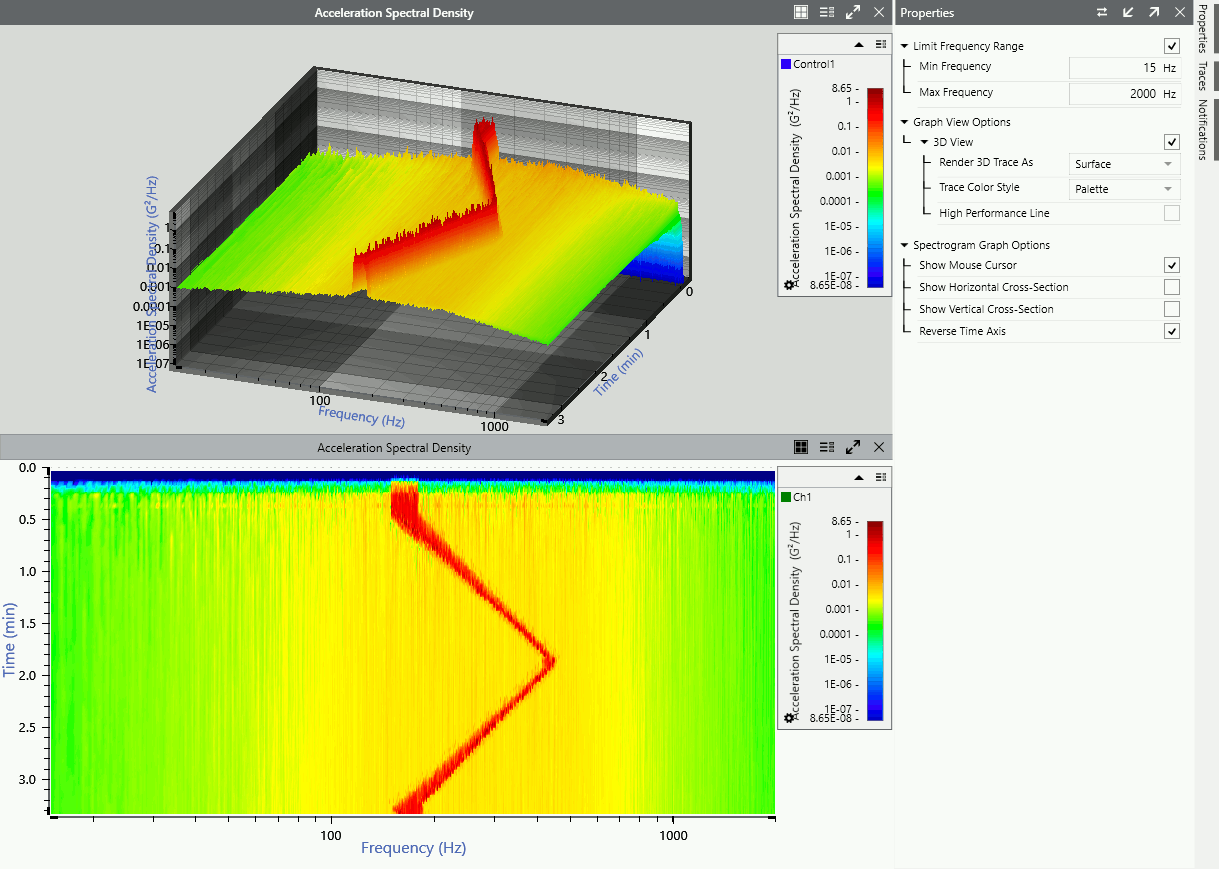
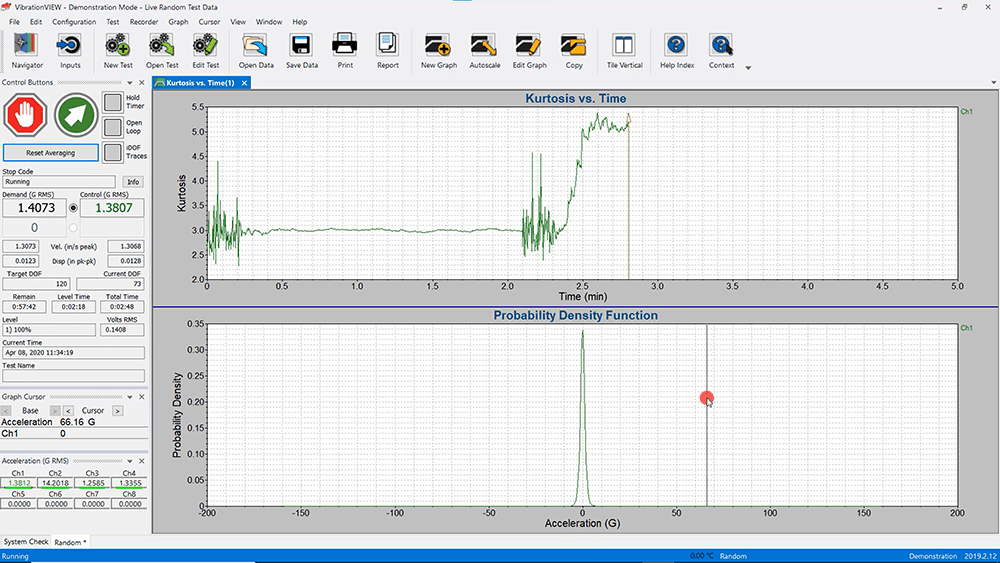
Random Graph Display Options
Available graph display options include power spectral density (PSD), scatter plot, and kurtosis versus time. With 3D graphing, you can create a waterfall plot from random vibration data files or live data.
Graphs can be easily auto-scaled, and the cursor display can be adjusted. Data and text annotations can be easily placed on the graphs, and data values update live with changes.
Test and Level Scheduling
Tests can be scheduled to run for a user-defined length of time
Spectrum levels can be scaled by a specified dB level, percentage, or for a specified RMS acceleration
Level schedules can run for various durations at different acceleration levels
Levels can be changed while the test is running
Advanced Testing Options
Fatigue Damage Spectrum
Measure a product’s fatigue and calculate its lifespan. For years, engineers have used methods to calculate the lifespan of a product based on the material s/n curve. The FDS software applies rain flow analysis techniques to measure vibration, quantifies equivalent fatigue, and calculates the time to failure. It uses industry-standard life acceleration techniques to shorten test time. Add-on software (VR9209). Learn more.
Random Import
Import analog or digital time data to automatically generate a random profile. Import PSD data to analyze statistics from a time-history recording. Add-on software (VR9204). Learn more.
Mixed-mode Test Profiles
A vibration environment is not always purely random or sinusoidal, but rather a combination of vibration modes. Mixed-mode vibration testing is used to simulate these complex field environments. VibrationVIEW includes three methods of mixed-mode testing: Sine-on-Random, Random-on-Random, and Sine-on-Sine. Add-on software. Learn more.
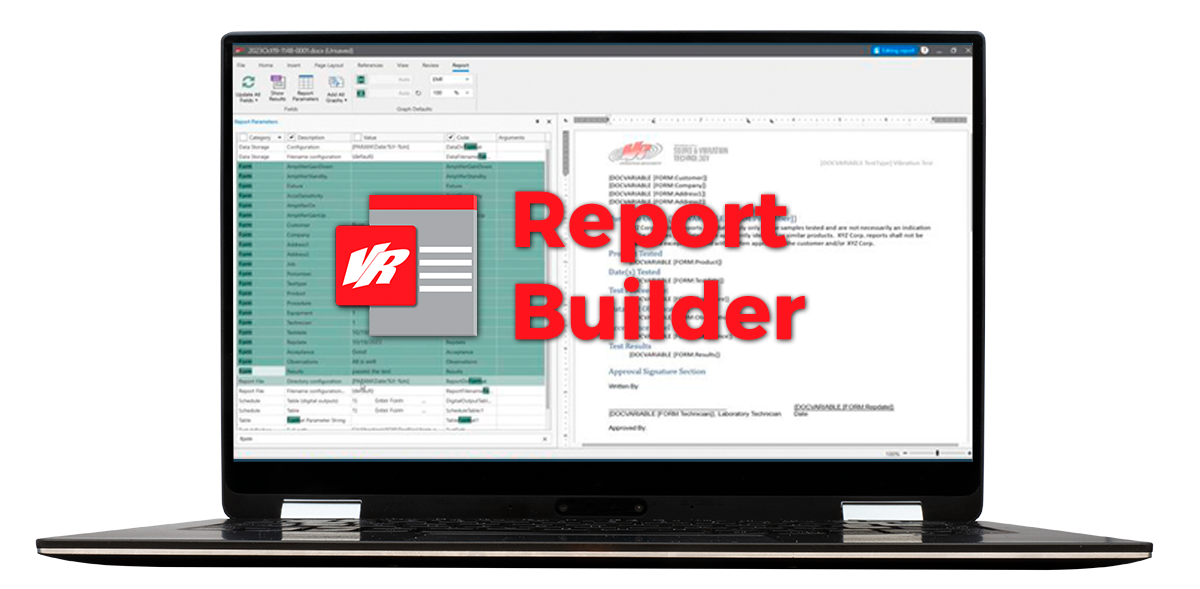
Reporting
Generate Professional Test Reports with Ease
Fulfill all your test reporting needs with user-friendly options for customization. VibrationVIEW can generate vibration test reports as a docx, PDF, HTML, or Excel file and includes a built-in Report Builder.
Kurtosis Control
Kurtosion® Add-on Software
Kurtosion® is a closed-loop method of kurtosis control developed by Vibration Research. It allows for the adjustment of kurtosis levels while maintaining the test profile and spectrum attributes.
Add Kurtosion (VR9205) to the Random software for test profiles that are more realistic to real-life situations or to break a product quickly without using more energy.
Short Duration Random Testing
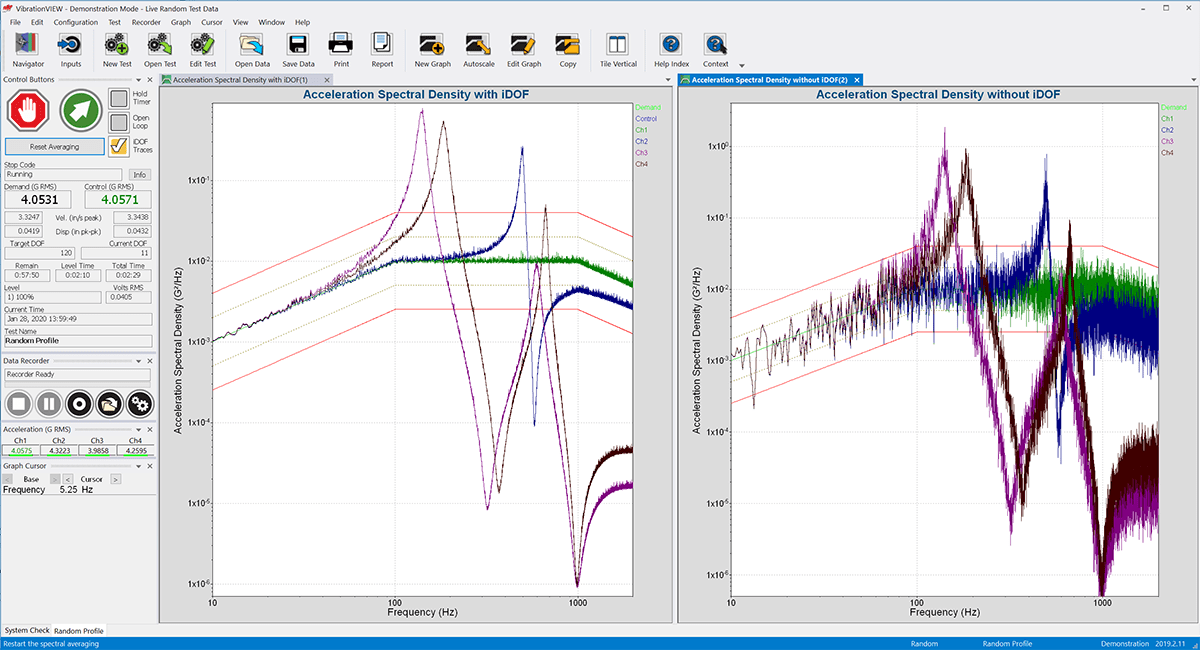
iDOF Add-on Software
Testing facilities in industries such as aerospace often test high-value equipment at high levels of random vibration for a brief period. The goal is to run a realistic test to identify reliability issues without damaging the equipment.
The Instant Degrees of Freedom® (iDOF) calculation is a statistically valid way to provide smooth lines and an in-tolerance PSD in a brief testing period (VR9210).
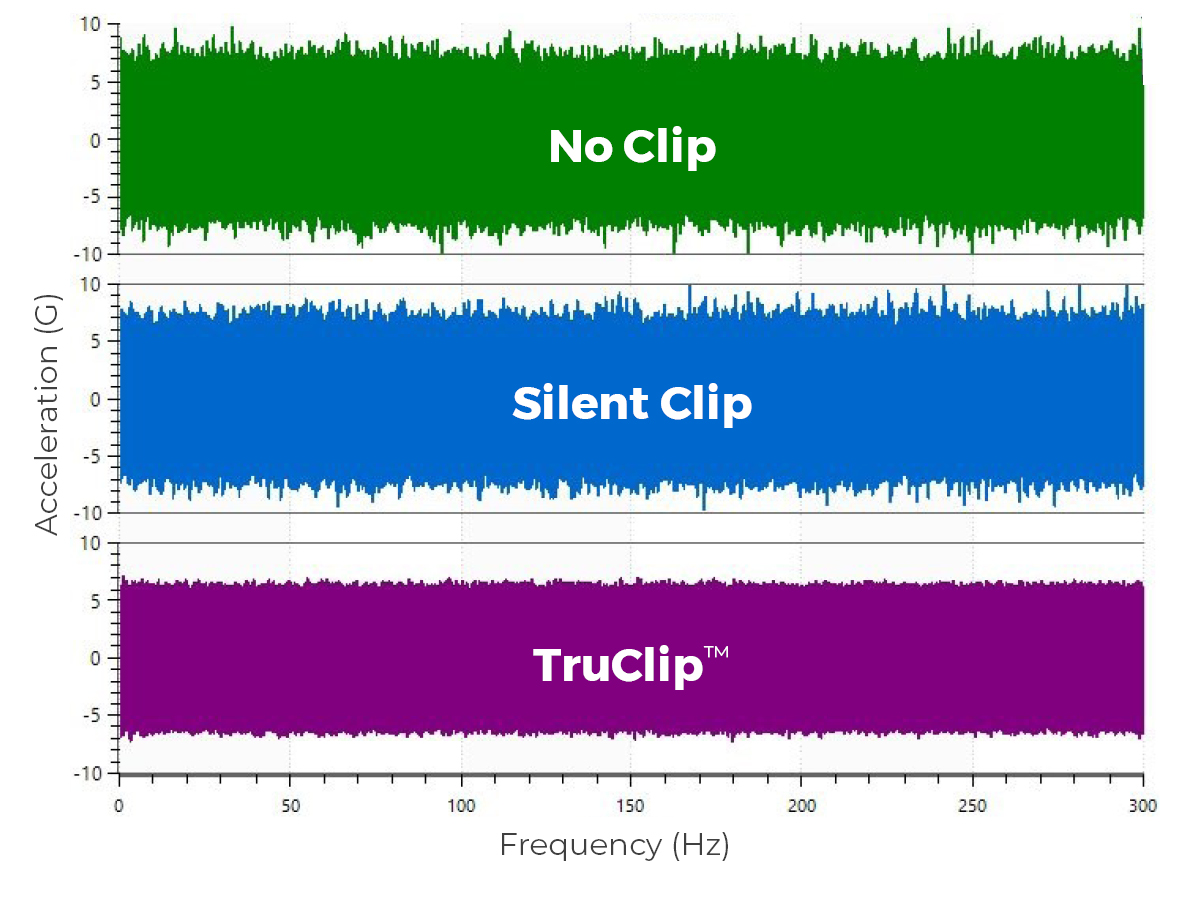
TruClip™
Vibration Research’s innovative clipping method reduces high sigma peaks in random test acceleration, velocity, or displacement.
Add TruClip to a Random Test
Minimize extreme peaks experienced by a sensitive DUT
Run a test near the maximum displacement, velocity, or acceleration of the shaker
Run a test that only requires a specific acceleration, velocity, or displacement range
What is Random Vibration Testing?
Real-world vibration is inherently random and non-deterministic. A random vibration test, then, is a realistic method of bringing a product to failure.
Fundamentals of VibrationVIEW Part 2 Random Theory
When Should I Select a Random Test?
A random vibration test can be generated to represent one or multiple operational environments. It can also be accelerated to represent a lifetime of damage that can be run in a lab.
A random vibration test excites all the frequencies of the device under test and is a realistic representation of the operational environment. By exciting all potential resonances at the same time, a random vibration test reveals the interaction between multiple resonances. It often reflects a greater damage potential than a sine test.
Select a random vibration test when
Testing a product against vibrations that will occur in the field environment
Determining how a product will respond to the excitement of multiple resonances at the same time